This document provides a summary of the Climate Impact Report prepared by ISS ESG [1] , which is based on its proprietary methodology and refers to the holdings of the Etica SICAV (hereafter referred to as “the portfolio”). The report incorporates metrics that comply with the Task Force on Climate-related Financial Disclosures’ (TCFD [2]) guidelines.
All asset classes were analysed in accordance with the TCFD recommendations and grouped into two components: Equity Portfolio (including unlabelled equities and corporate bonds) and Sovereign Bond Portfolio (comprising only unlabelled sovereign securities).
Green bonds were excluded from the calculation of issuers’ emissions, as the proceeds are allocated exclusively to the financing of environmental projects. The TCFD analysis measures the contribution of each issuer to greenhouse gas emissions based on its weight in the portfolio, so that the correct share of emissions can be attributed to Etica’s investment. Including green bonds in this calculation would increase the weighting of the relevant issuer in the portfolio, and consequently the emissions financed. This would distort the results.
A separate assessment of the use of proceeds from both corporate and sovereign green bonds is available in the report.
This illustrates the climate performance of the portfolio as of 31 December 2025 and compares it with that of the MSCI World Universal Net Total Return Index (hereinafter referred to as ‘the benchmark’), which is used as the market benchmark on the same date. The content is divided into the following sections: carbon metrics, scenario analysis, transition risk analysis, physical risk analysis, corporate green bonds, sovereign emissions analysis, conclusions.
- Corporate carbon metrics
- Scenario analysis
- Physical risk analysis
- Transition Risk Analysis
- Corporate Green Bonds: analisi dell’uso dei proventi
- Analysis of sovereign emissions
- Sovereign Green Bond: use of proceeds analysis
- Conclusion
Corporate carbon metrics
The carbon metrics used in the corporate analysis are those recommended by the TCFD and are defined as follows:
- Emissions Exposure – How much emissions am I responsible for as an investor?
Measures the portfolio’s ‘financed’ or ‘owned’ emissions, including Scope 1, 2 and 3. Represents the absolute amount of emissions attributable to investments in the portfolio. - Relative Carbon Footprint – For every million invested, what is my emissions exposure?
Measures the emissions financed for every million euro invested, applying the principle of ownership. It is expressed in tonnes of CO₂ equivalent per million euro invested and is an impact risk metric. - Carbon Intensity – How efficient are the companies I invest in in terms of emissions?
It calculates the portfolio’s emissions in relation to the revenues generated by the issuers. It is obtained by dividing the portfolio’s financed emissions by ‘owned’ revenues and is expressed in tonnes of CO₂ equivalent per million euro of revenues. It measures the risk associated with the operational performance of companies. - Weighted Average Carbon Intensity (WACI) – What is my exposure to high-emission investments?
It assesses the portfolio’s exposure to carbon-intensive companies. Unlike financed emissions, this metric does not apply the ownership principle but considers the weighted average emissions per million euros of revenues of the issuers in the portfolio. It is expressed in tonnes of CO₂ equivalent per million euros of revenues and is a transition risk indicator.
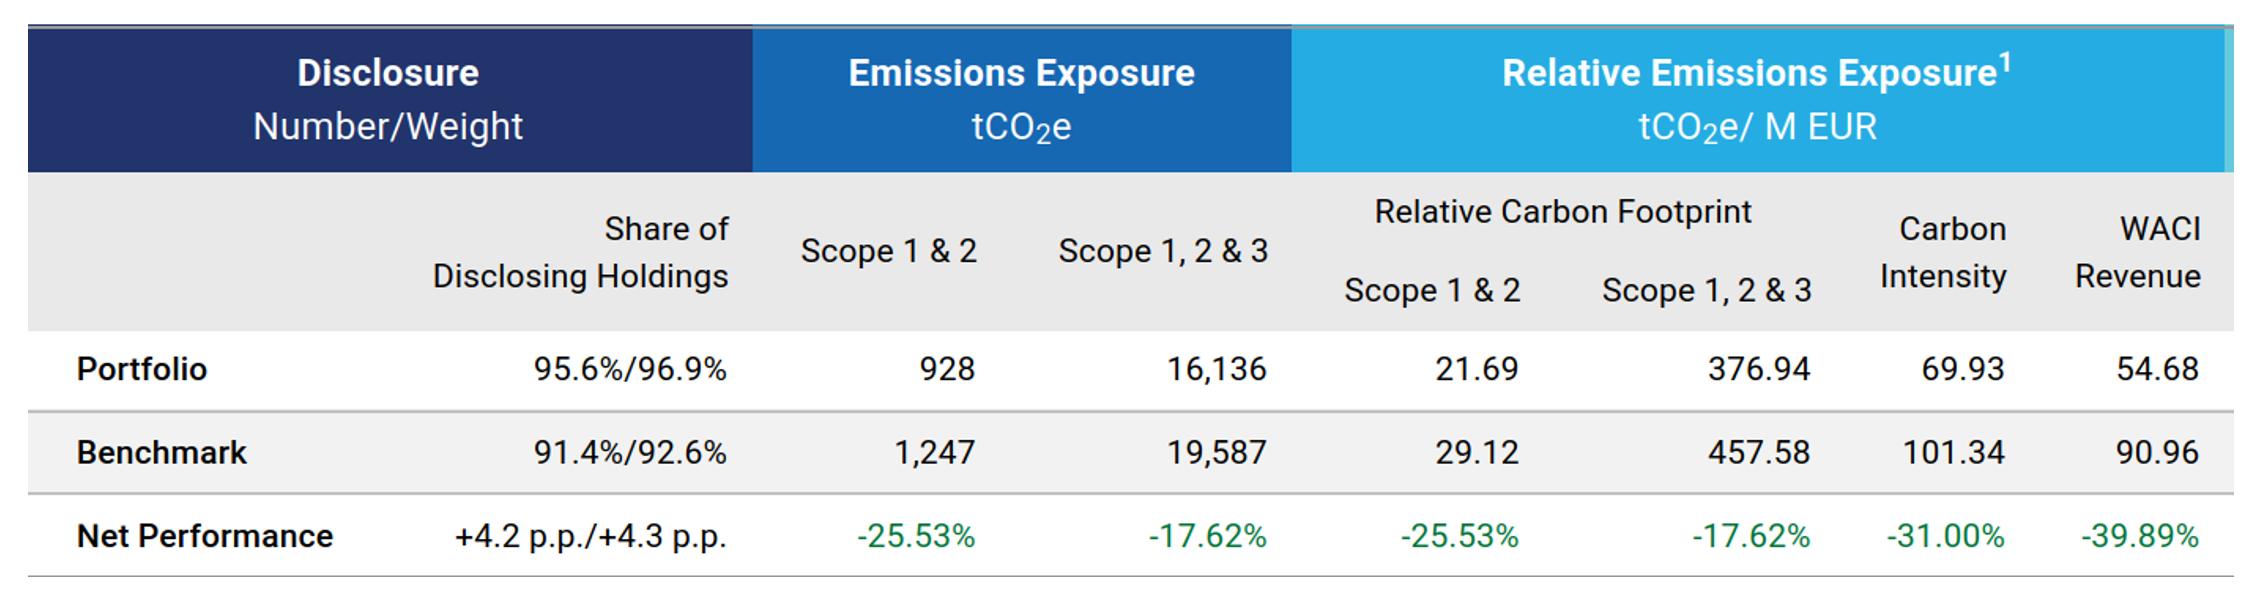
The portfolio delivers very strong overall results, outperforming the benchmark across all metrics. In terms of disclosure quality, the share of issuers reporting emissions is higher by +4.2 p.p. (by count) and +4.3 p.p. (by weight), confirming a superior level of transparency in the underlying data.
Turning to the carbon metrics:
- Emissions Exposure: the portfolio shows a –25.53% difference versus the benchmark for Scope 1 & 2, and –17.62% for Scope 1, 2 & 3, indicating lower financed emissions for the SICAV.
- Relative Carbon Footprint (tCO₂e per million invested): the portfolio reports –25.53% for Scope 1 & 2 and –17.62% for Scope 1, 2 & 3, highlighting fewer emissions per million invested.
- Carbon Intensity (tCO₂e per million revenues): –31.00% compared to the benchmark, showing that companies in the portfolio generate fewer emissions per unit of revenue and are therefore more efficient.
- WACI (tCO₂e per million revenues, portfolio‑weighted): –39.89%, indicating lower exposure to high‑emission‑intensity sectors.
Overall, these results are primarily driven by improvements in issuers’ emissions profiles and by the combined effect of ESG‑driven and financial choices made in portfolio construction.
Even if the issuers had remained the same and their weightings unchanged between 2024 and 2025, we would still have seen a 12.14% reduction in emissions intensity thanks to an improvement in the issuers’ climate performance. Furthermore, portfolio turnover (i.e., the inclusion and exclusion of issuers) contributed a further 8.53% reduction.
In total, 56% of the emissions reduction in 2025 is attributable to issuers’ improved emissions performance combined with changes in their portfolio weights, while 41% is attributable to ESG and financial selection effects.
The attribution analysis provides a clearer view of the impact of these decisions. The following table compares the portfolio’s Scope 1 and 2 emissions with those of the benchmark, breaking down the total difference into two components:
- Sector Allocation: measures how much of the result derives from overweighting or underweighting specific sectors;
- Issuer Selection: captures the effect of selecting issuers that are more or less emission‑intensive within each sector.
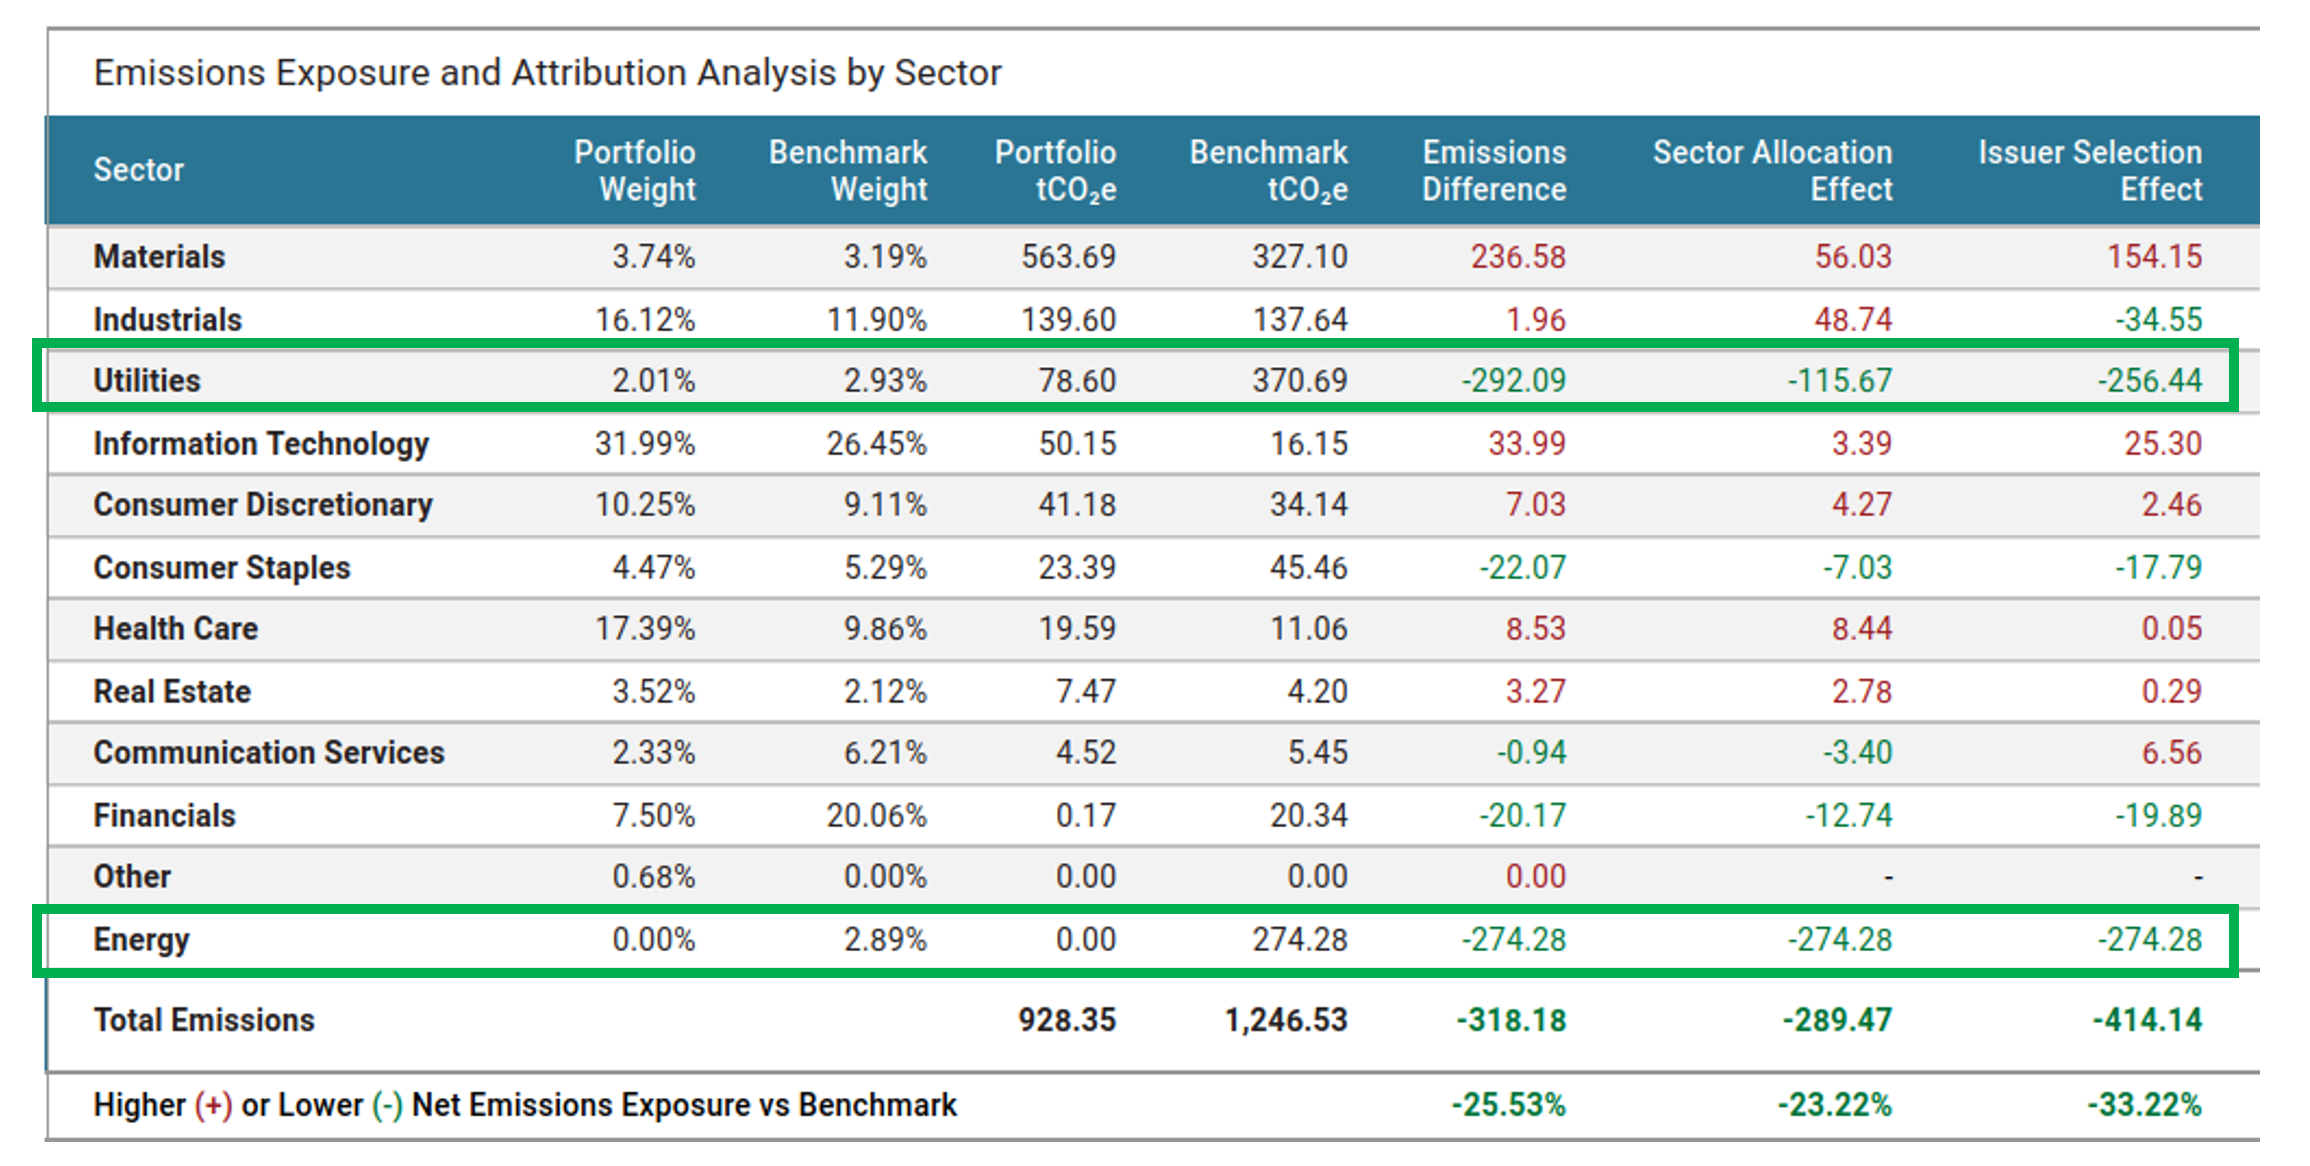
The portfolio shows -274.28 tCO₂e (-25.53%) fewer total emissions than the benchmark.
The attribution effects indicate that this improvement derives from:
- Sector Allocation: -23.22%
The portfolio is underexposed to sectors with higher carbon intensity. This contributes significantly to the reduction in financed emissions. - Issuer Selection: 33.22%
Within sectors, the portfolio favours issuers with substantially lower emissions profiles than their peers, further amplifying the reduction in emissions relative to the benchmark [3].
It is important to note that a portfolio more heavily weighted toward high‑emission‑intensity sectors will naturally exhibit higher exposure to greenhouse gas emissions. However, this effect can be mitigated by selecting issuers with lower emission intensities within the same sectors.
In particular, the methodological choice to exclude the energy sector and to apply stringent climate assessments to companies involved in fossil‑fuel‑related activities – primarily within the utilities sector – explains a significant portion of the improved results. This approach, fully consistent with Etica Sgr’s philosophy, helps keep the portfolio’s emissions profile structurally lower than that of the benchmark.
Looking again at the breakdown, the Materials sector is where the portfolio shows the highest Scope 1 and 2 emissions exposure relative to the benchmark. This outcome is driven by several structural factors:
- The strict methodology applied to this sector significantly narrows the investable universe, leaving only a limited set of issuers compatible with sustainability criteria. With such a constrained universe, it is expected that certain eligible issuers become overweighted relative to the benchmark, resulting in higher emissions exposure;
- The Materials sector is, by definition, hard‑to‑abate, characterised by production processes that are difficult to electrify and by decarbonisation technologies that are not yet fully mature. Even with strict screening, the remaining issuers inherently maintain relatively high emission levels.
Conversely, the situation in the Utilities sector is the opposite. The availability of well‑established decarbonisation technologies, such as renewable energy generation, enables the selection of issuers with lower emissions intensities. This supports a positive attribution effect for Utilities and explains why the portfolio achieves better results in this sector compared with the benchmark, even if the opposite effect is observed in others.
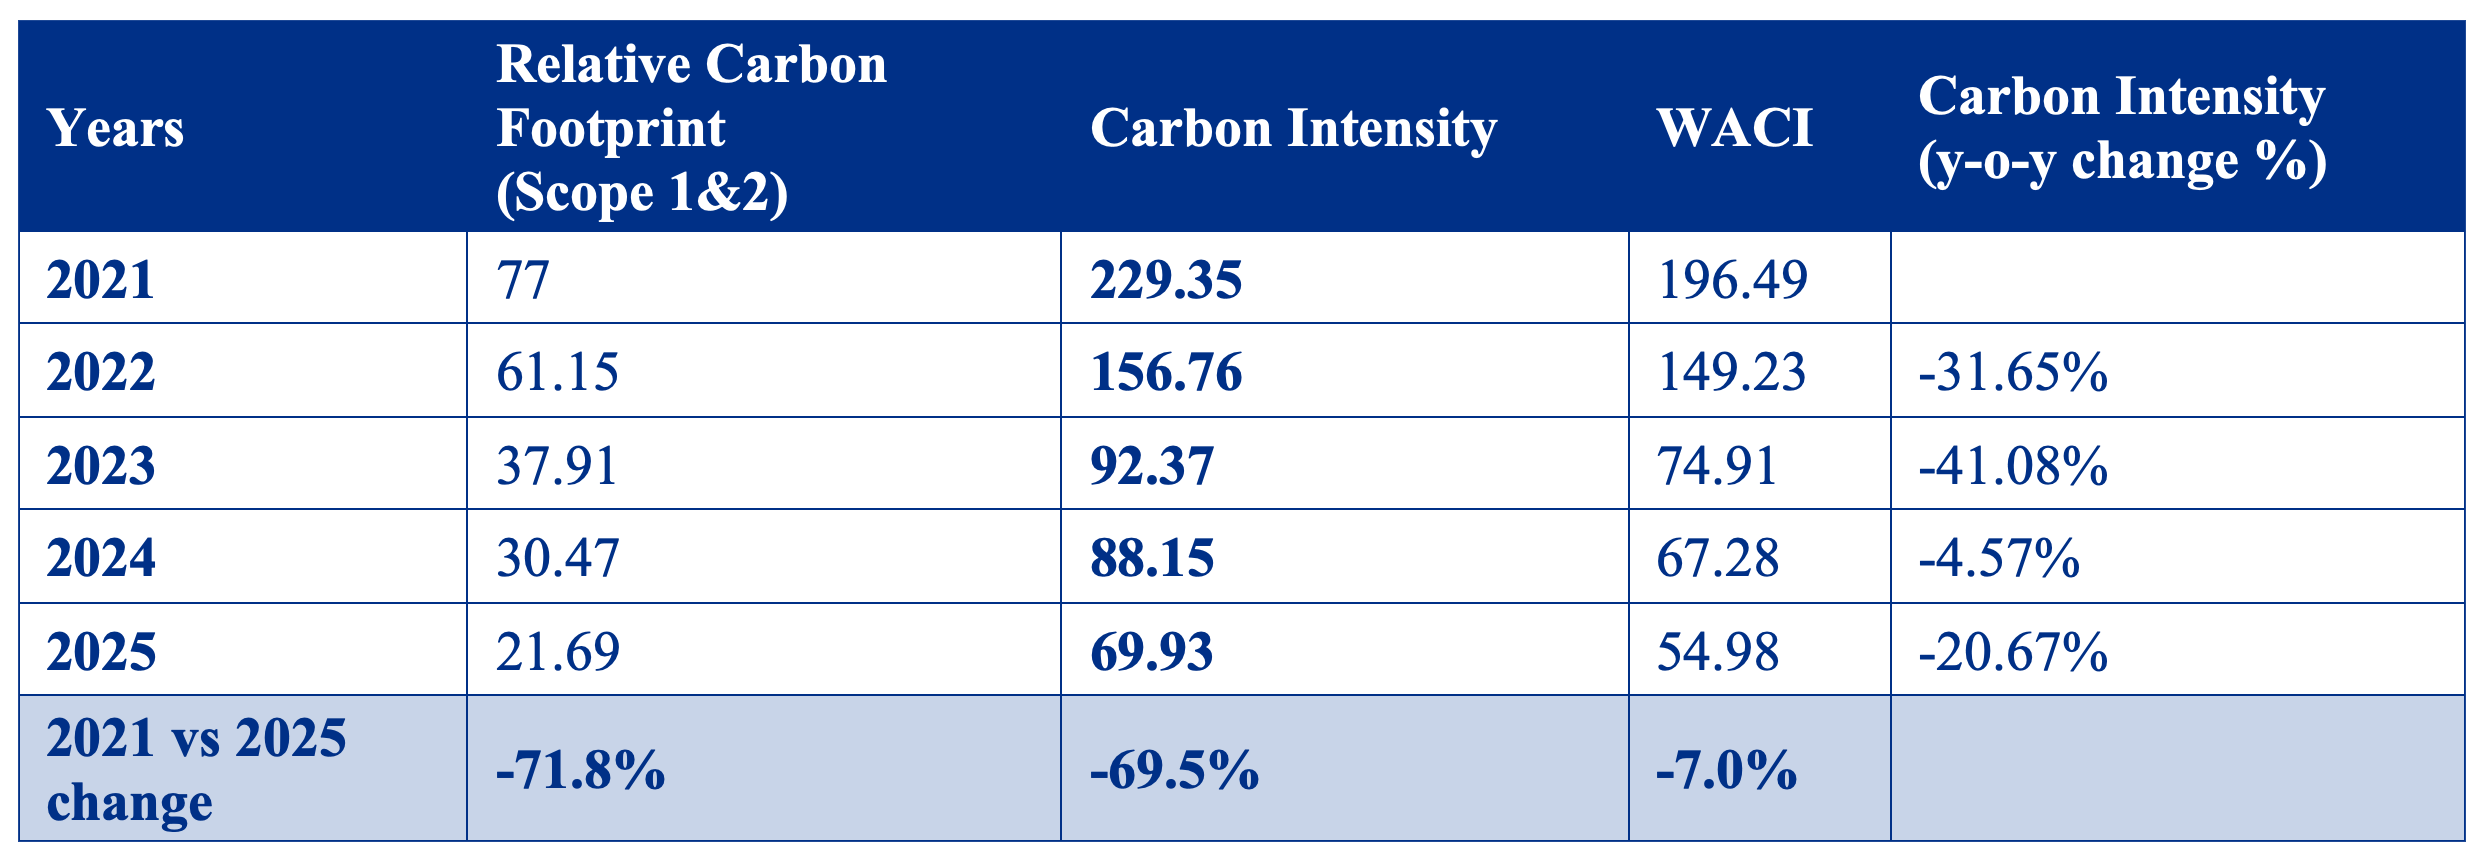
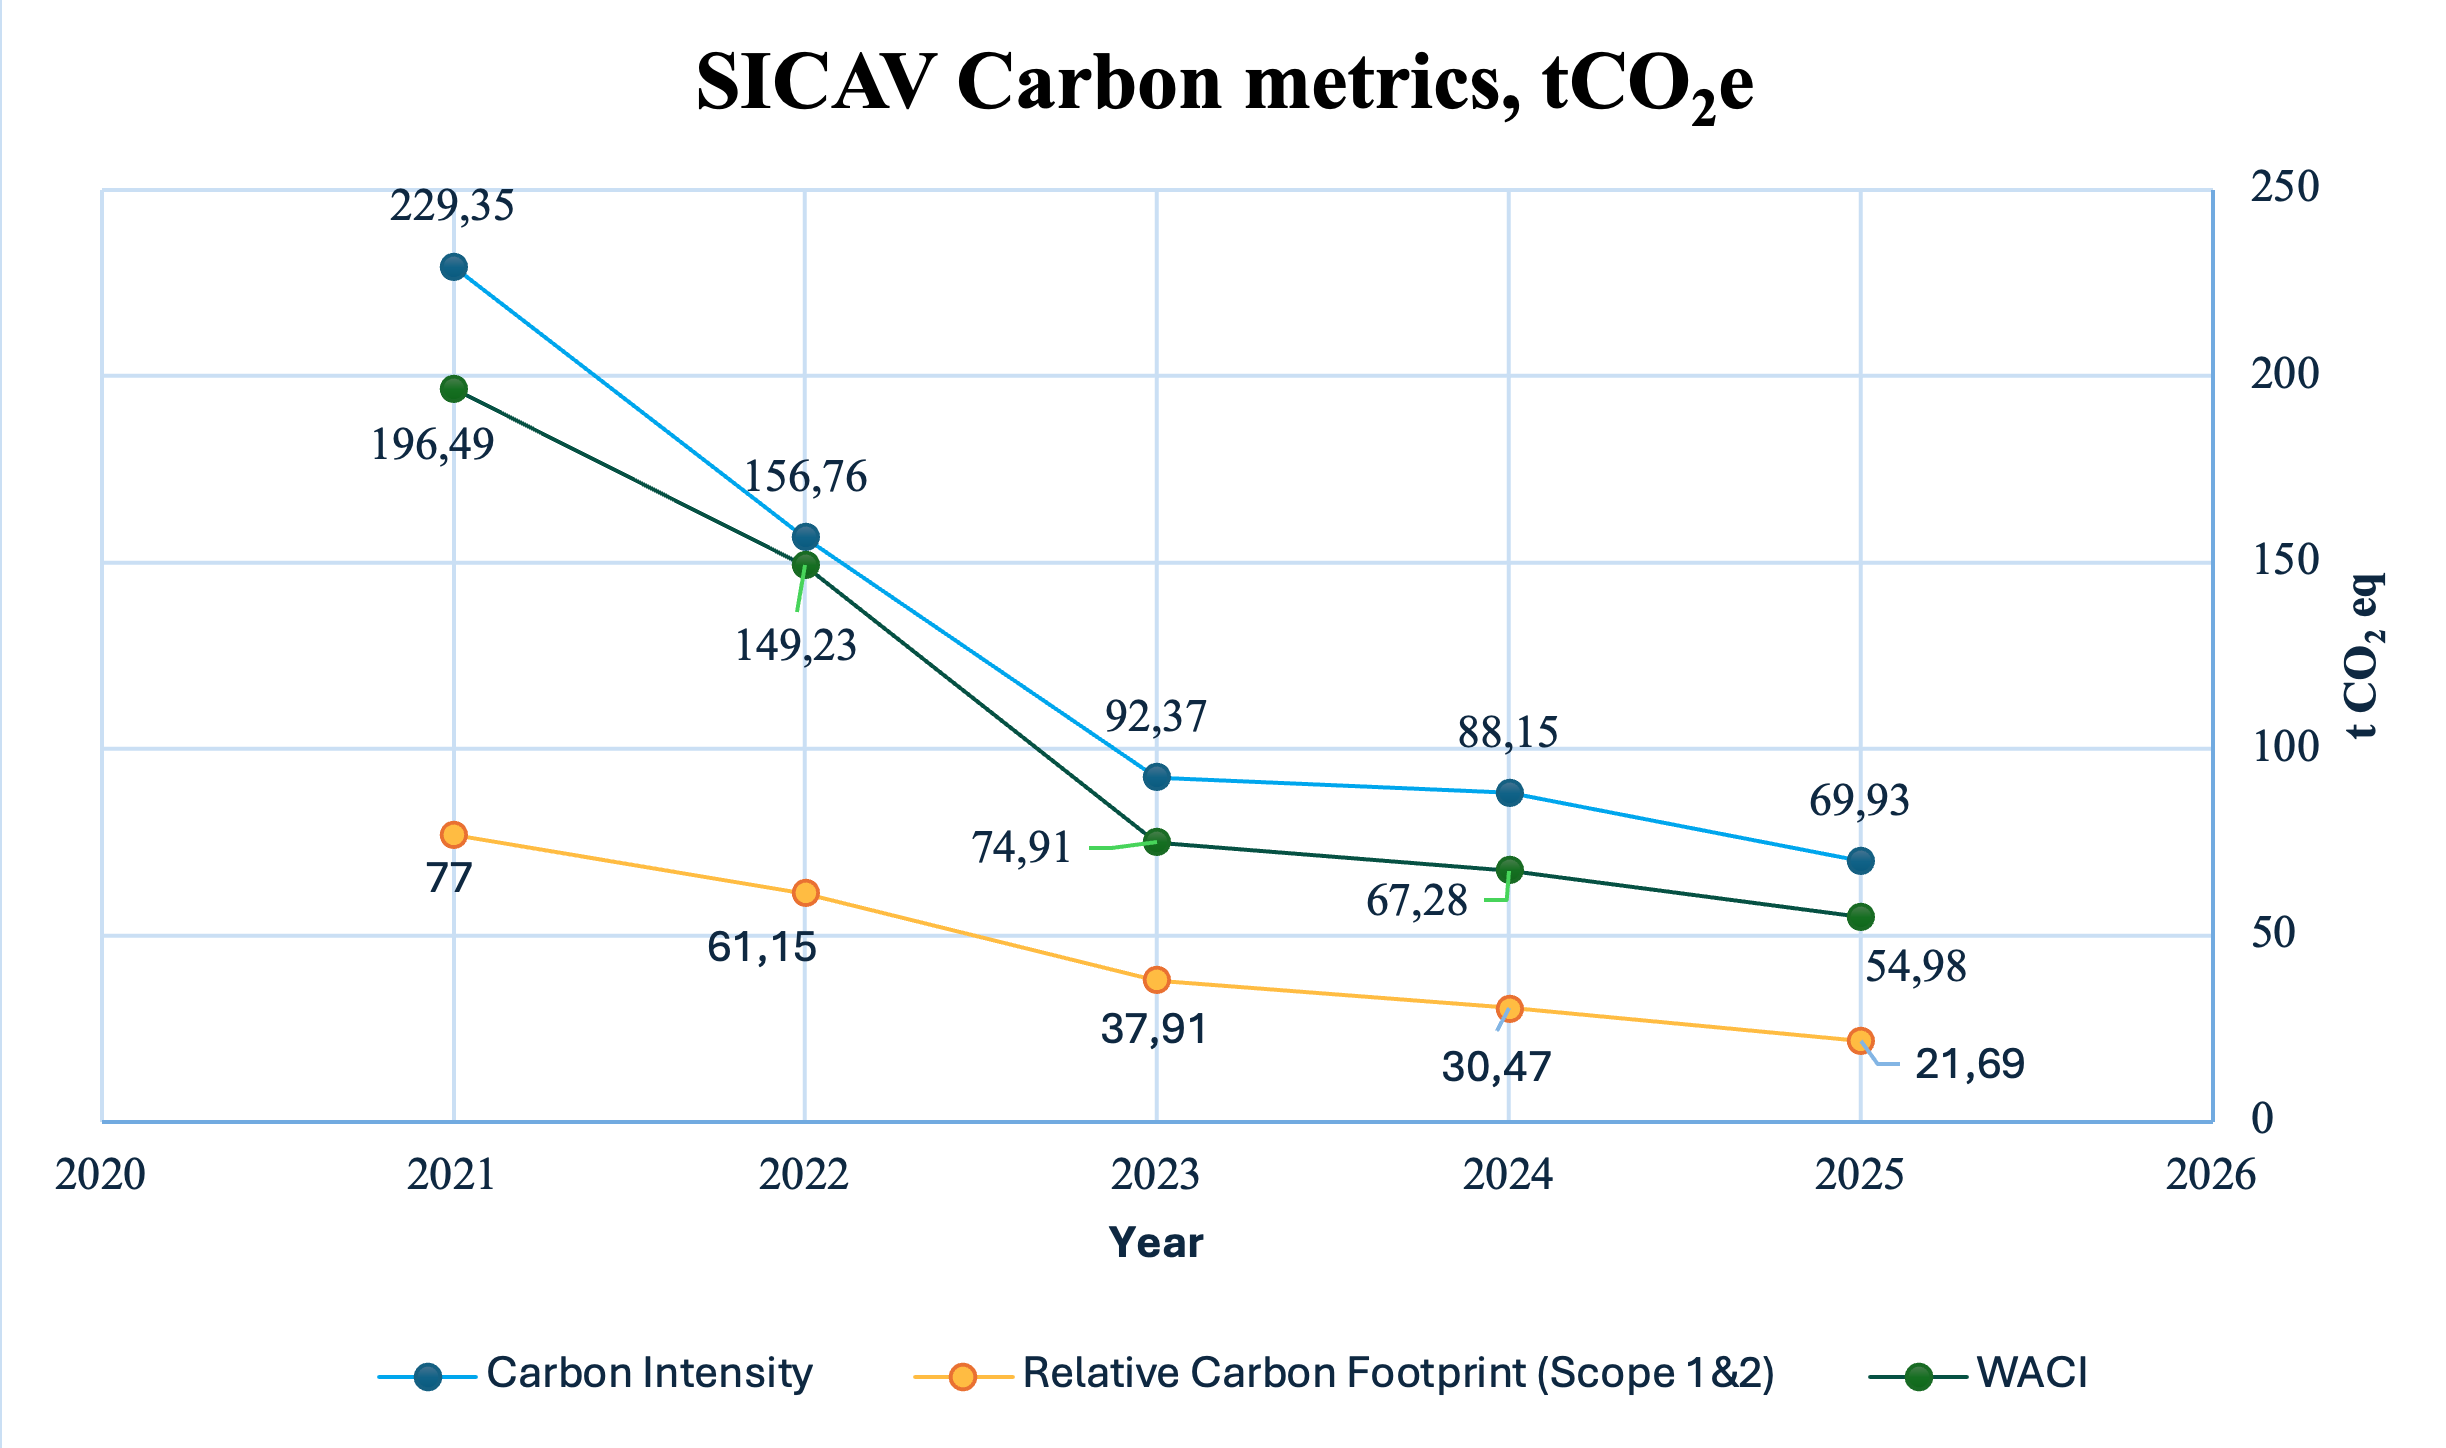
Overall, all indicators have shown a substantial decline from the first year of analysis in 2021 through 2025, with carbon intensity decreasing by nearly 72% over this period.
Finally, excluding green bonds from the calculation of financed emissions does not significantly alter the metrics: their weight in the portfolio is limited (~3% of AUM), so the results remain broadly in line – and slightly better – when green bonds are excluded, as might be expected.
Scenario analysis
The scenario‑alignment analysis provides a forward‑looking perspective on the portfolio’s compatibility with different climate futures, comparing the Scope 1, 2 and 3 emissions of the portfolio companies with carbon budgets derived from international climate scenarios. The methodology draws on sectoral and regional emissions pathways developed by models such as those of the IEA, NGFS and OECM. In continuity with previous years, Etica reports the results based on the IEA models (WEO22). The scenarios cover a wide range of potential global‑warming trajectories, from 1.5°C to above 3°C.
The chart illustrates three emissions trajectories: the Historical Projection, which extrapolates past reported emissions into the future; the Policies Projection, which reflects the expected evolution of sectors under currently implemented climate policies; and the Target Projection, which incorporates the emissions‑reduction targets publicly committed to by the companies in the portfolio. These trajectories are then compared with the carbon budgets associated with different climate scenarios.
The alignment of the portfolio and benchmark with Net Zero scenarios is assessed using two metrics: the Implied Temperature Rise (ITR), which indicates the temperature outcome associated with the portfolio’s use of its carbon budget, and the Crosspoint Year, i.e., the year in which cumulative emissions would exceed the allocated carbon budget. Both metrics rely on comparing projected cumulative emissions with the total carbon budget consistent with a decarbonisation pathway to 2050.
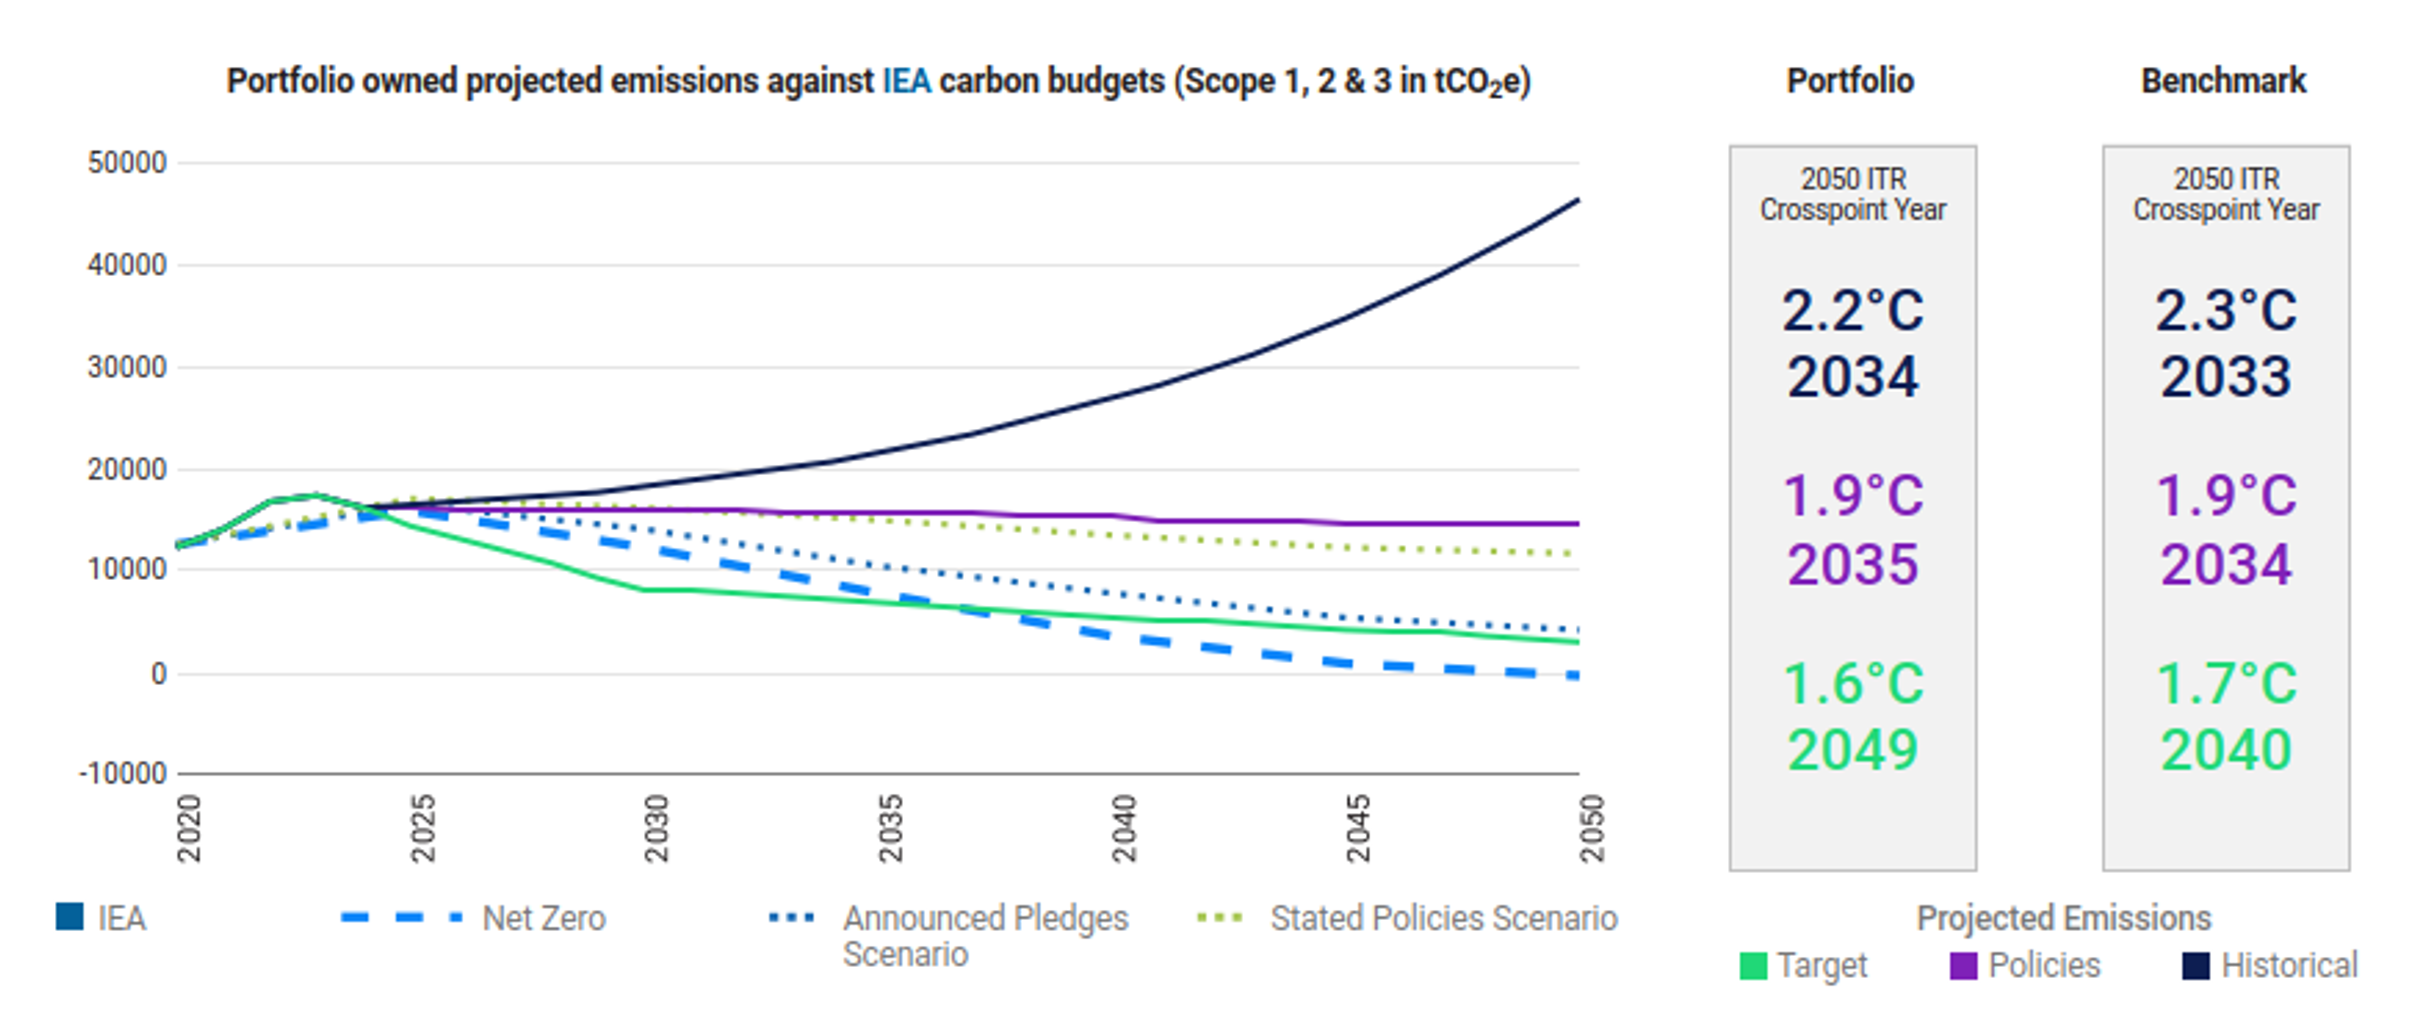
Overall, the results are positive. The portfolio outperforms the benchmark under both the target‑based trajectory and the historical trajectory, indicating greater climate resilience.
The Target Projection shows that, if all companies in the portfolio were to fully achieve their stated emissions‑reduction commitments, the overall emissions pathway would be consistent with approximately 1.6°C, and therefore almost aligned with a Net Zero 2050 trajectory.
The Historical Projection, by contrast, indicates that the actual pace of emissions reduction achieved so far is insufficient: if historical trends continued, the portfolio would follow a trajectory of around 2°C, highlighting the need for an acceleration in decarbonisation actions.
The Policies Projection provides an intermediate outcome (around 1.9°C). By reflecting the evolution of sectors under currently implemented climate policies, it shows that structural and regulatory drivers are already contributing to an improvement relative to the historical trajectory, suggesting that achieving corporate targets is ambitious but feasible.
In addition, relative to the benchmark, the portfolio continues to invest in a larger share of companies with climate targets.
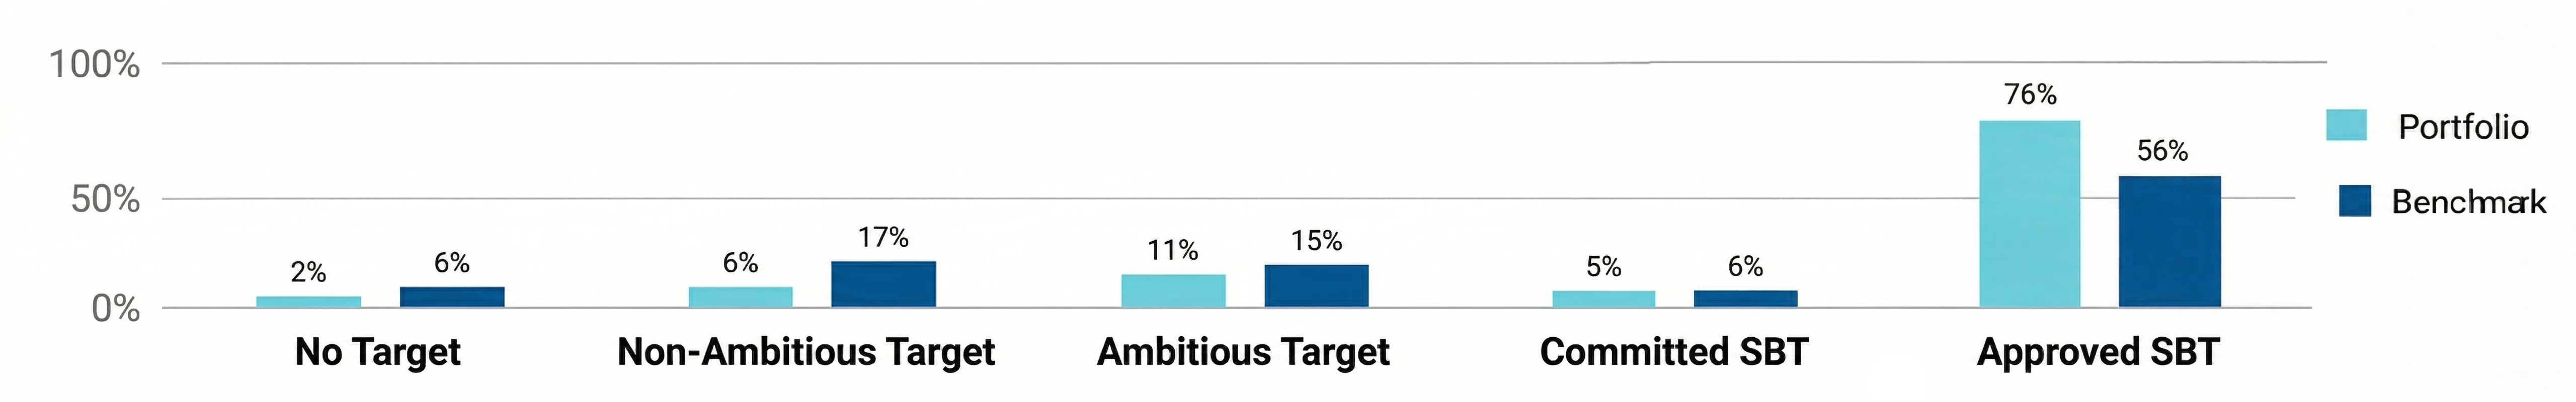
As of 31 December 2025, according to ISS, 92% of the portfolio’s value is either committed to or has already set a climate target, compared with 77% for the benchmark. Specifically, 76% of the portfolio’s value (70% in the 2025 TCFD report) has set a greenhouse‑gas reduction target approved by the Science‑Based Targets initiative (SBTi), compared with 56% of the benchmark. Only 8% of the portfolio’s holdings have no target or have set a target considered unambitious with respect to greenhouse‑gas emissions.
Physical risk analysis
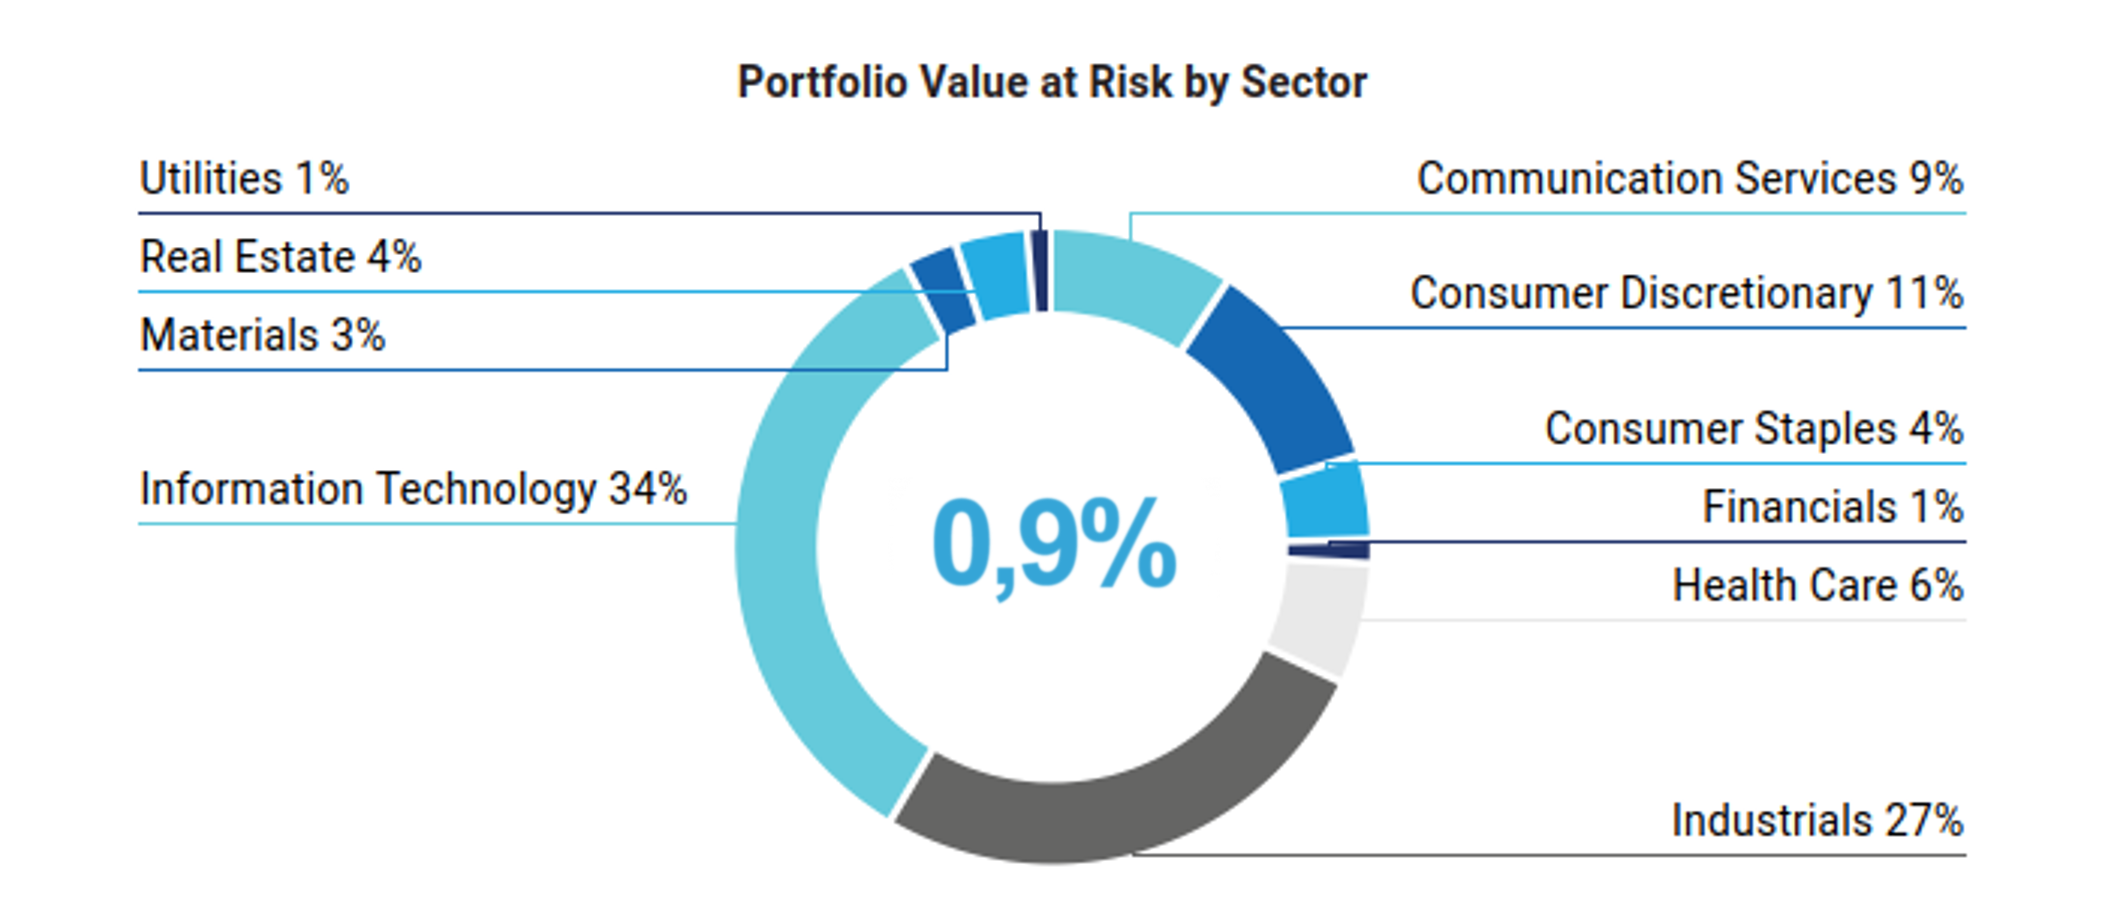
ISS uses a proprietary model to estimate the potential value losses for issuers arising from physical climate risks, calculating the Value at Risk (VaR) expected by 2050. The model assesses the financial impact of the main channels through which physical risks may affect equity valuations: changes in the value of fixed assets (PP&E), repair costs following extreme weather events requiring additional CAPEX, increases in operating costs linked to changes in SG&A or COGS, and revenue impacts due to production interruptions or reductions.
The analysis is based on the climate scenarios used in the IPCC Fifth Assessment Report (AR5) [4]. The primary reference scenario is RCP 4.5, which corresponds to an expected temperature increase between 1.7°C and 3.2°C by 2100.
Under this scenario, the portfolio’s VaR to 2050 is estimated at approximately €257,000, with the Industrials and Information Technology sectors being the most exposed. The overall impact remains below 1% of the total portfolio value, consistent with the results of the 2025 analysis.
Under a more severe scenario – corresponding to warming above 3.2°C – the VaR increases to approximately €397,000. This confirms that worsening climate conditions lead to proportionally higher potential losses, while still remaining within a manageable magnitude (below 1% of AUM) relative to the overall portfolio value.
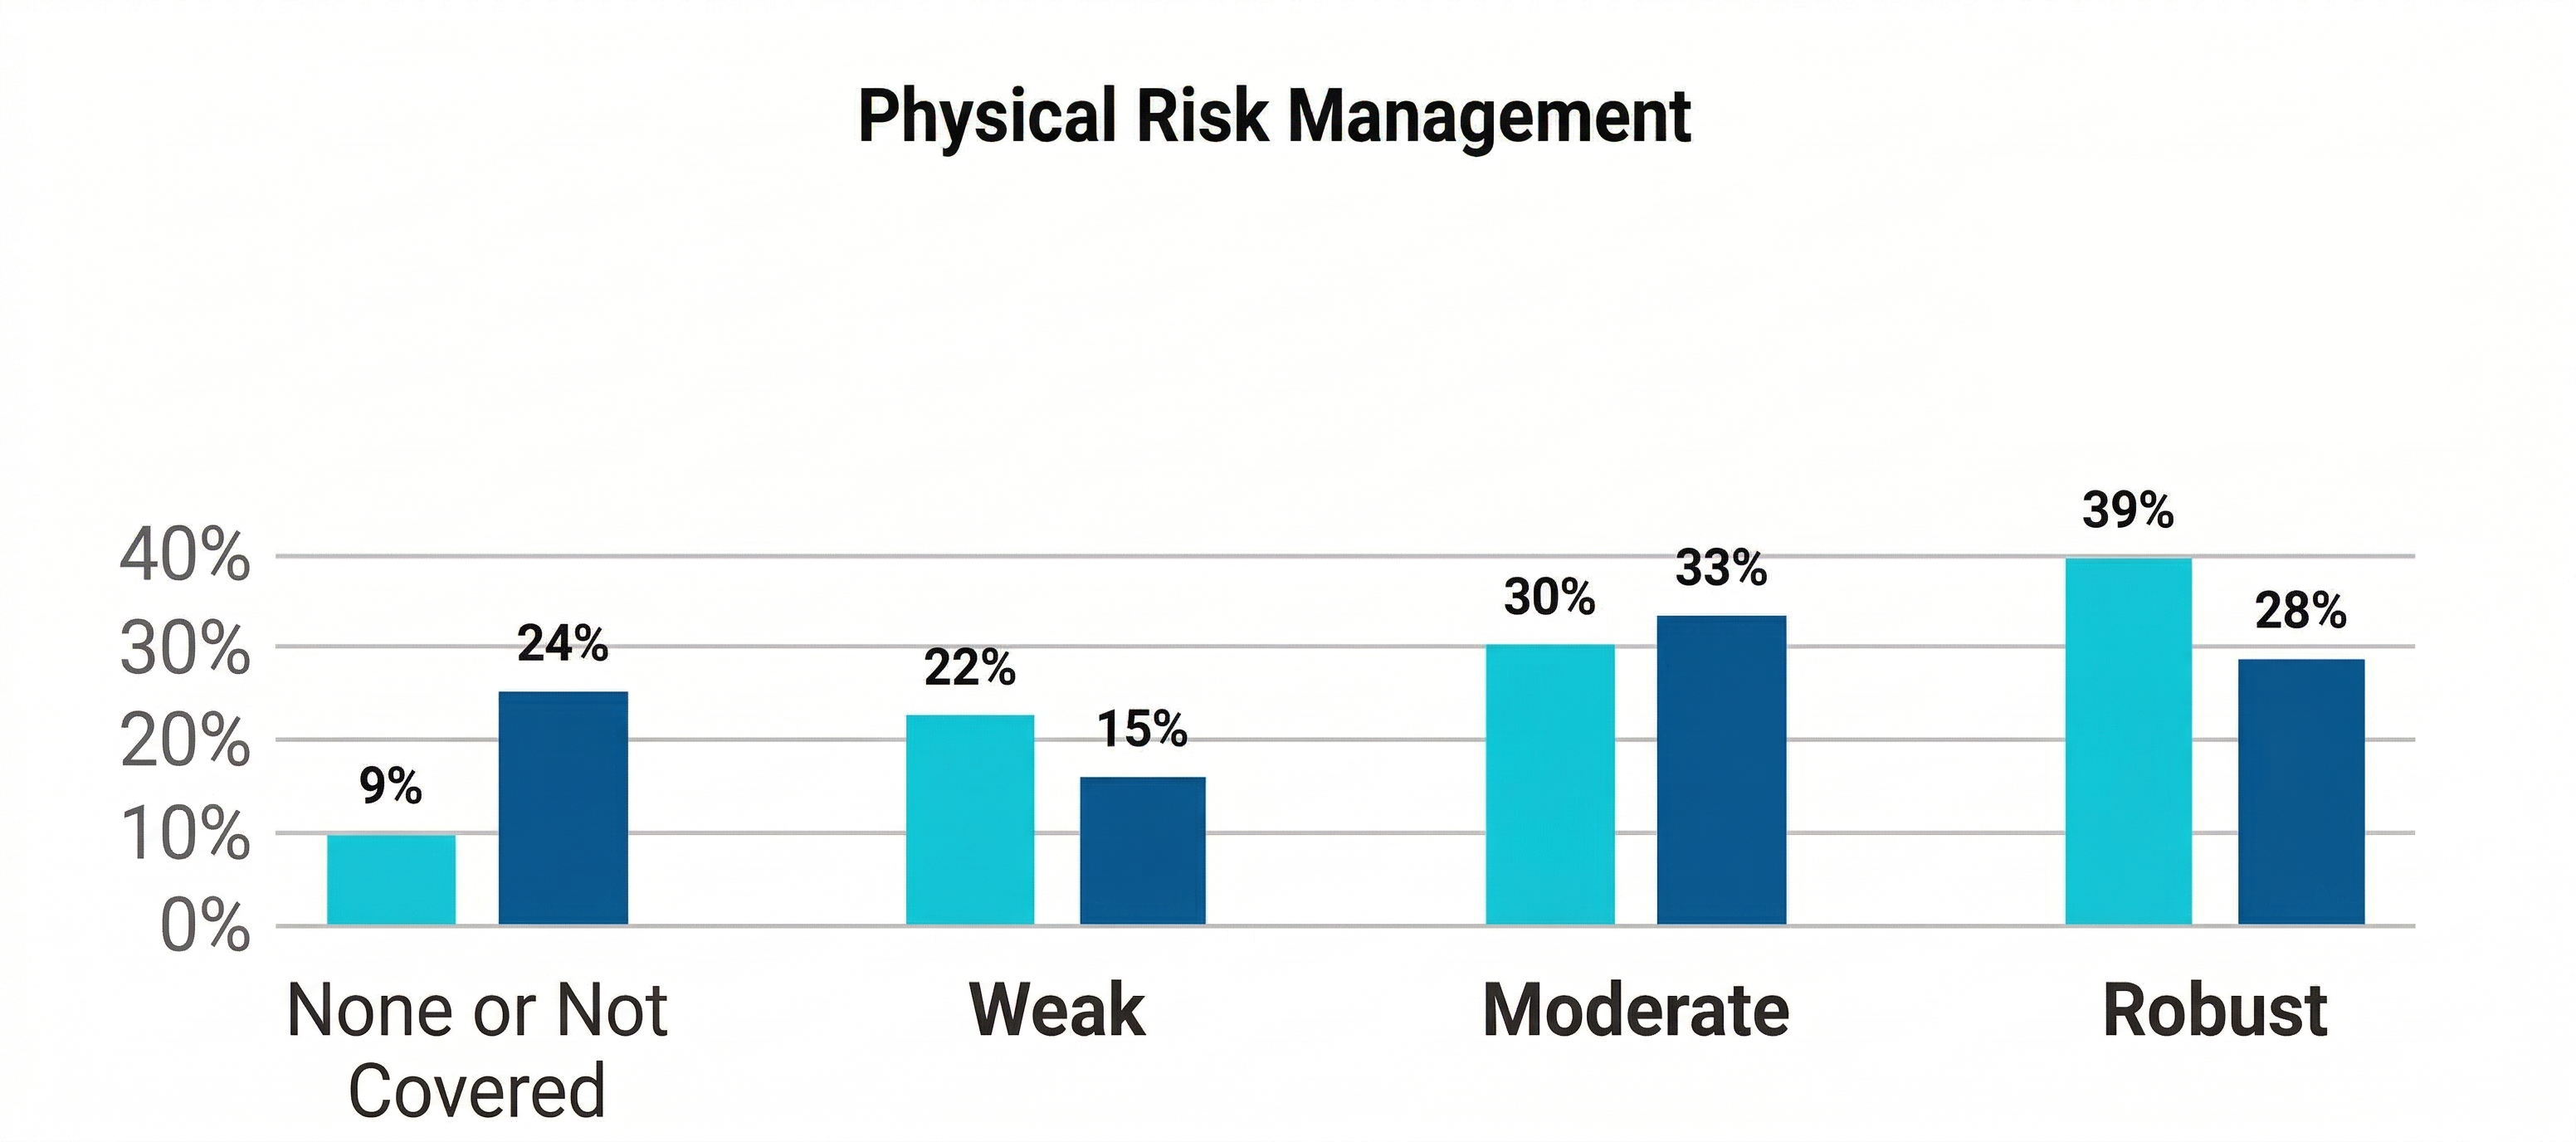
Furthermore, according to ISS’s assessment, only 22% of the issuers in the portfolio – calculated in terms of weight on total AUM – have a weak physical‑risk management strategy, while the vast majority, around 69%, have a moderate or robust approach to managing physical climate risks.
The analysis also highlights better data coverage for the portfolio compared with the benchmark: only 9% of Etica’s holdings lack sufficient disclosure for a physical‑risk evaluation, versus 24% for the benchmark. This indicates a higher quality and completeness of information across the portfolio’s issuers – an essential factor for reliably assessing resilience to physical risks over the long term.
Transition Risk Analysis
ISS has developed a model that estimates the Transition Value at Risk (TVaR) of portfolios based on the International Energy Agency’s (IEA) Net Zero by 2050 scenario.
For the SICAV, the portfolio’s potential exposure is very limited: the estimated TVaR is approximately €227,000, corresponding to less than 1% of the total analysed value. This confirms the portfolio’s structurally low exposure to transition risks and represents an improvement compared to the 4% reported in the previous analysis.
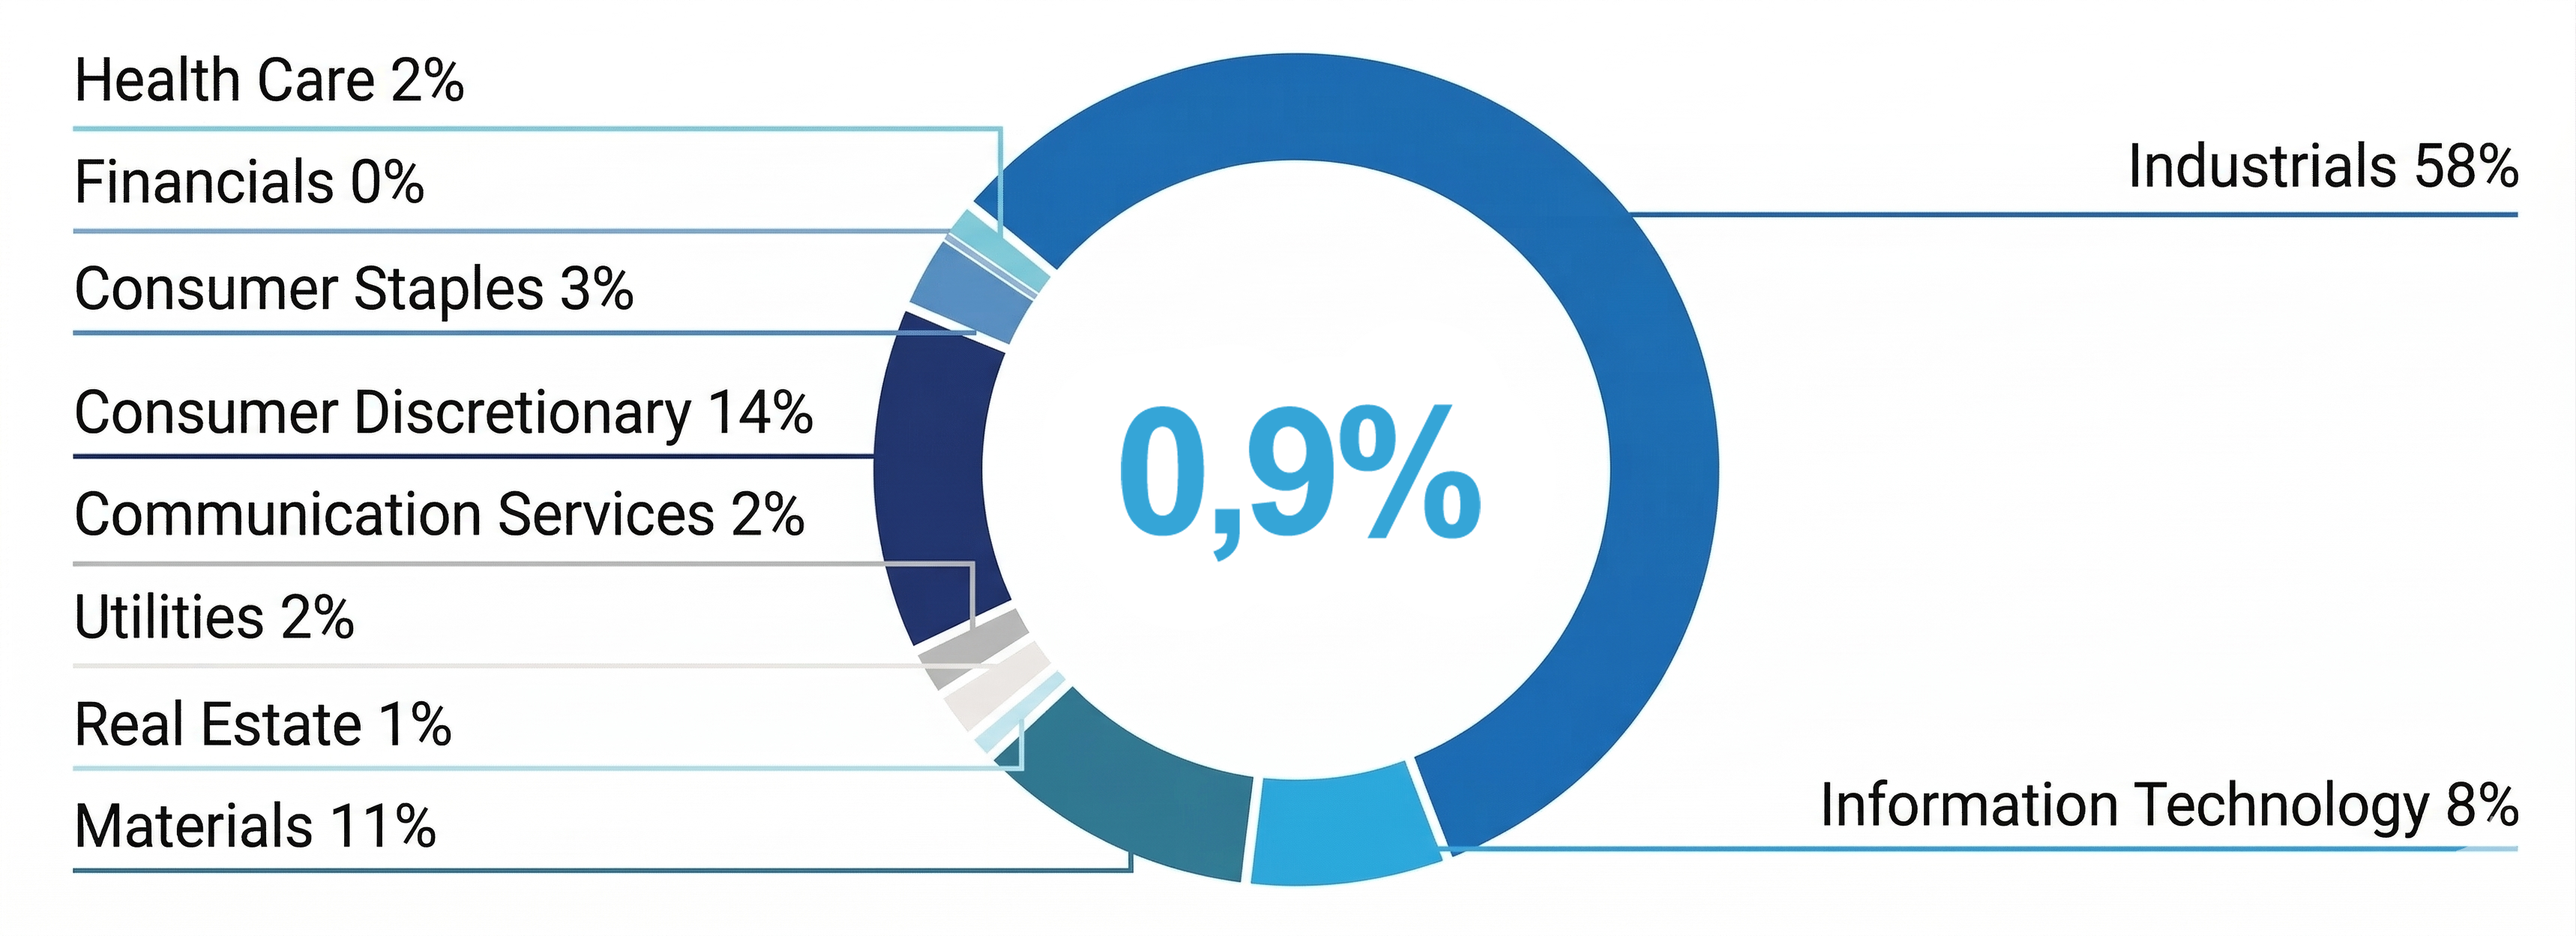
This year’s assessment also incorporates Scope 3 emissions, which is reflected in the sector‑level results. The highest exposure to Scope 3 occurs in the Industrials sector, which is also the most exposed to transition risks according to ISS’s methodology. The Materials sector follows, as expected, given that it is also where the portfolio shows the highest exposure to Scope 1 and 2 emissions.
Despite this, the share of AUM potentially exposed to transition risk remains very limited.
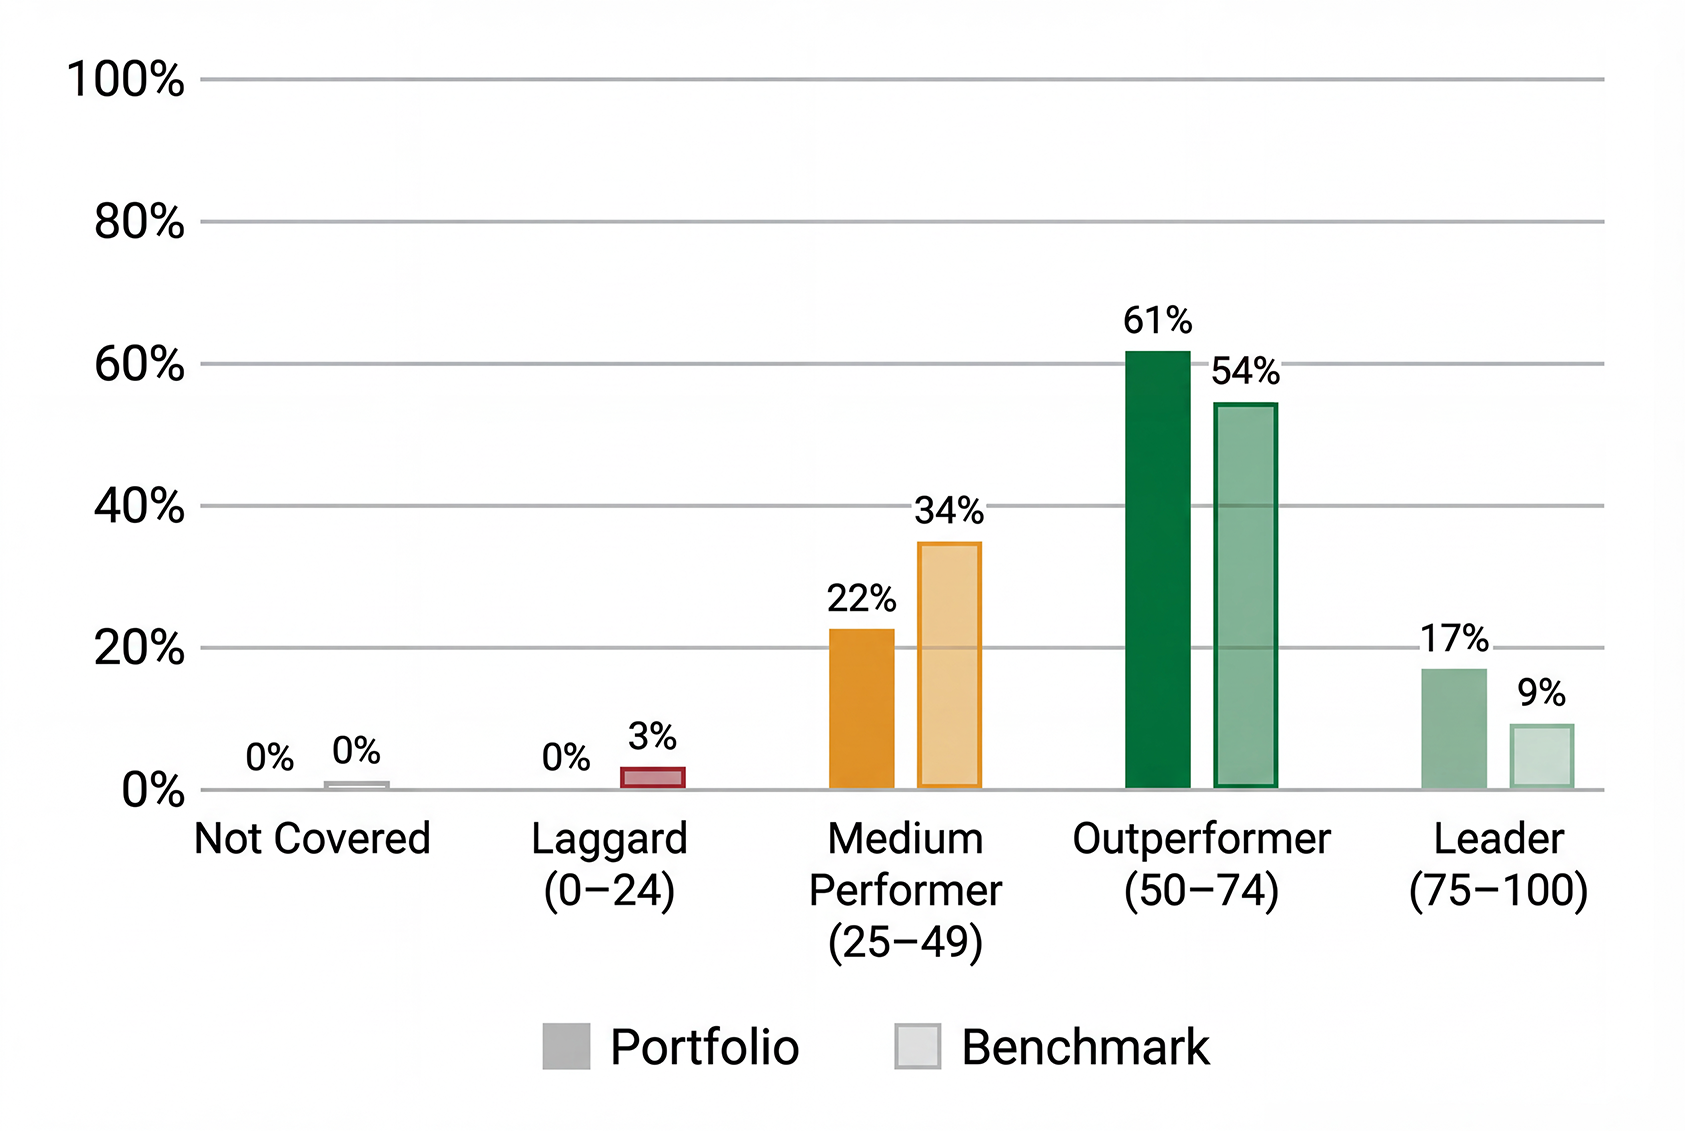
From a Carbon Risk Rating perspective – an ISS measure that summarises issuers’ ability to manage climate risks and capture opportunities – both the Industrials and Materials sectors display overall solid performance: no issuers are classified as Laggards.
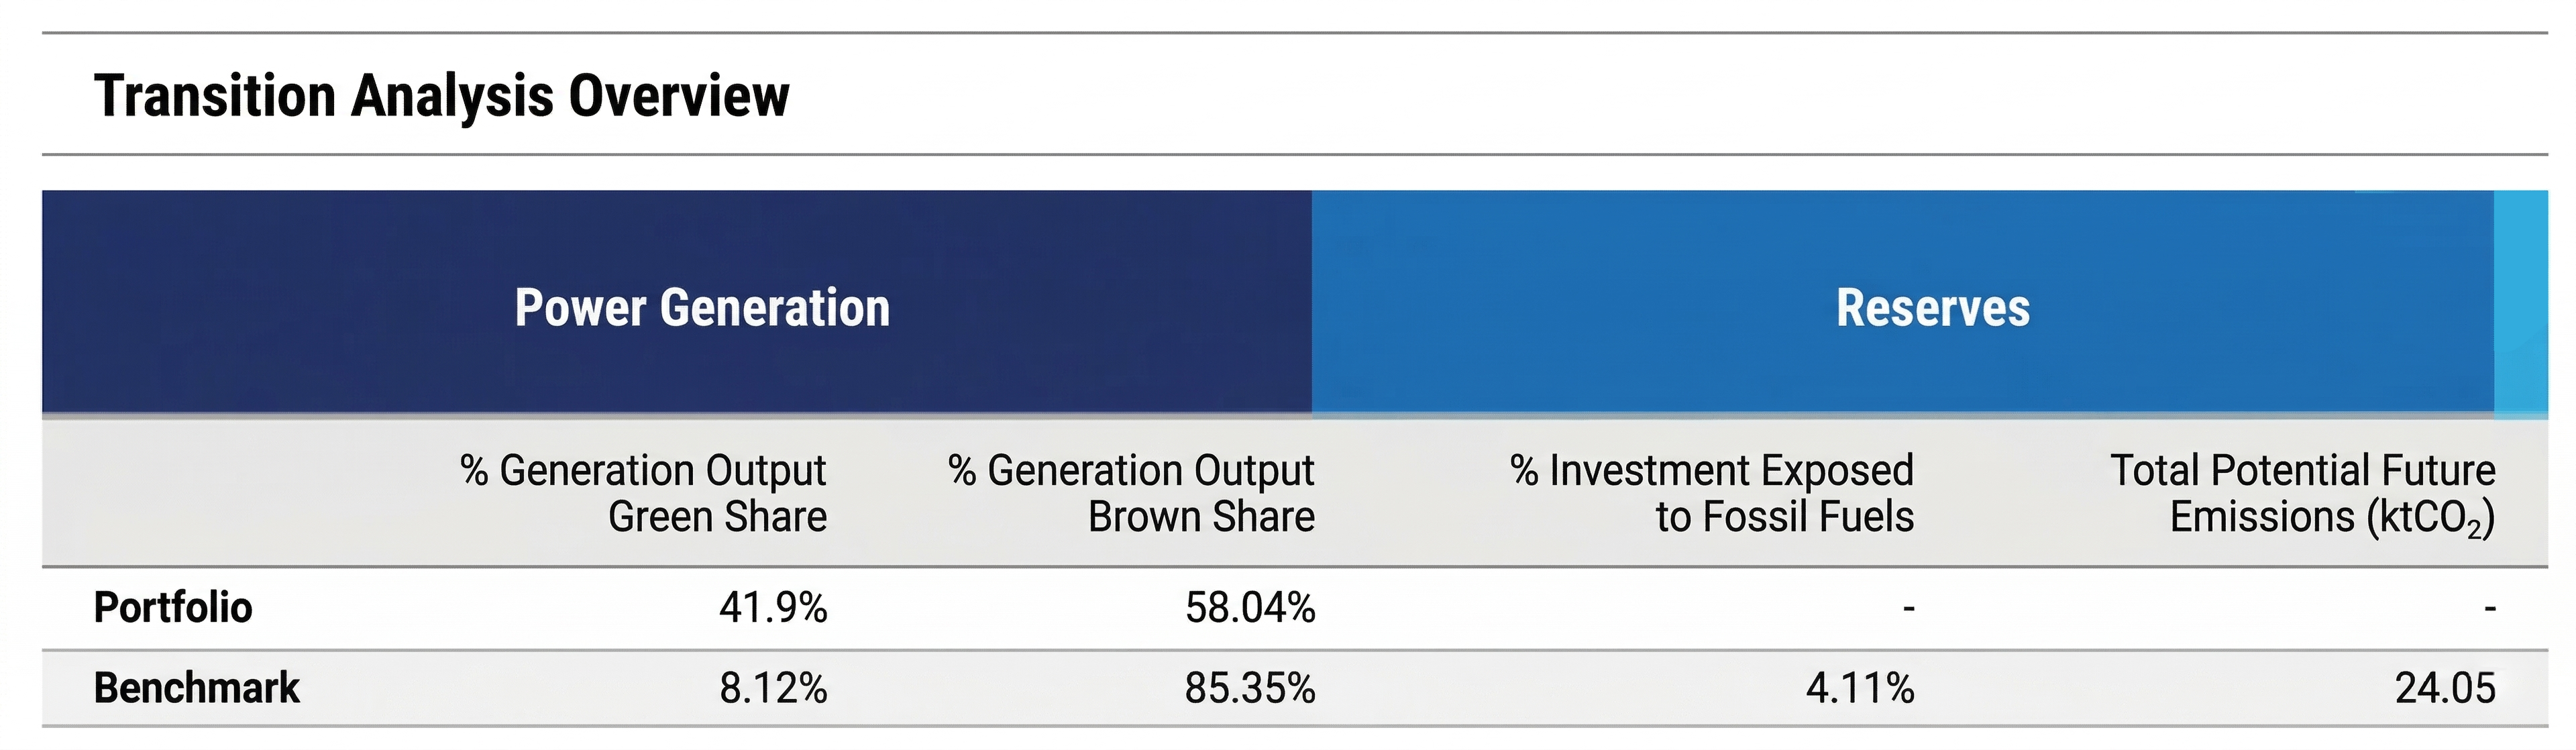
ISS’s transition‑risk analysis also examines the power‑generation mix of the companies held in the portfolio. For the SICAV, approximately 42% of the installed power‑generation capacity attributable to the portfolio comes from renewable sources.
The decrease compared to 2024 is primarily due to the exclusion of green bonds from this specific analysis. Green bonds do not transfer ownership of issuers’ emissions or energy outputs (e.g., renewable or thermal shares), so excluding them reduces the weight of certain holdings and consequently the share of owned renewable‑generation capacity. In practice, removing green bonds reduces the attributed share of renewable energy produced by the “greenest” issuers.
This is evident for companies such as ERG and EDP, where the portfolio is composed almost entirely of green bonds and only minimally of equity positions.
As expected, when the analysis is performed including green bonds, the share of renewable energy rises to 64%, in line with the 2025 results. Methodologically, however, it is more accurate to exclude green bonds from the power‑mix analysis – because they do not convey ownership of emissions – and to complement the assessment with a separate use‑of‑proceeds analysis, which evaluates the actual contribution of those instruments to the energy transition.
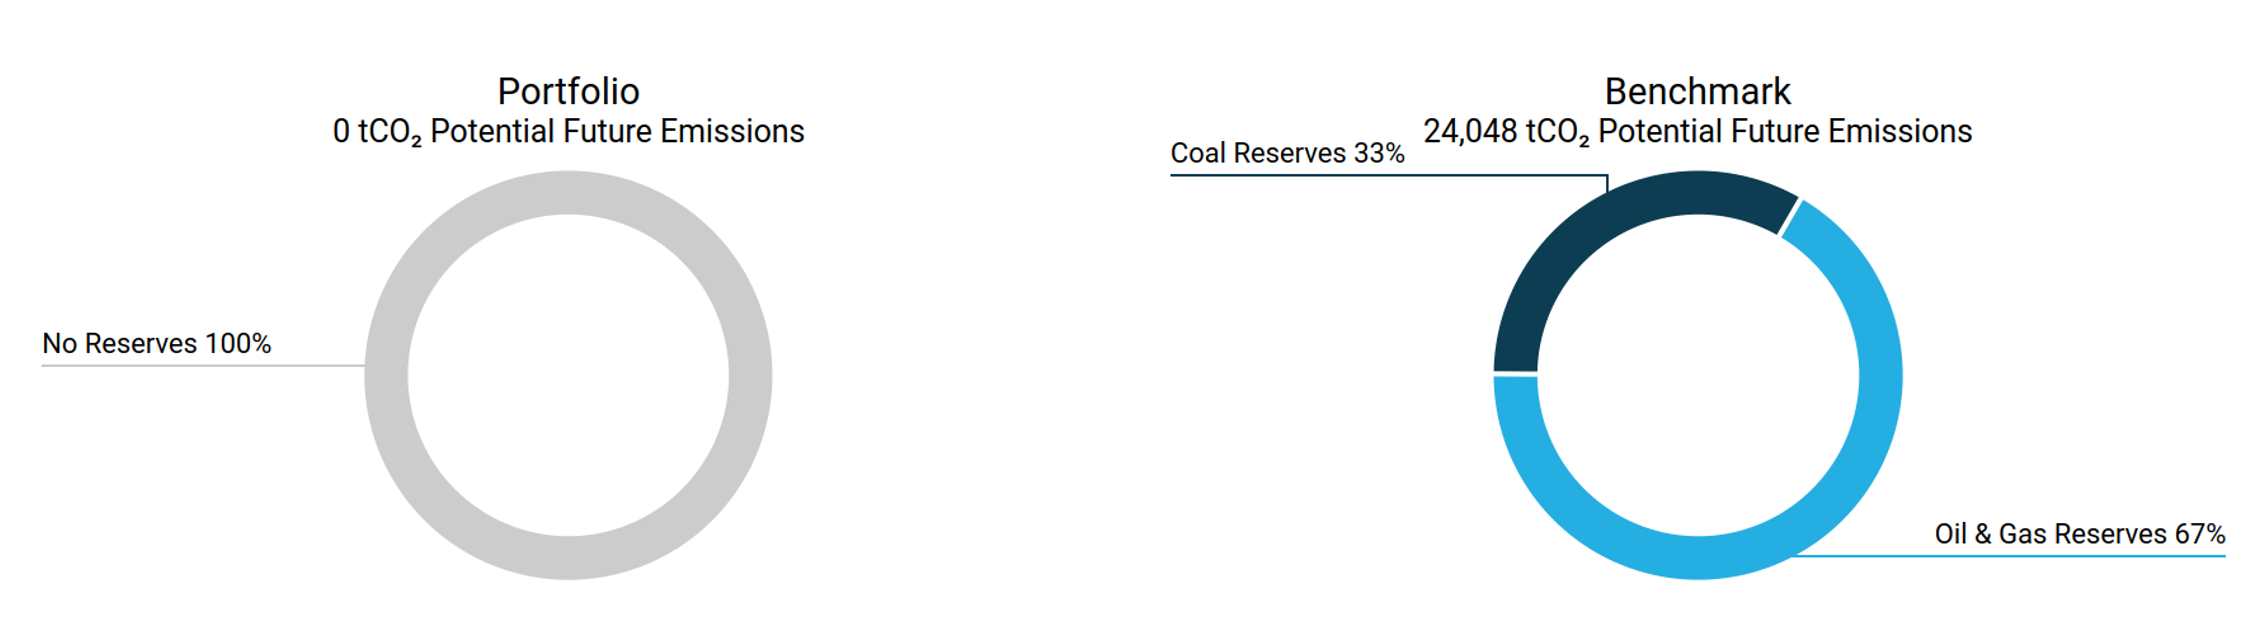
Finally, unlike the benchmark, the SICAV has no exposure to fossil‑fuel activities, and none of the issuers in the portfolio hold fossil‑fuel reserves. This implies zero potential future emissions, whereas the benchmark shows exposure to 24,048 tCO₂ associated with fossil‑fuel reserves.
The portfolio also has no direct exposure to controversial or unconventional extraction activities, such as fracking or Arctic drilling.
Corporate Green Bonds: analisi dell’uso dei proventi
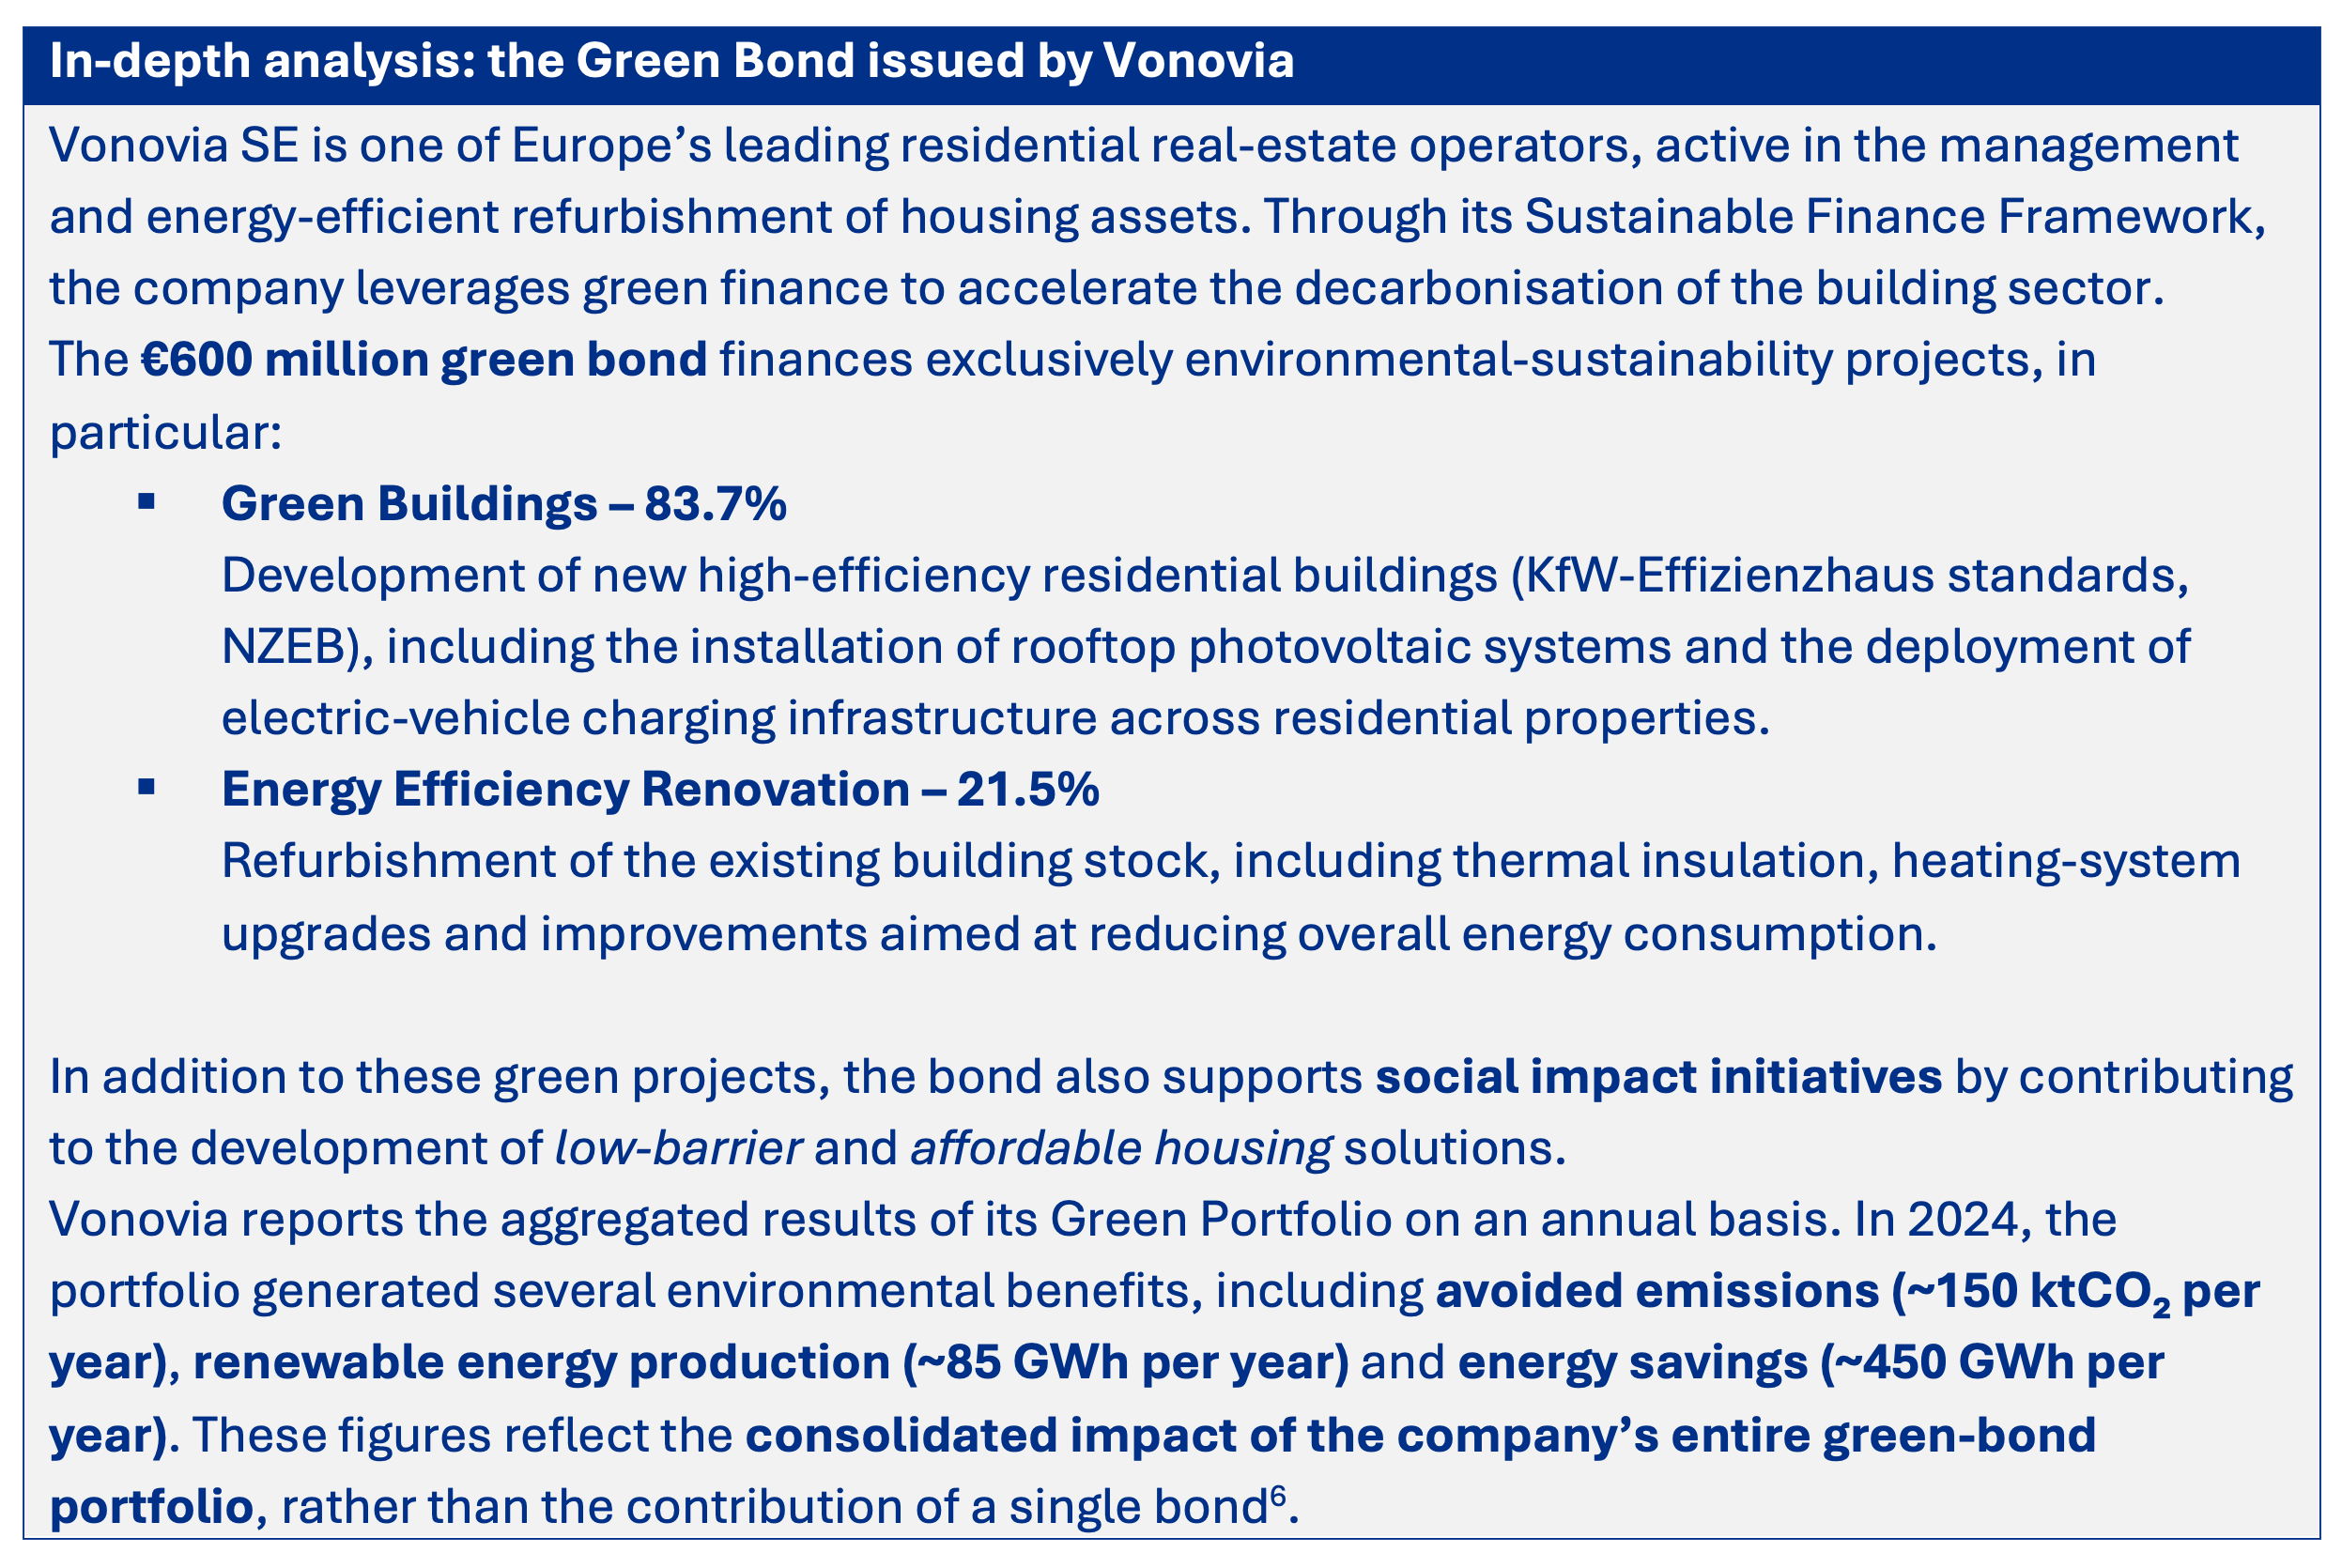
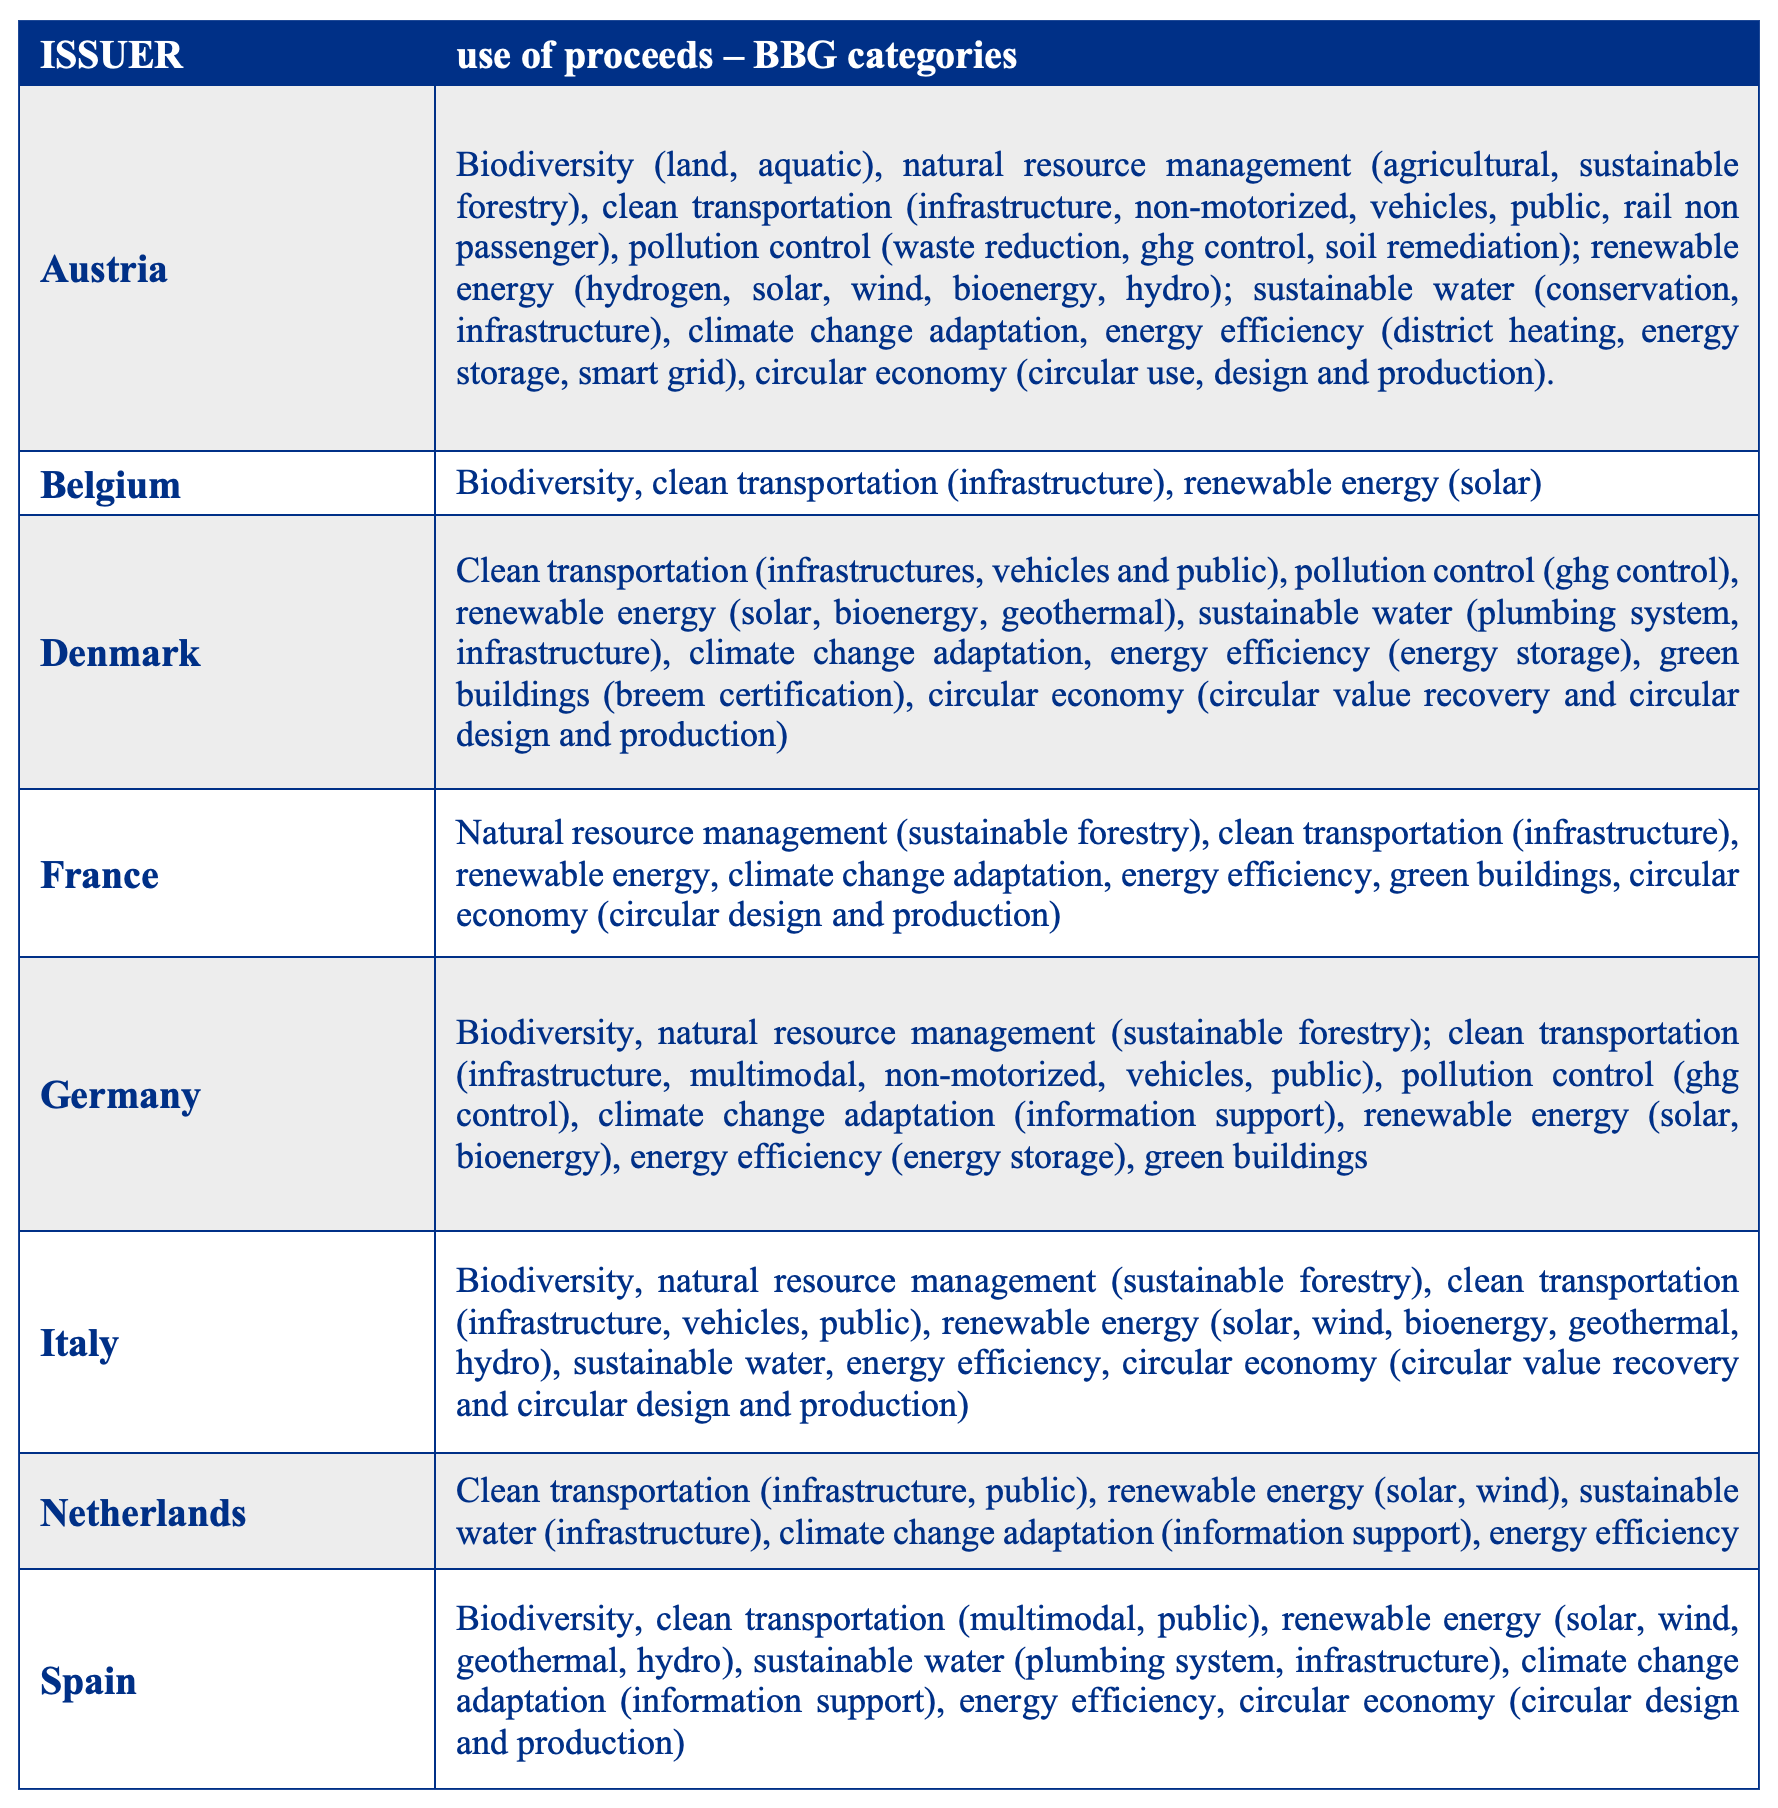
As of 31 December 2025, the SICAV portfolio included eight corporate bonds, of which green bonds accounted for 75% of the total and approximately 72% of the corporate AUM. The majority of the corporate fixed‑income exposure therefore directly contributes to financing issuers’ green‑transition projects.
The projects financed by these bonds fall into the following use‑of‑proceeds categories [5]:
Where available, data reported in the issuers’ Green Bond Allocation Reports, collected through Bloomberg, also made it possible to estimate the main environmental impacts generated by the financed projects. The aggregated results are:
- Avoided emissions: 9,429.24 kt of CO₂;
- Renewable capacity constructed or rehabilitated: 8,023 MW;
- Renewable energy generated: 250,191.84 GWh.
These metrics are sourced from issuers’ official allocation reports and consolidated by Bloomberg. Two types of conversions were required to calculate total values:
- Conversion of units of measurement
In some cases, energy was reported in different units (e.g., MWh instead of GWh).
This conversion is straightforward, involving only a mathematical factor (1 GWh = 1,000 MWh). - Conversion of annual data into lifetime values
When issuers reported only annual environmental benefits (such as annual renewable‑energy production), total benefits were estimated by multiplying the annual figure by the duration of the bond, calculated from issuance to maturity.
It is important to note that these metrics represent absolute values for the projects financed by the green bonds and are not adjusted according to the portfolio’s ownership share or the financed‑emissions methodology. They should therefore be interpreted as the overall contribution of the issuers’ projects.
On an absolute basis, incorporating data from the green bonds, the companies in the portfolio generated 103,503.78 GWh of renewable energy in 2025, compared with 25,308.3 GWh from fossil sources.
Analysis of sovereign emissions
Carbon footprinting is increasingly used to assess climate‑transition risks, but it is important to note that, for sovereign issuers, emissions accounting follows different criteria than those applied to corporates. The sovereign emissions analysis is based on ISS’s dedicated sovereign methodology, which is fully consistent with major international reporting standards – most notably the PCAF Sovereign Accounting Guidelines – and compares the greenhouse‑gas emissions and climate‑related indicators of the countries in the Etica Transizione Climatica portfolio with those in the benchmark.
The tables report both absolute and relative emissions associated with the countries held in the portfolio, together with emissions‑intensity metrics. Production emissions (Scope 1) rely on the most recent available data: 2022 for Annex I countries (UNFCCC) and 2021 for non‑Annex I countries (CAIT). Scope 2 and 3 emissions are based on 2018 OECD data, which remains the last globally harmonised dataset.
To support the interpretation of results, a few essential definitions are provided:
- Production emissions (Scope 1): all territorial emissions generated by the production of goods and services within a country;
- LULUCF emissions: emissions or removals associated with land use, land‑use change and forestry. These are presented separately to provide a more comprehensive picture of each country’s emissions profile;
- Emission Exposure (absolute): the portfolio’s total sovereign emissions exposure, obtained by weighing each country’s emissions by its proportional exposure in the portfolio;
- Relative Emission Exposure: emissions attributed per million euros invested, expressed as Relative Carbon Footprint (RCF) and Weighted Average Carbon Intensity (WACI).
As highlighted last year, and in line with the methodological updates introduced in the PCAF Sovereign Standard (2nd edition, December 2022), ISS no longer reports government emissions (i.e., emissions directly generated by the state combined with those financed through public expenditure), as they are no longer considered methodologically robust or relevant.
Consistent with the approach applied in the corporate section, sovereign green bonds were excluded from the calculation of financed emissions; the related use‑of‑proceeds analysis is presented separately in the following pages.
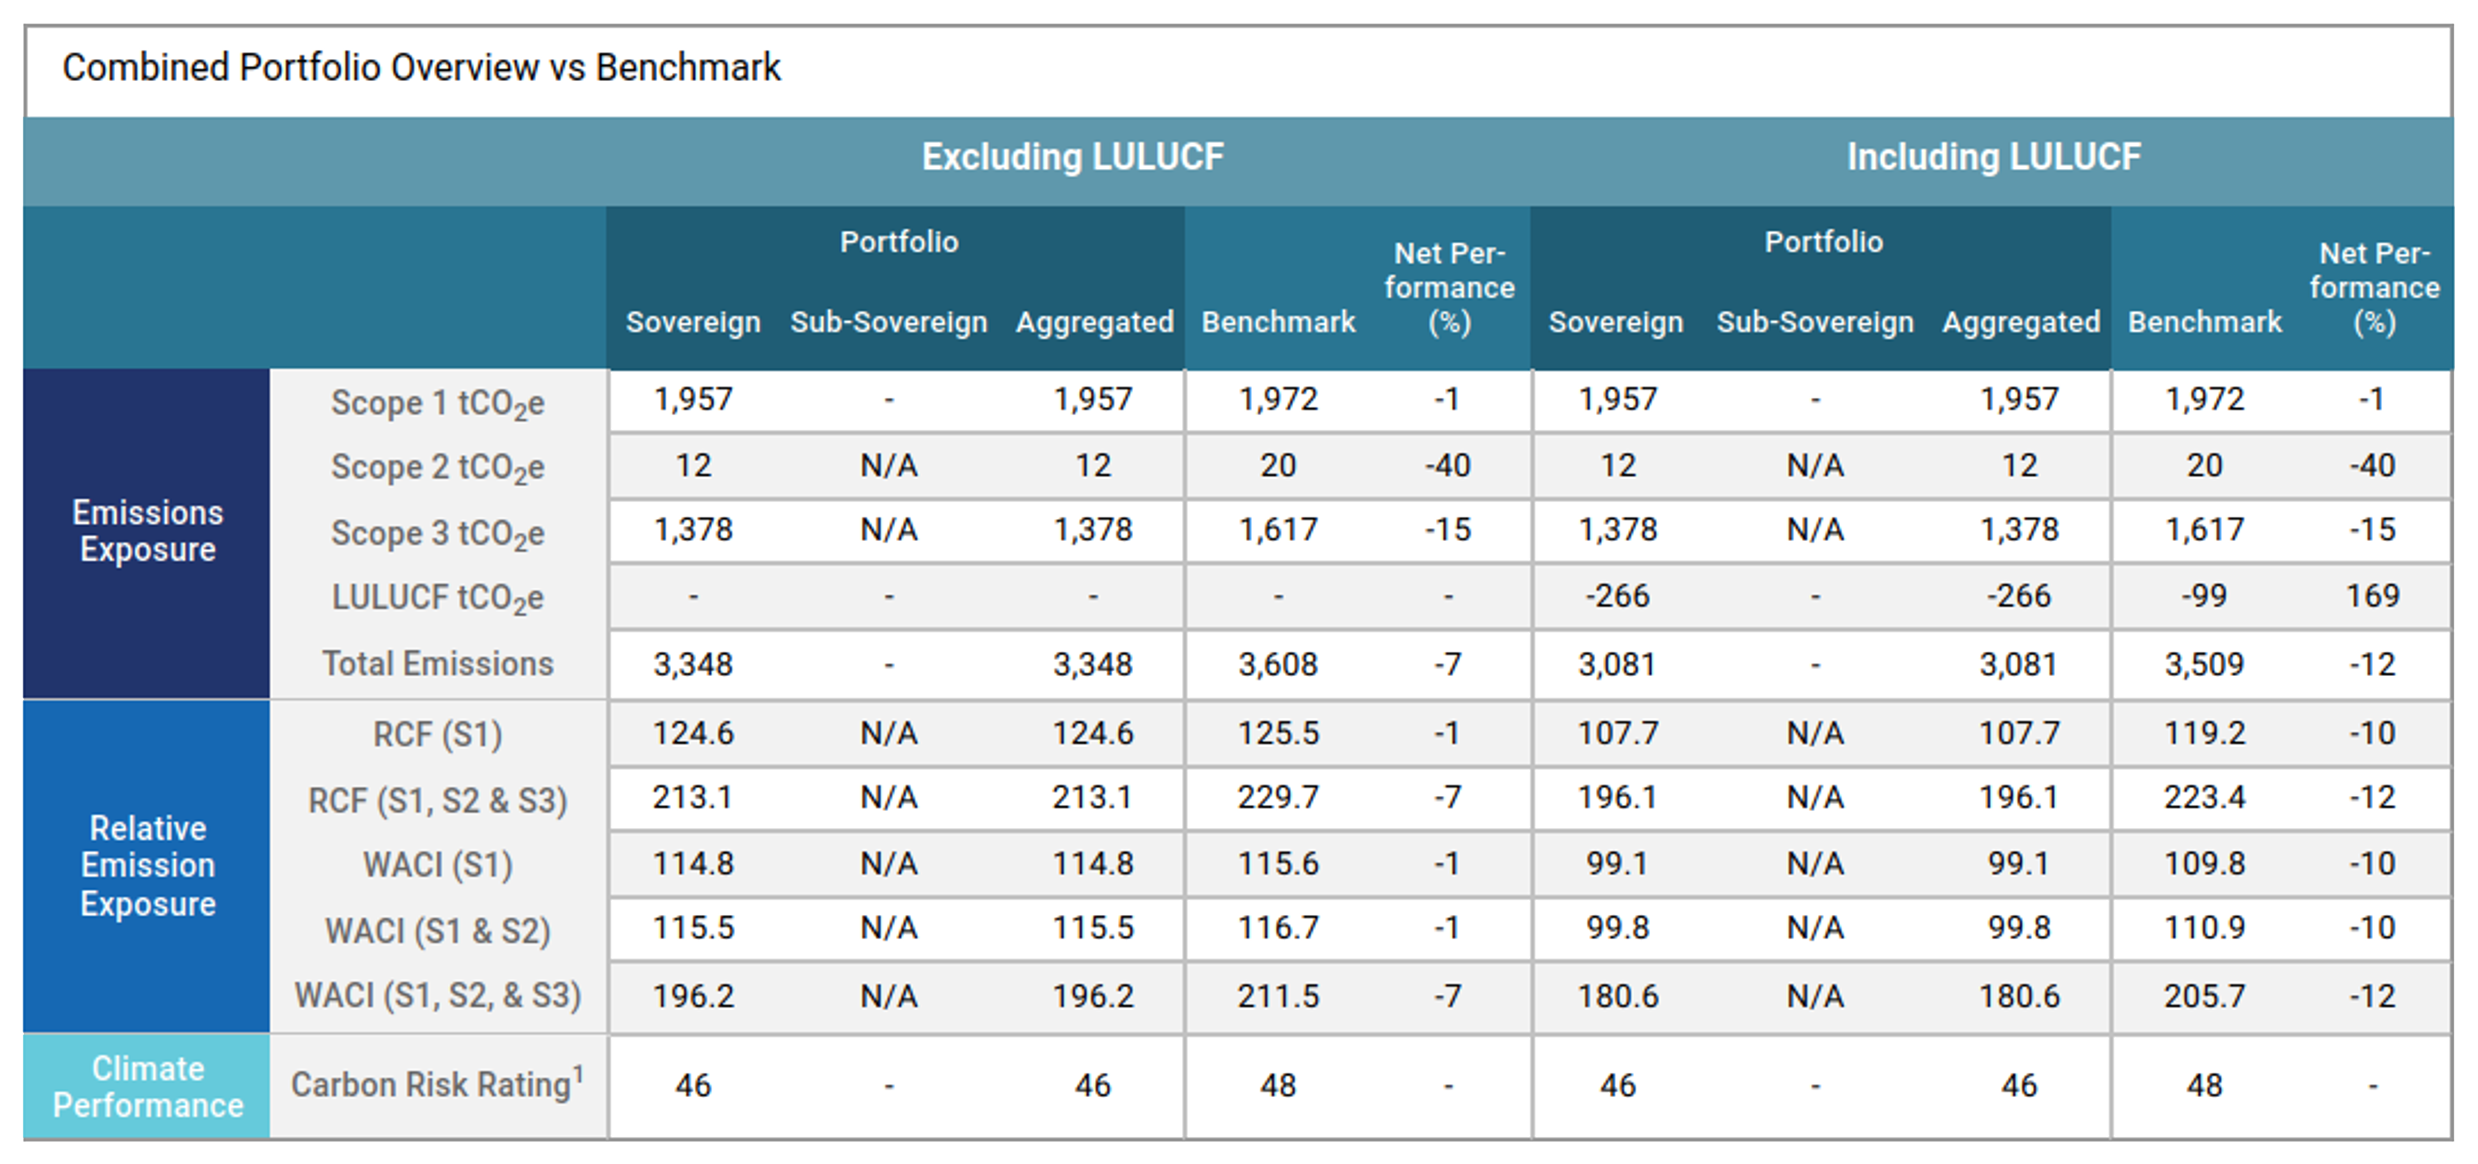
The portfolio’s emissions exposure related to production emissions (Scope 1) is broadly aligned with that of the benchmark, with a difference of just –1%. The inclusion of LULUCF emissions further improves the overall result: the countries held in the portfolio exhibit a higher absorption capacity, resulting in a larger carbon sink compared with the benchmark.
Differences become more pronounced in Scope 2 and Scope 3, where the portfolio shows significantly lower exposure: –40% for Scope 2 and –1% for Scope 3. This indicates that the portfolio is less exposed both to imported emissions from electricity and heat (Scope 2) and to embedded emissions in imported goods (Scope 3).
In terms of Relative Emission Exposure, the portfolio performs in line with or better than the benchmark: the Relative Carbon Footprint (RCF) is identical for Scope 1 and lower for Scopes 2 and 3. The favourable contribution of LULUCF further reduces the emissions footprint per million invested.
This pattern is confirmed by the WACI, which measures emissions intensity relative to GDP. The portfolio is broadly aligned with the benchmark for Scopes 1 and 2, while showing better performance (-7%) when Scope 3 is included – that is, when emissions associated with trade and supply‑chain flows are accounted for. In this case, a more favourable LULUCF component contributes to lowering the aggregate emissions intensity of the countries in the portfolio.
In summary, the portfolio is aligned with the benchmark with respect to production emissions (Scope 1) and RCF, while being less exposed to imported emissions and benefitting from a stronger LULUCF absorption capacity, which improves its overall emissions profile.
It is important to highlight that the SICAV’s sovereign‑issuer selection methodology [7] incorporates only limited climate‑specific criteria. Consequently, the differences observed relative to the benchmark are primarily driven by different country weightings within the portfolio.
Sovereign Green Bond: use of proceeds analysis
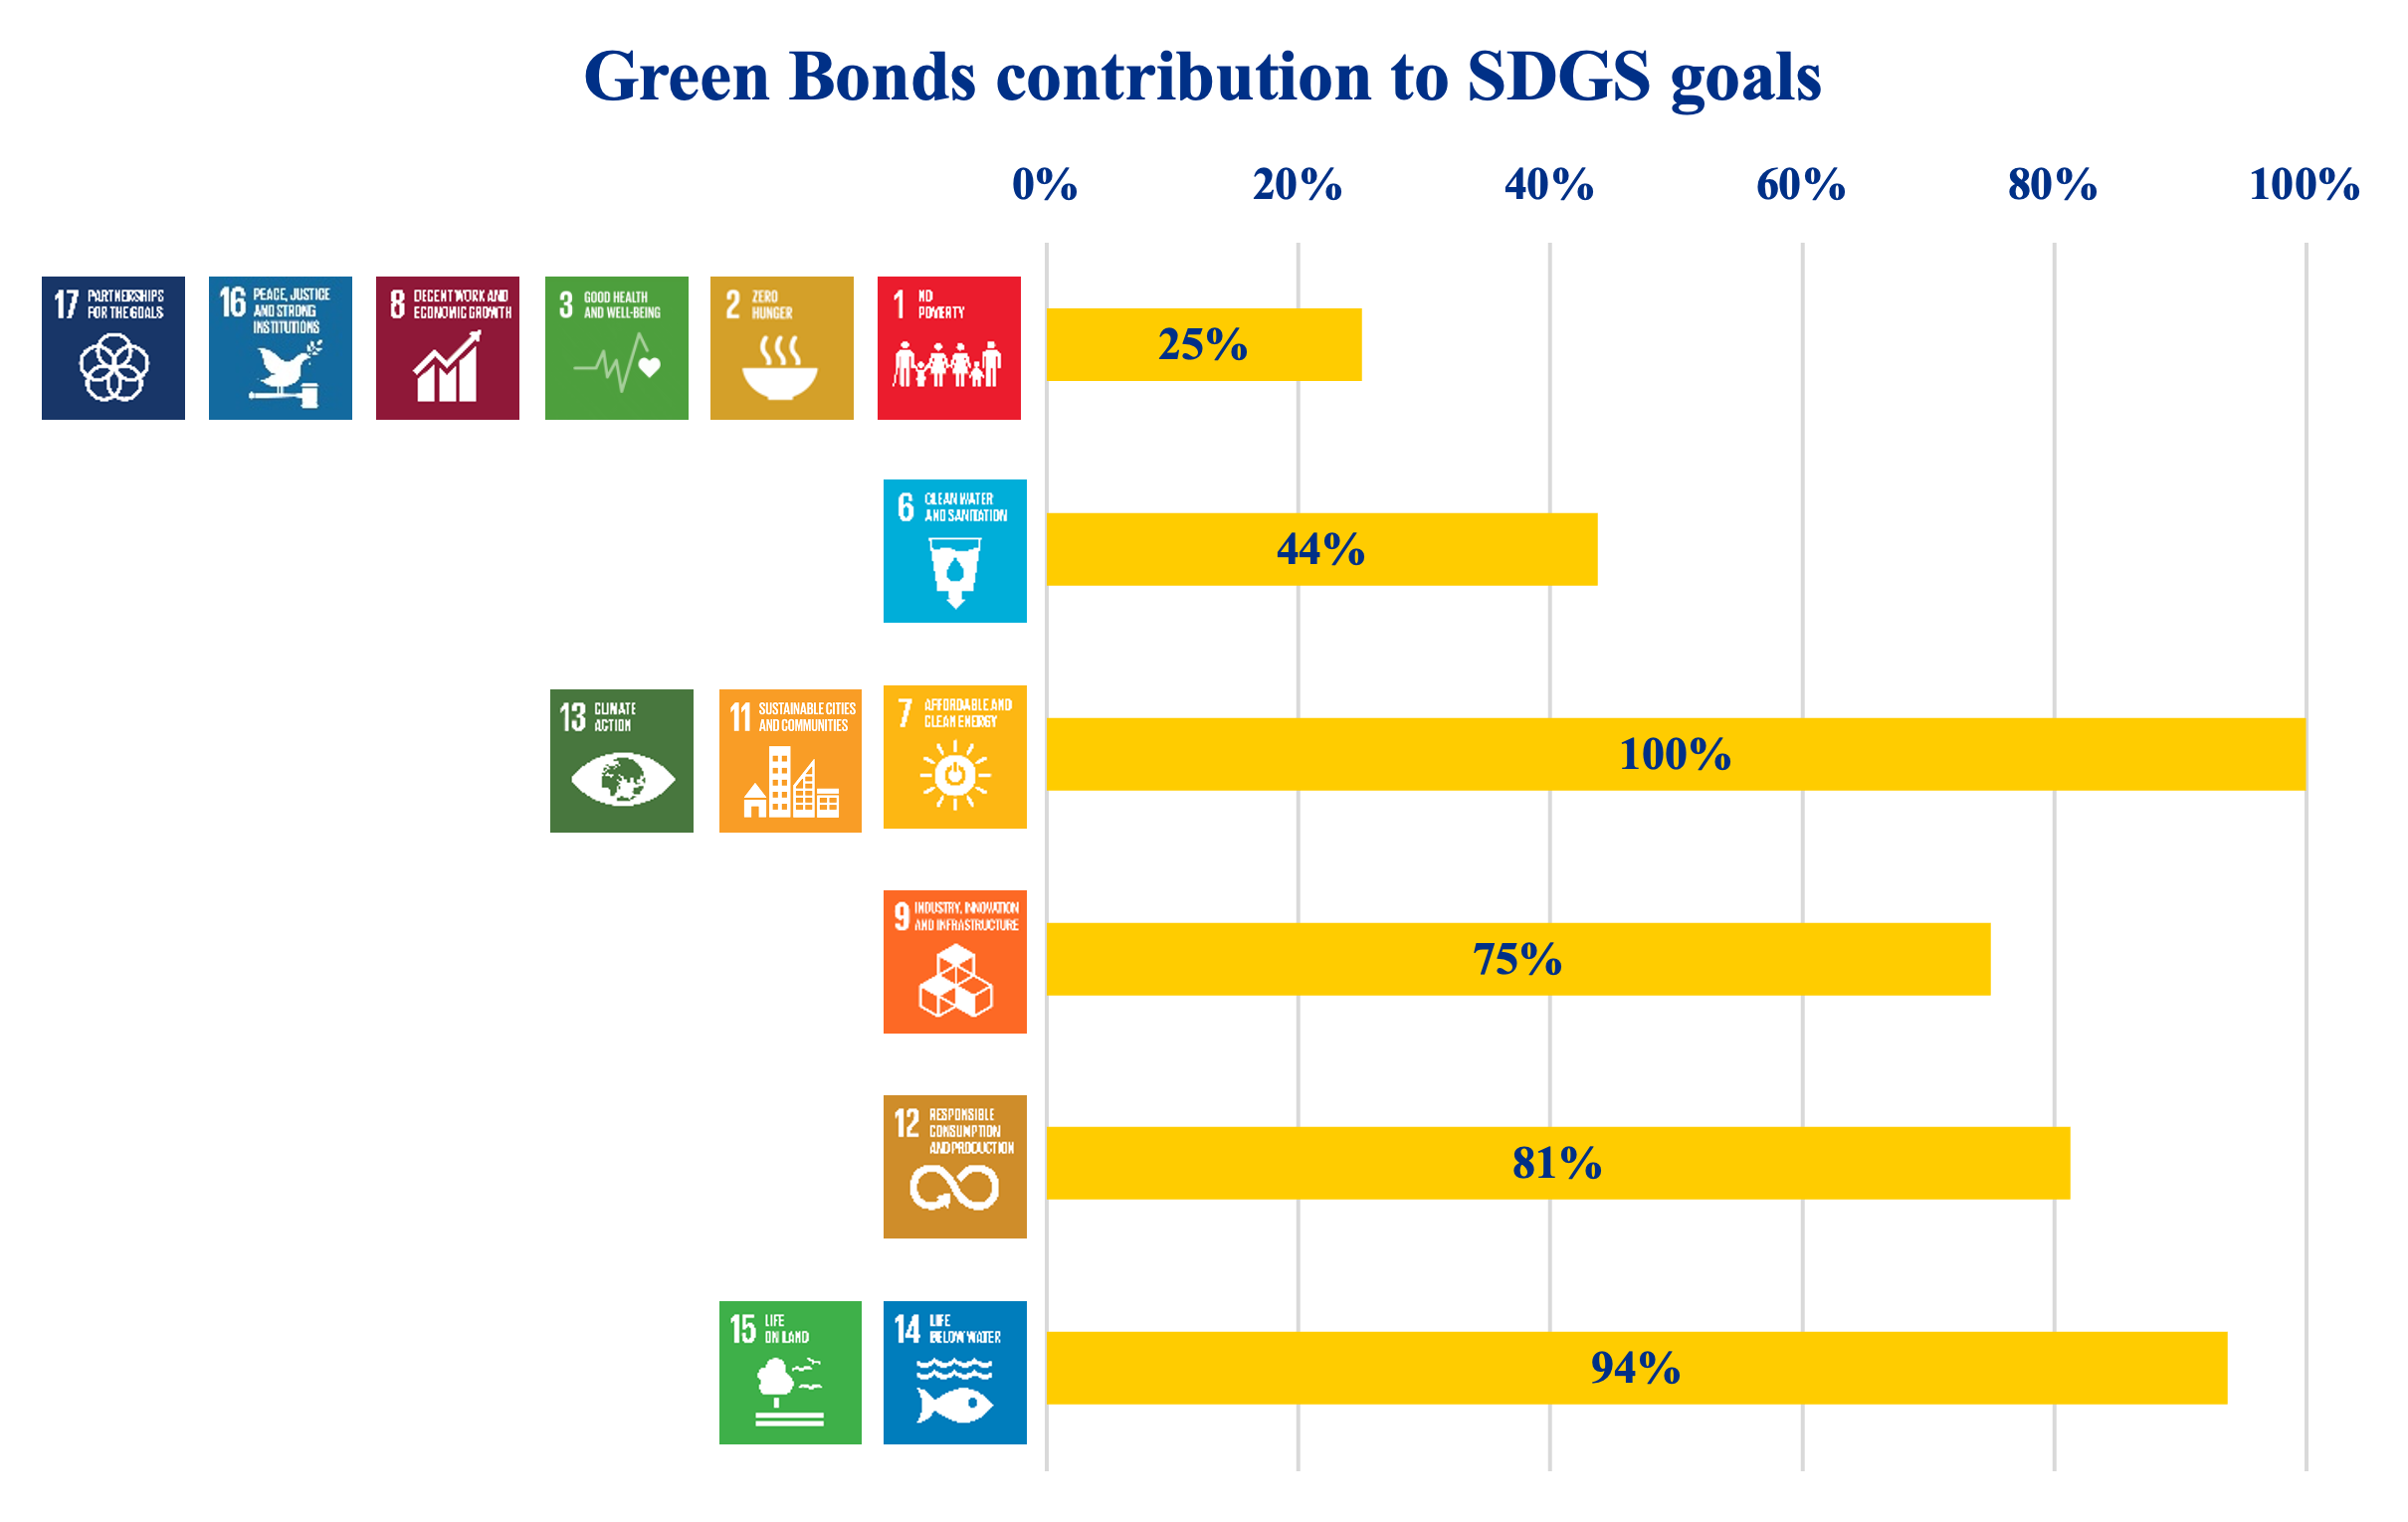
At the end of 2025, the SICAV portfolio included 52 sovereign bonds, half of which were classified as green bonds. Although they represent only 50% of the holdings by number, their economic weight is significantly higher: more than 75% of the total sovereign exposure derives from green bonds. This means that the majority of the portfolio’s investment in government securities contributes directly to the financing of environmental projects with measurable impacts.
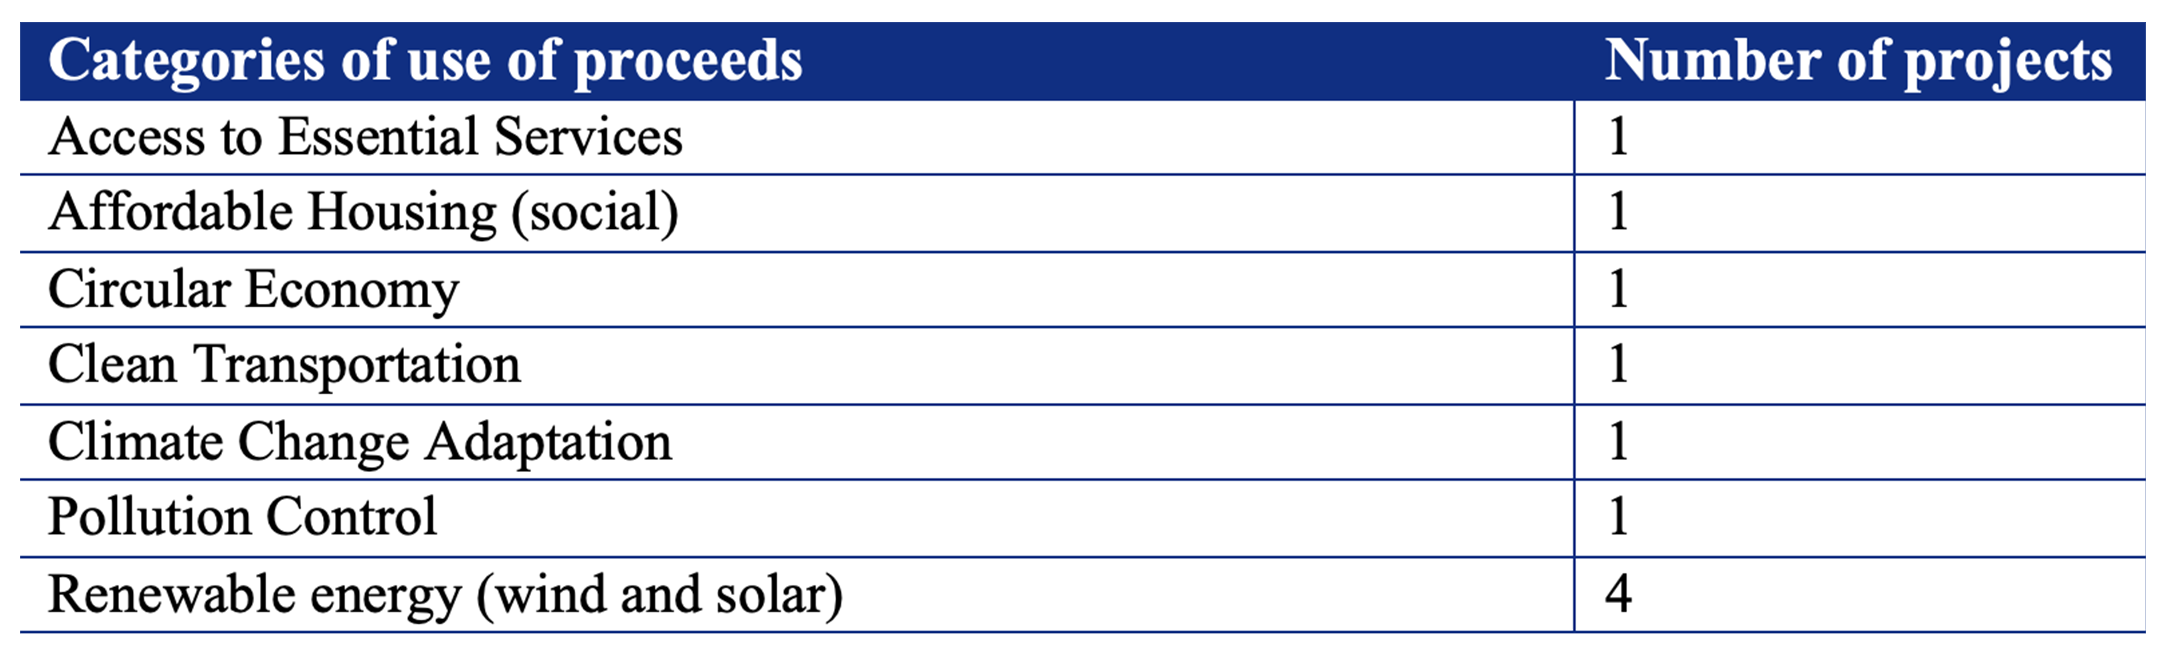
The use‑of‑proceeds analysis – based on allocation data disclosed by sovereign issuers and categorised according to the Sustainable Development Goals (SDGs) – shows a strong concentration of investments in areas that are key to the ecological transition.
It should be noted that 100% corresponds to the total share of green bonds held in the portfolio.
The table below reports the different project categories financed by the sovereign green bonds included in the portfolio.
Conclusion
Etica’s proprietary methodology for selecting issuers, especially the climate‑assessment framework, remain robust. The refinements introduced in recent years have driven a substantial reduction in emissions versus 2019:
- -72% carbon footprint
- -70% carbon intensity
- -72% WACI
The scenario analysis indicates good alignment while also highlighting the growing importance of Scope 3 in assessing credible decarbonisation pathways. Transition and physical risks are well managed overall and consistent with a portfolio in which a large share of investee power generation comes from renewable sources.
On the sovereign side, although climate criteria are not the primary driver in selection, the analysis still shows outperformance versus the benchmark, underscoring the quality of portfolio allocation. In addition, the use‑of‑proceeds review for both corporate and sovereign green bonds provides a clearer view of the portfolio’s real‑economy contribution to the transition, highlighting the positive impact of financed projects.
Finally, ongoing emissions measurement remains essential to guide engagement and identify further improvements. The integration of new IEA scenarios into forward‑looking assessments is an important step: broader application can support further methodological enhancements and reinforce the portfolio’s positioning along a credible, ambitious transition pathway.
References
[1] https://www.issgovernance.com/esg/
[2] Launched after the 2015 Paris Agreement by the Financial Stability Board (FSB), the Task Force on Climate-related Financial Disclosure (TCFD – https://www.fsb-tcfd.org/) considers climate transparency as a crucial factor for the stability of financial markets. The objective of the TCFD is therefore to improve climate transparency in financial markets through recommendations on disclosure. These recommendations provide a “consistent framework that improves the ease of both producing and using climate-related financial disclosures”. The TCFD aims to create a unique standard for both corporate and investment disclosure, understanding that local regulatory frameworks may require different compliance levels. By October 12, 2023, the TCFD had fulfilled its mission and disbanded, although it remains a valid guideline for assessing and reporting on climate-related risks.
[3] It is important to note that the percentages reported for each effect do not represent shares of the total difference, but rather percentages of the benchmark’s total emissions.
[4] AR5 (2013/2014) – IPCC – Focal Point Italia
[5] Note that 1 bond could finance 1 or more project categories. The categories are defined according to Bloomberg analysis of the Allocation Report and Bond framework published by the issuers.
[6] Vonovia, Allocation & Impact Reporting, December 2024
[7] Selection of securities: ESG and financial analysis | Etica Funds
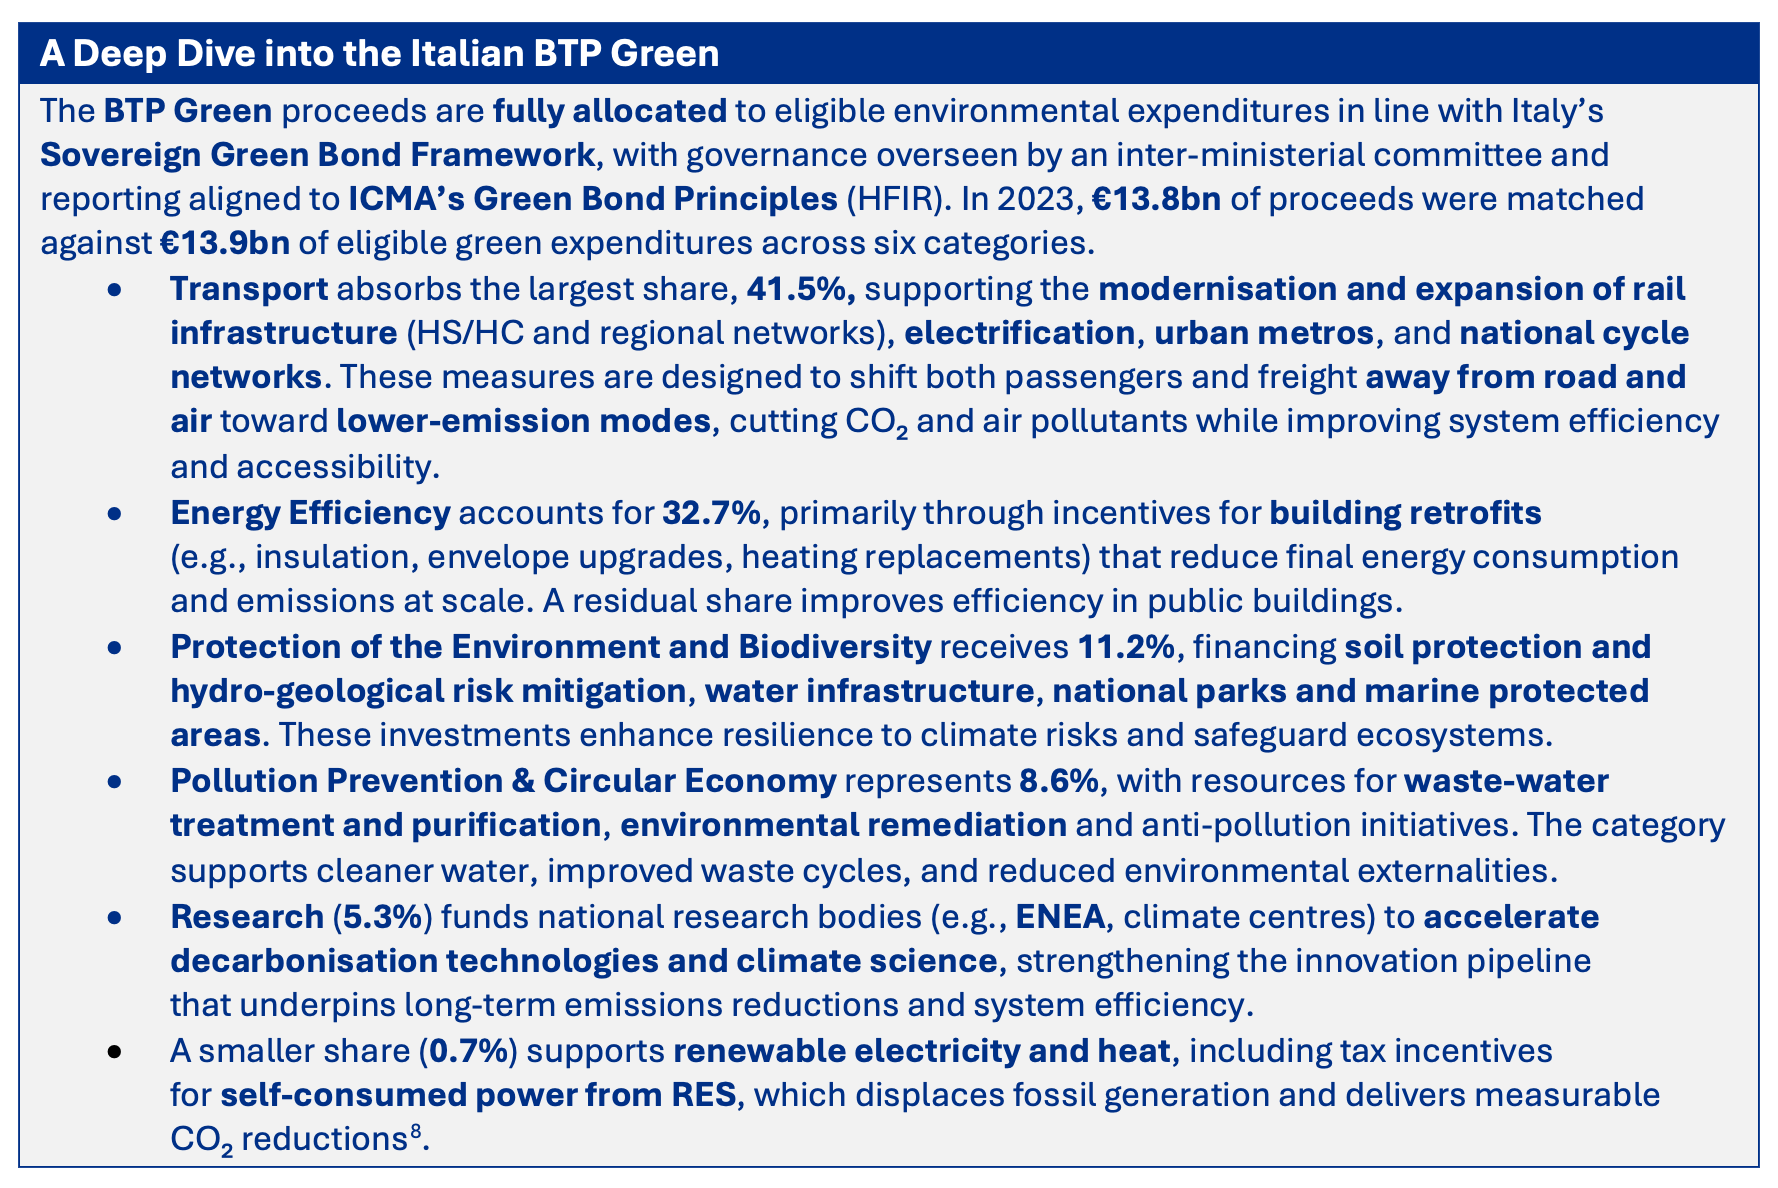
[8] BTP Green Allocation and Impact Report 2023
This is a marketing communication.
This communication has been produced by Etica SGR S.p.A., in its capacity as investment manager and global distributor of the sub-funds Etica ESG Global Equity, Etica ESG Dynamic Allocation, and Etica ESG Conservative Allocation (the “Sub-Funds”) of the Luxembourg-domiciled UCITS Multilabel Sicav, established by Carne Global Fund Managers (Luxembourg) S.A. (“Carne LUX”), and is intended exclusively for professional investors.
Investing in the Sub-Funds involves acquiring shares of the SICAV and entails risks related to possible fluctuations in the value of those shares, which in turn reflect the performance of the financial instruments in which the Sub-Funds’ resources are invested. Investors should only make an investment decision regarding the Sub-Funds after having fully understood their overall characteristics and the degree of exposure to related risks, by carefully reading the Prospectus and the Key Information Document (KID), which – together with information regarding sustainability aspects pursuant to Regulation (EU) 2019/2088 – are available at www.eticasgr.com.
Investing in the Sub-Funds offers no guarantee of returns and does not ensure the reimbursement of the capital initially invested. Any future returns are subject to taxation, which depends on the personal situation of each investor and may change over time.
This communication does not take into account the investment objectives, financial situation, or specific needs of any potential recipients. Therefore, it should in no way be interpreted as investment advice. Recipients of this communication assume full and sole responsibility for the use of the information contained herein, as well as for any investment decisions made based on it, since any use of this information as a basis for investment choices is not permitted and is entirely at the investor’s own risk.
The Sub-Funds are authorized for distribution in Italy exclusively to professional investors. However, the issuer may decide to terminate such distribution in Italy at any time. The Sub-Funds are not authorized for distribution in certain jurisdictions; therefore, no marketing activity may be carried out in those jurisdictions in relation to them. This communication may not be distributed to individuals other than the intended recipients, nor reproduced in any part, in any form, without the prior authorization of Etica SGR S.p.A.

 – SICAV")
 – Etica Transizione Climatica")