
This document provides a summary of the Climate Impact Report prepared by ISS ESG [1] , which is based on its proprietary methodology and refers to the holdings of the Etica Transizione Climatica (hereafter referred to as “the portfolio”). The report incorporates metrics that comply with the Task Force on Climate-related Financial Disclosures’ (TCFD [2]) guidelines.
All asset classes were analysed in accordance with the TCFD recommendations and grouped into two components: Equity Portfolio (including unlabelled equities and corporate bonds) and Sovereign Bond Portfolio (comprising only unlabelled sovereign securities).
In line with the June 2025 portfolio analysis, green bonds were excluded from the calculation of issuers’ emissions, as their purpose is to finance environmental projects. The TCFD analysis measures the contribution of each issuer to greenhouse gas emissions based on its weight in the portfolio, so that the correct share of emissions can be attributed to Etica’s investment. Including green bonds in this calculation would increase the weighting of the relevant issuer in the portfolio, and consequently the emissions financed. This would distort the results.
A separate assessment of the use of proceeds from both corporate and sovereign green bonds is available in the report.
This illustrates the climate performance of the portfolio as at 30 December 2025 and compares it with that of the MSCI World Universal Net Total Return Index (hereinafter referred to as ‘the benchmark’), which is used as the market benchmark as of 31 December 2025.
- Corporate carbon metrics
- Scenario analysis
- Physical risk analysis
- Transitional Risk Analysis
- Corporate Green Bonds: use of proceeds analysis
- Analysis of sovereign emissions
- Sovereign green bonds: use of proceeds analysis
- Conclusions
Corporate carbon metrics
The carbon metrics used in the corporate analysis are those recommended by the TCFD and are defined as follows:
- Emissions Exposure – How much emissions am I responsible for as an investor?
Measures the portfolio’s ‘financed’ or ‘owned’ emissions, including Scope 1, 2 and 3. Represents the absolute amount of emissions attributable to investments in the portfolio. - Relative Carbon Footprint – For every million invested, what is my emissions exposure?
Measures the emissions financed for every million euro invested, applying the principle of ownership. It is expressed in tonnes of CO₂ equivalent per million euro invested and is an impact risk metric. - Carbon Intensity – How efficient are the companies I invest in in terms of emissions?
It calculates the portfolio’s emissions in relation to the revenues generated by the issuers. It is obtained by dividing the portfolio’s financed emissions by ‘owned’ revenues and is expressed in tonnes of CO₂ equivalent per million euro of revenues. It measures the risk associated with the operational performance of companies. - Weighted Average Carbon Intensity (WACI) – What is my exposure to high-emission investments?
It assesses the portfolio’s exposure to carbon-intensive companies. Unlike financed emissions, this metric does not apply the ownership principle but considers the weighted average emissions per million euros of revenues of the issuers in the portfolio. It is expressed in tonnes of CO₂ equivalent per million euros of revenues and is a transition risk indicator.
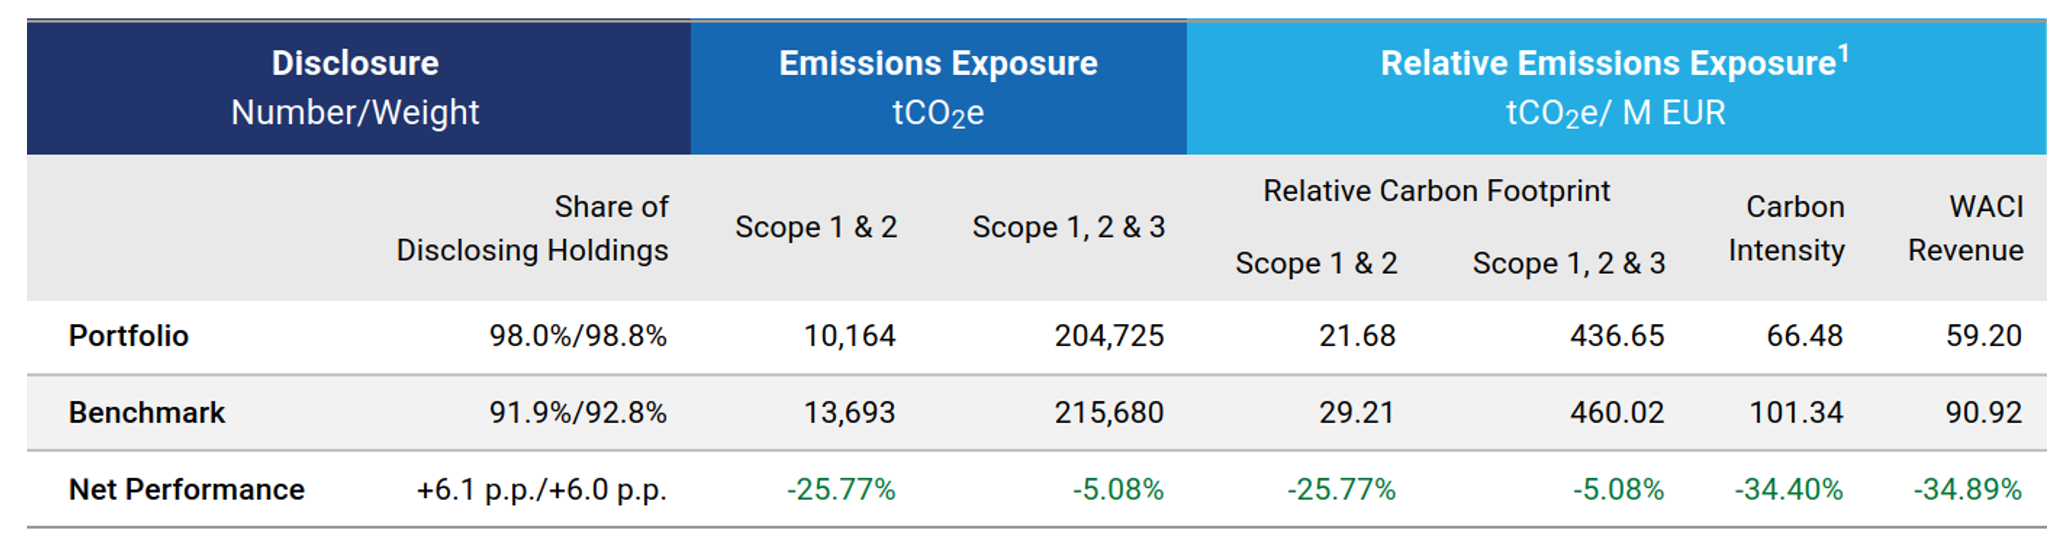
The portfolio outperforms the benchmark in all metrics analysed:
- -25.77% carbon footprint (Scope 1 & 2), indicating lower emissions per million invested, and -5.08% when Scope 3 is also considered;
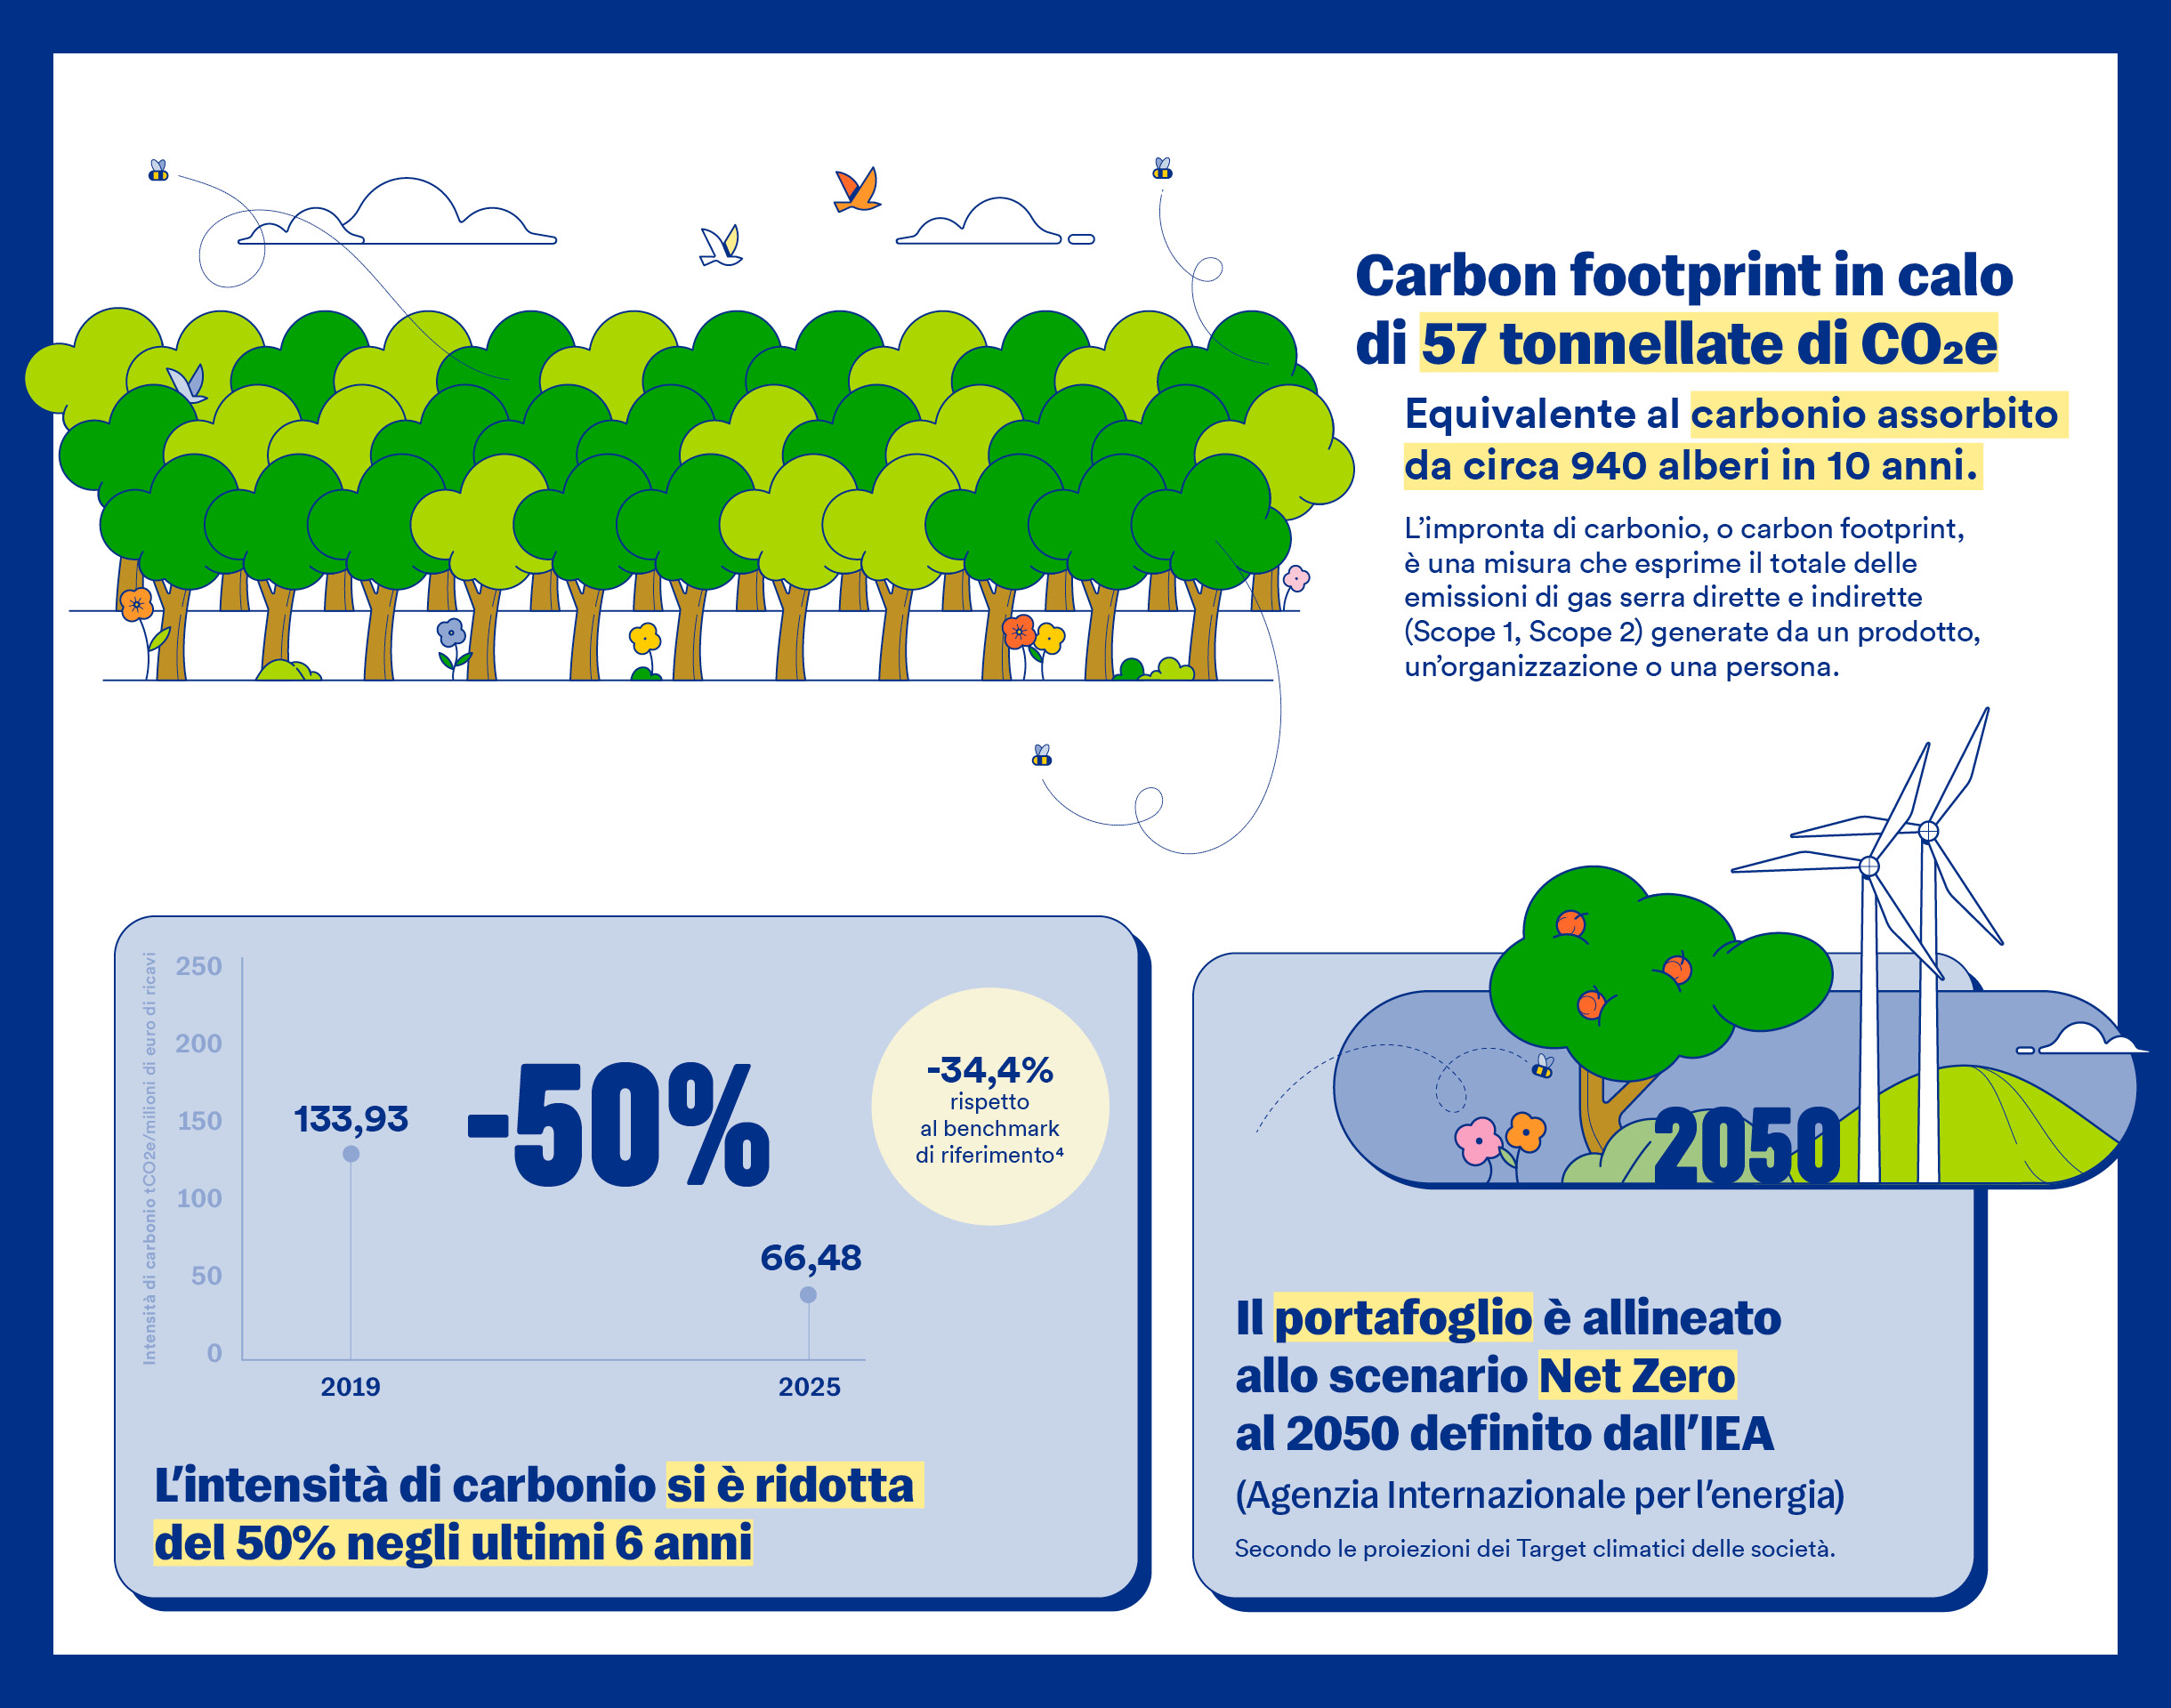
- -34.40% carbon intensity, indicating greater efficiency: the companies in the portfolio generate fewer emissions per unit of revenue;
- -34.89% WACI, reflecting the portfolio’s lower exposure to sectors characterised by high emissions intensity.
This is an overall positive result for the Etica Transizione Climatica, which shows a steady reduction in emissions in line with the fund’s focus on climate transition.
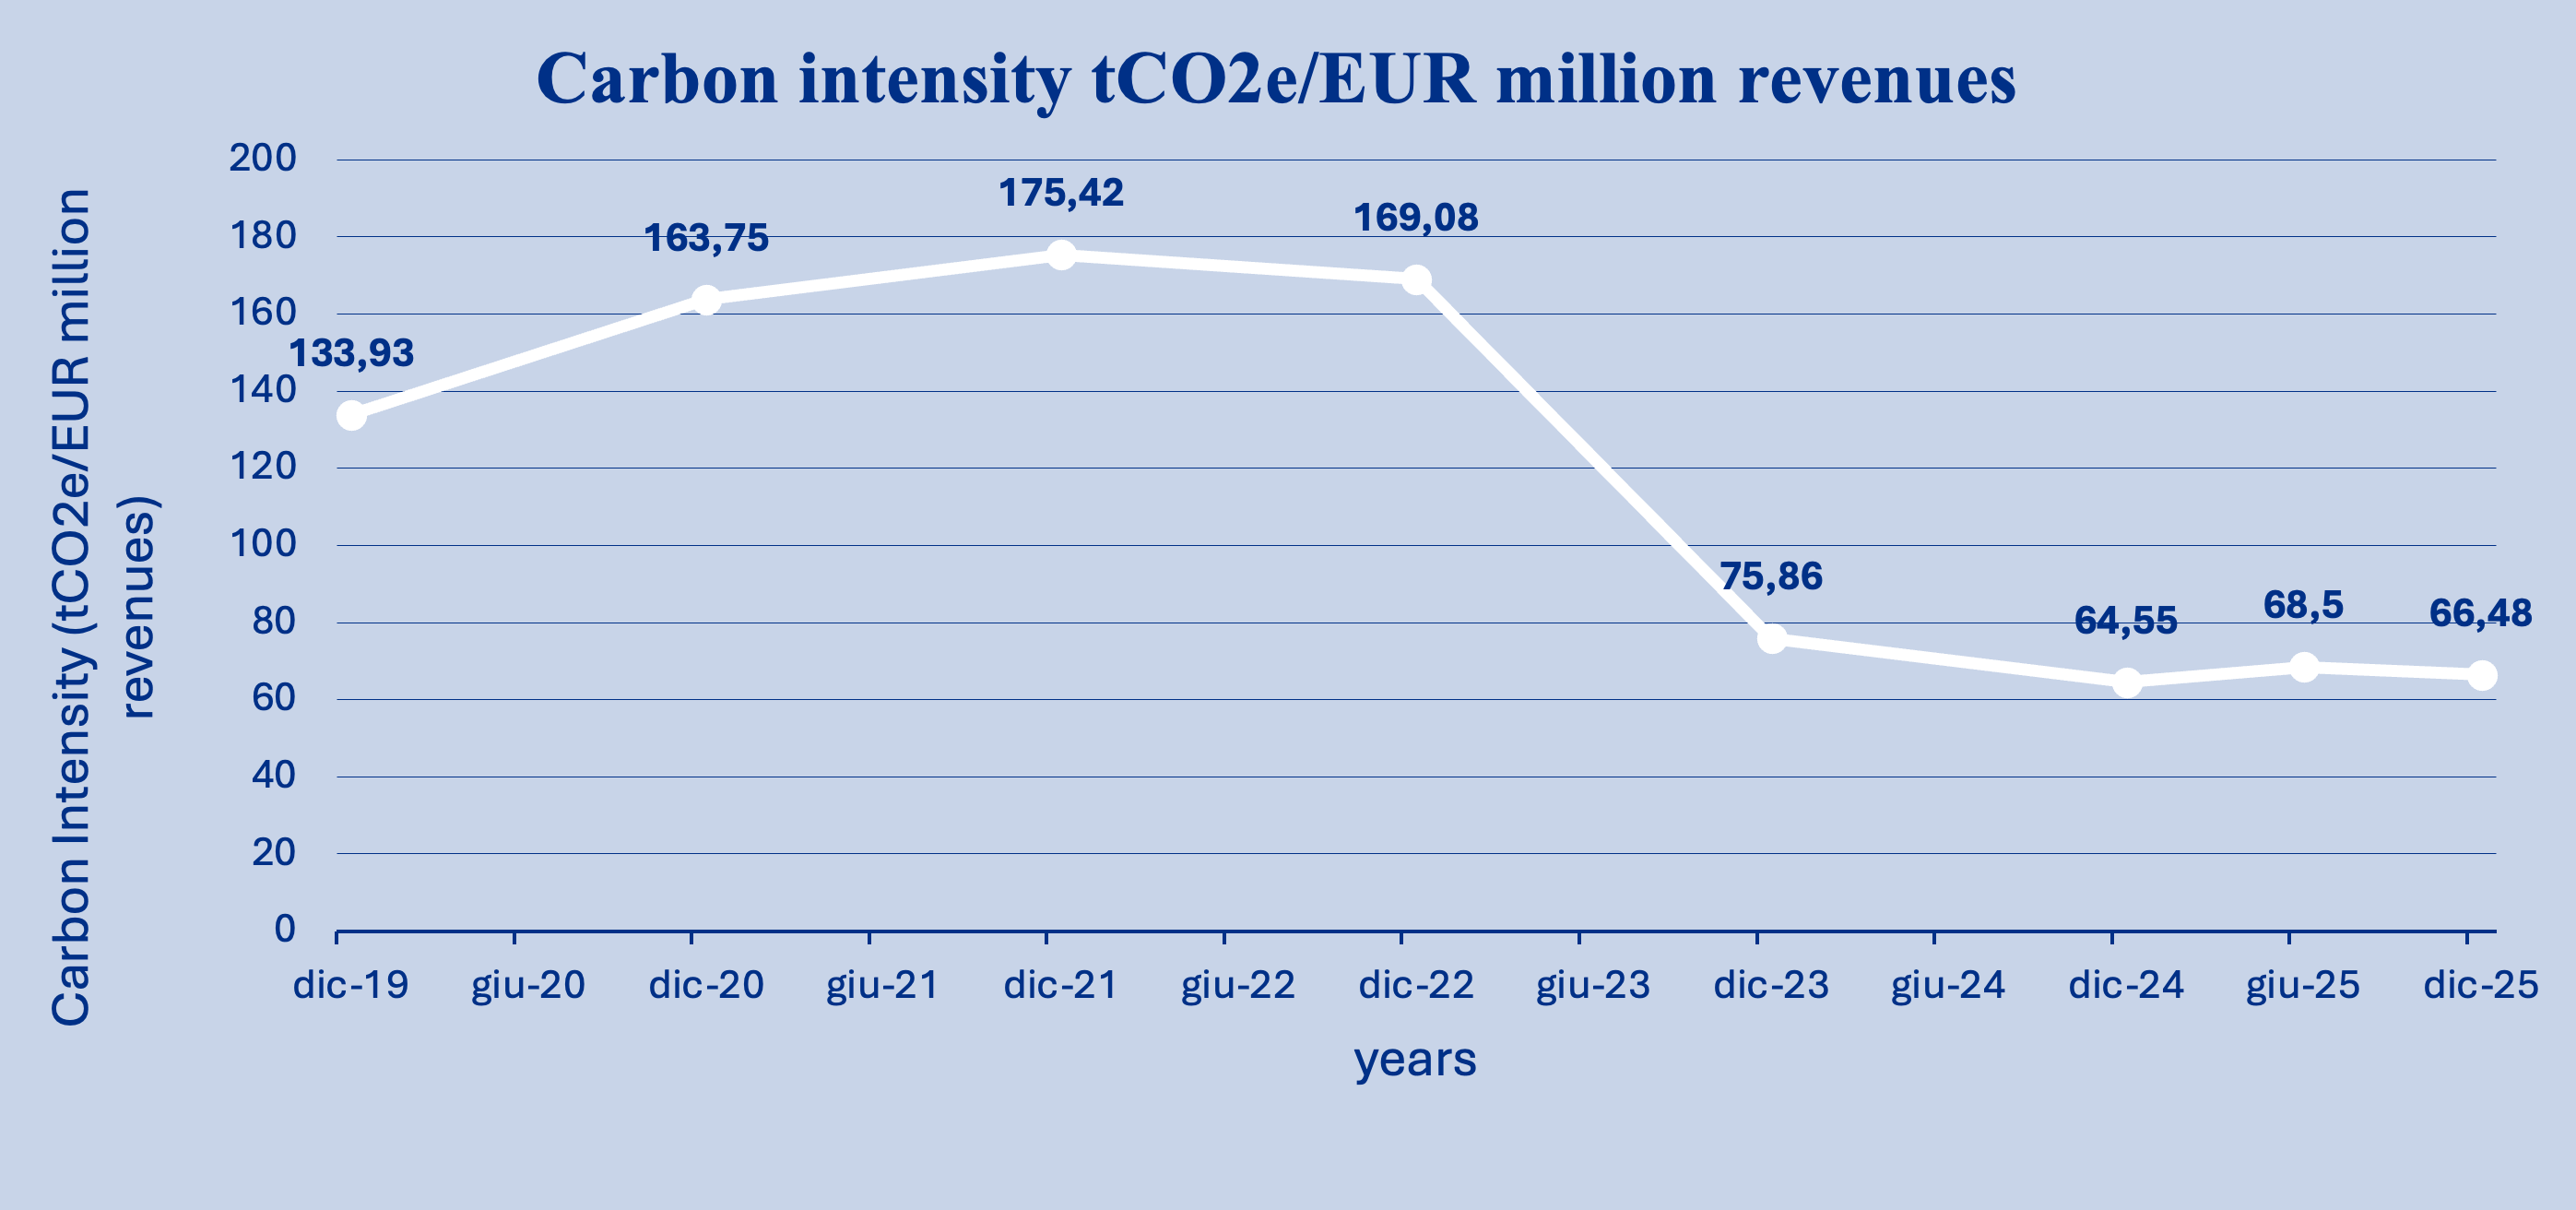
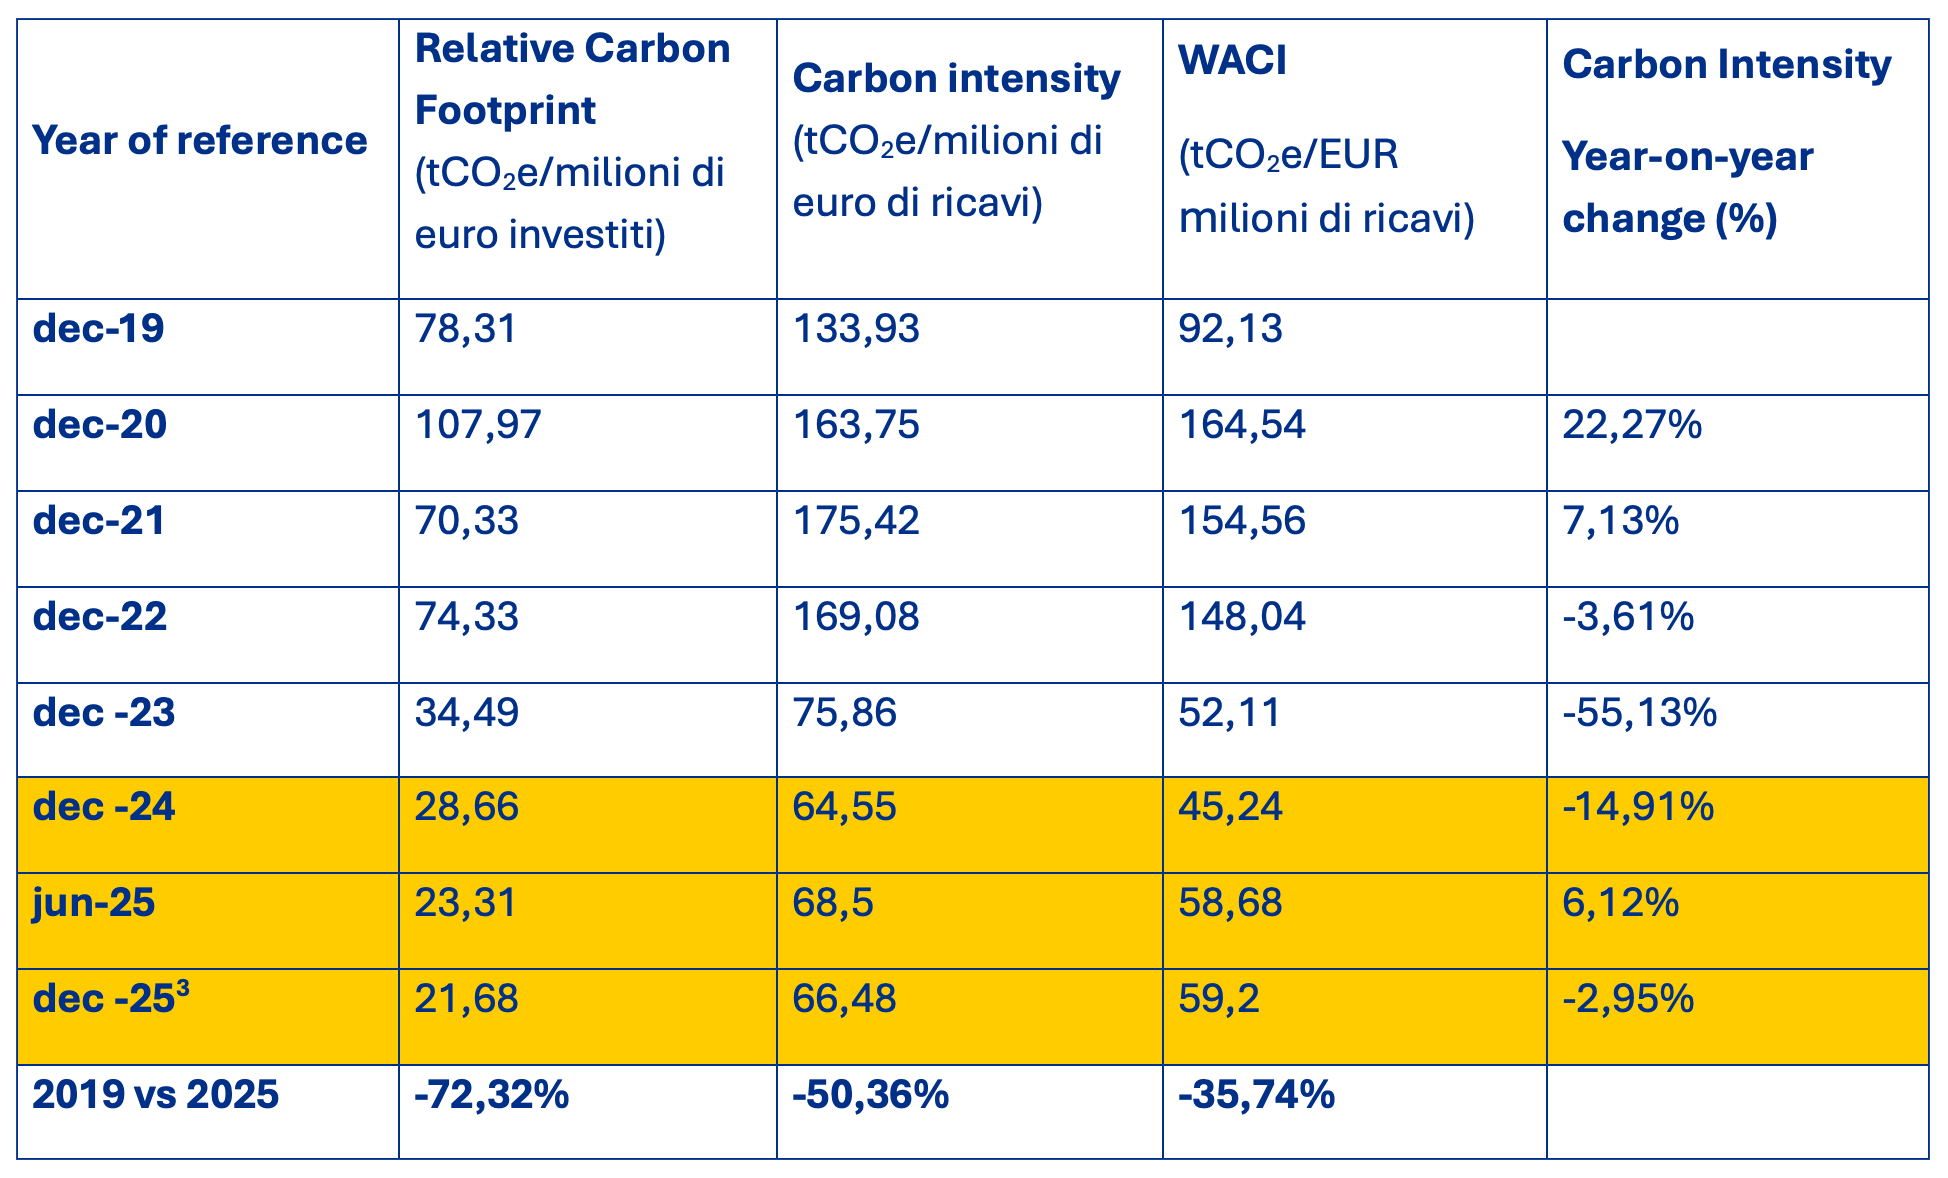
Analysis of historical data shows that the portfolio has made significant progress in reducing emissions since 2019, as shown in the graphs below. In recent years, there has been a gradual stabilisation in the reduction trend, primarily because no substantial changes have been made to the calculation methodology. This reflects a more mature and consolidated trend.
In general, the combination of financial decisions and sustainability choices contributed to improved metrics compared to the benchmark. Analyzing emissions attribution provides a clearer picture of the impact of Etica Sgr’s choices. The table below compares the portfolio’s Scope 1 and 2 emissions with the benchmark and breaks down the overall difference into two components:
- Sector Allocation measures how much of the result derives from the decision to overweight or underweight certain sectors;
- Issuer selection captures the effect of choosing issuers with higher or lower emissions within individual sectors.
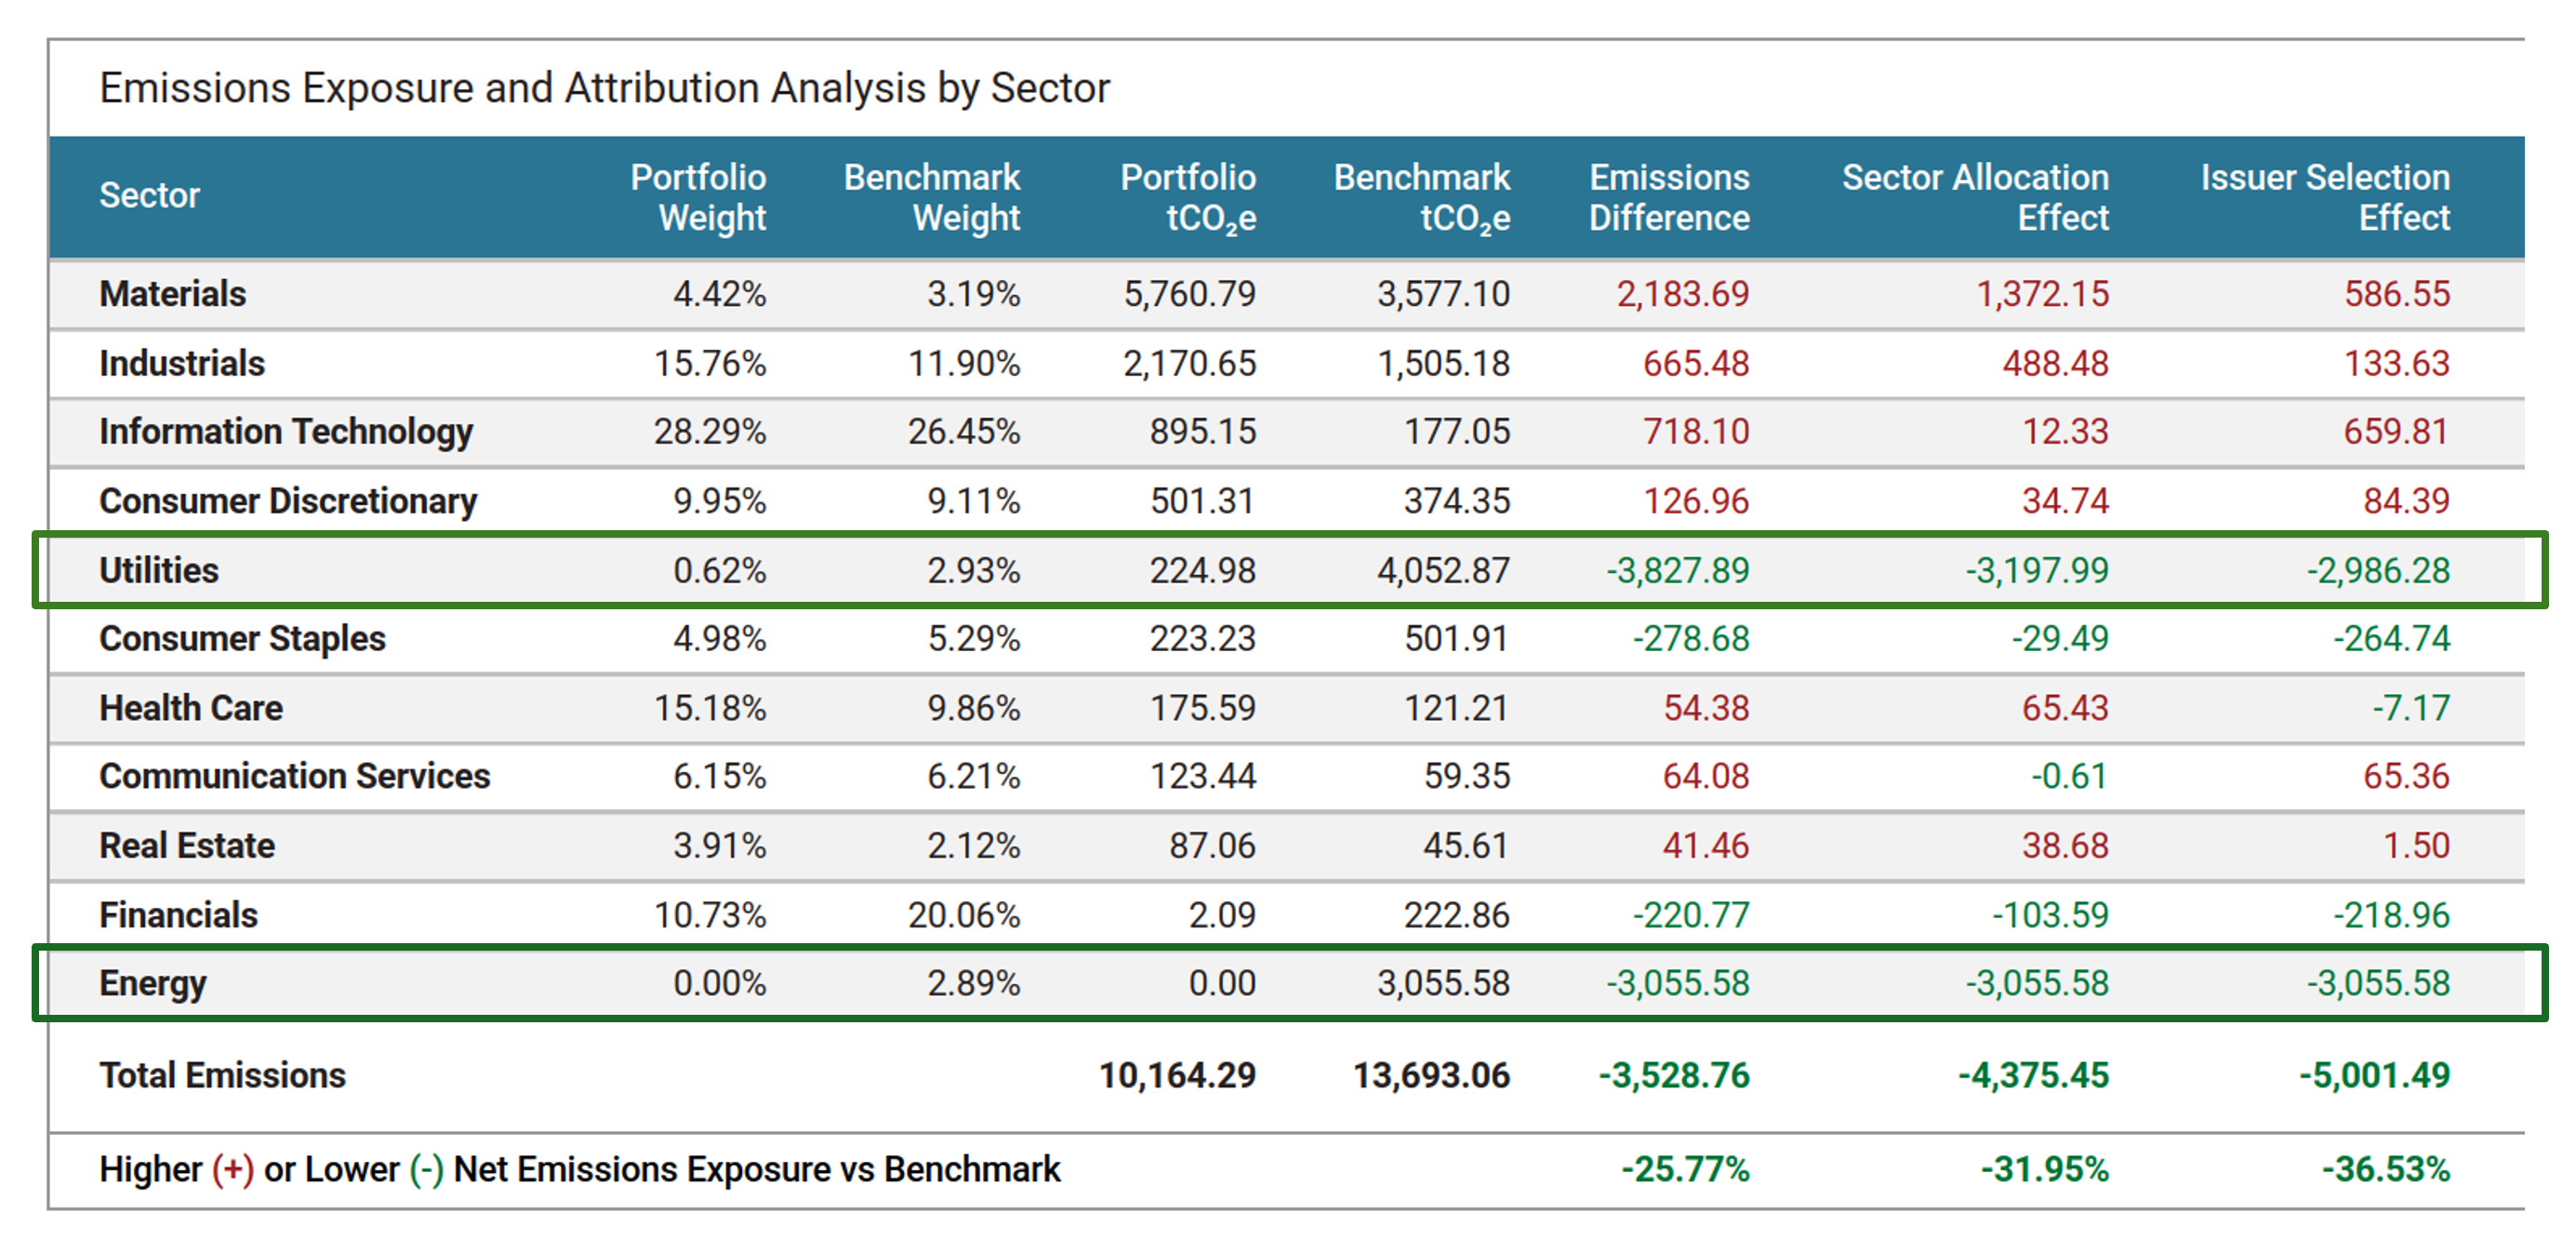
The portfolio shows total emissions of –3,528.76 tCO₂e (-25.77%) compared to the benchmark.
Attribution effects show that this improvement stems from:
- Sector allocation: -31.95%
The portfolio has lower exposure to sectors characterised by higher carbon intensity. This contributes significantly to the reduction in financed emissions. - Issuer selection: -36.53%
Within sectors, the portfolio favours issuers with significantly lower emission profiles than their peers, further amplifying the reduction in emissions compared to the benchmark [4].
It is important to note that portfolios with a higher concentration of issuers in emission-intensive sectors will naturally have a higher exposure to greenhouse gas emissions. However, this effect can be offset by selecting more emission-efficient issuers within the same sectors.
The methodological choice not to invest in the energy sector, combined with the application of rigorous climate assessments to companies involved in fossil fuels, mainly in the utilities sector, largely explains the observed improvement. This approach, consistent with Etica Sgr’s philosophy, helps keep the portfolio’s exposure to emissions structurally lower than the benchmark.
Looking again at the table, it can be seen that the Materials sector is the one in which the portfolio shows the greatest exposure to Scope 1 and 2 emissions, compared to the benchmark. This result can be explained by several structural factors:
- The rigorous methodology applied to the sector significantly reduces the investable universe, consisting of a very small number of issuers that are compatible with sustainability criteria. With such a limited universe, it is inevitable that some ‘eligible’ stocks will be overrepresented compared to the benchmark, resulting in higher emissions exposure;
- The Materials sector is, by definition, hard to abate, characterised by production processes that are difficult to electrify and immature decarbonisation technologies. Even when strict criteria are applied, the remaining issuers maintain relatively high emission levels.
In contrast, the opposite is true for the Utilities sector. The availability of well-established decarbonisation technologies, such as renewable energy generation, enables more efficient emitters to be identified and selected. This has a positive attribution effect in the utilities sector, which explains why the portfolio outperforms the benchmark – the opposite effect is seen in other sectors.
Net of structural sector differences, a combined portfolio of Climate Transition and the benchmark shows that Etica is under-exposed to the most emission-intensive issuers. This is mainly due to the selection methodology adopted, which excludes many of these companies because they do not comply with the climate and environmental criteria used to construct the investable universe.
Scenario analysis
The scenario‑alignment analysis provides a forward‑looking perspective on the portfolio’s compatibility with different climate futures, comparing the Scope 1, 2 and 3 emissions of the portfolio companies with carbon budgets derived from international climate scenarios. The methodology draws on sectoral and regional emissions pathways developed by models such as those of the IEA, NGFS and OECM. In continuity with previous years, Etica reports the results based on the IEA models (WEO22). The scenarios cover a wide range of potential global‑warming trajectories, from 1.5°C to above 3°C.
The chart illustrates three emissions trajectories: the Historical Projection, which extrapolates past reported emissions into the future; the Policies Projection, which reflects the expected evolution of sectors under currently implemented climate policies; and the Target Projection, which incorporates the emissions‑reduction targets publicly committed to by the companies in the portfolio. These trajectories are then compared with the carbon budgets associated with different climate scenarios.
The alignment of the portfolio and benchmark with Net Zero scenarios is assessed using two metrics: the Implied Temperature Rise (ITR), which indicates the temperature outcome associated with the portfolio’s use of its carbon budget, and the Crosspoint Year, i.e., the year in which cumulative emissions would exceed the allocated carbon budget. Both metrics rely on comparing projected cumulative emissions with the total carbon budget consistent with a decarbonisation pathway to 2050.
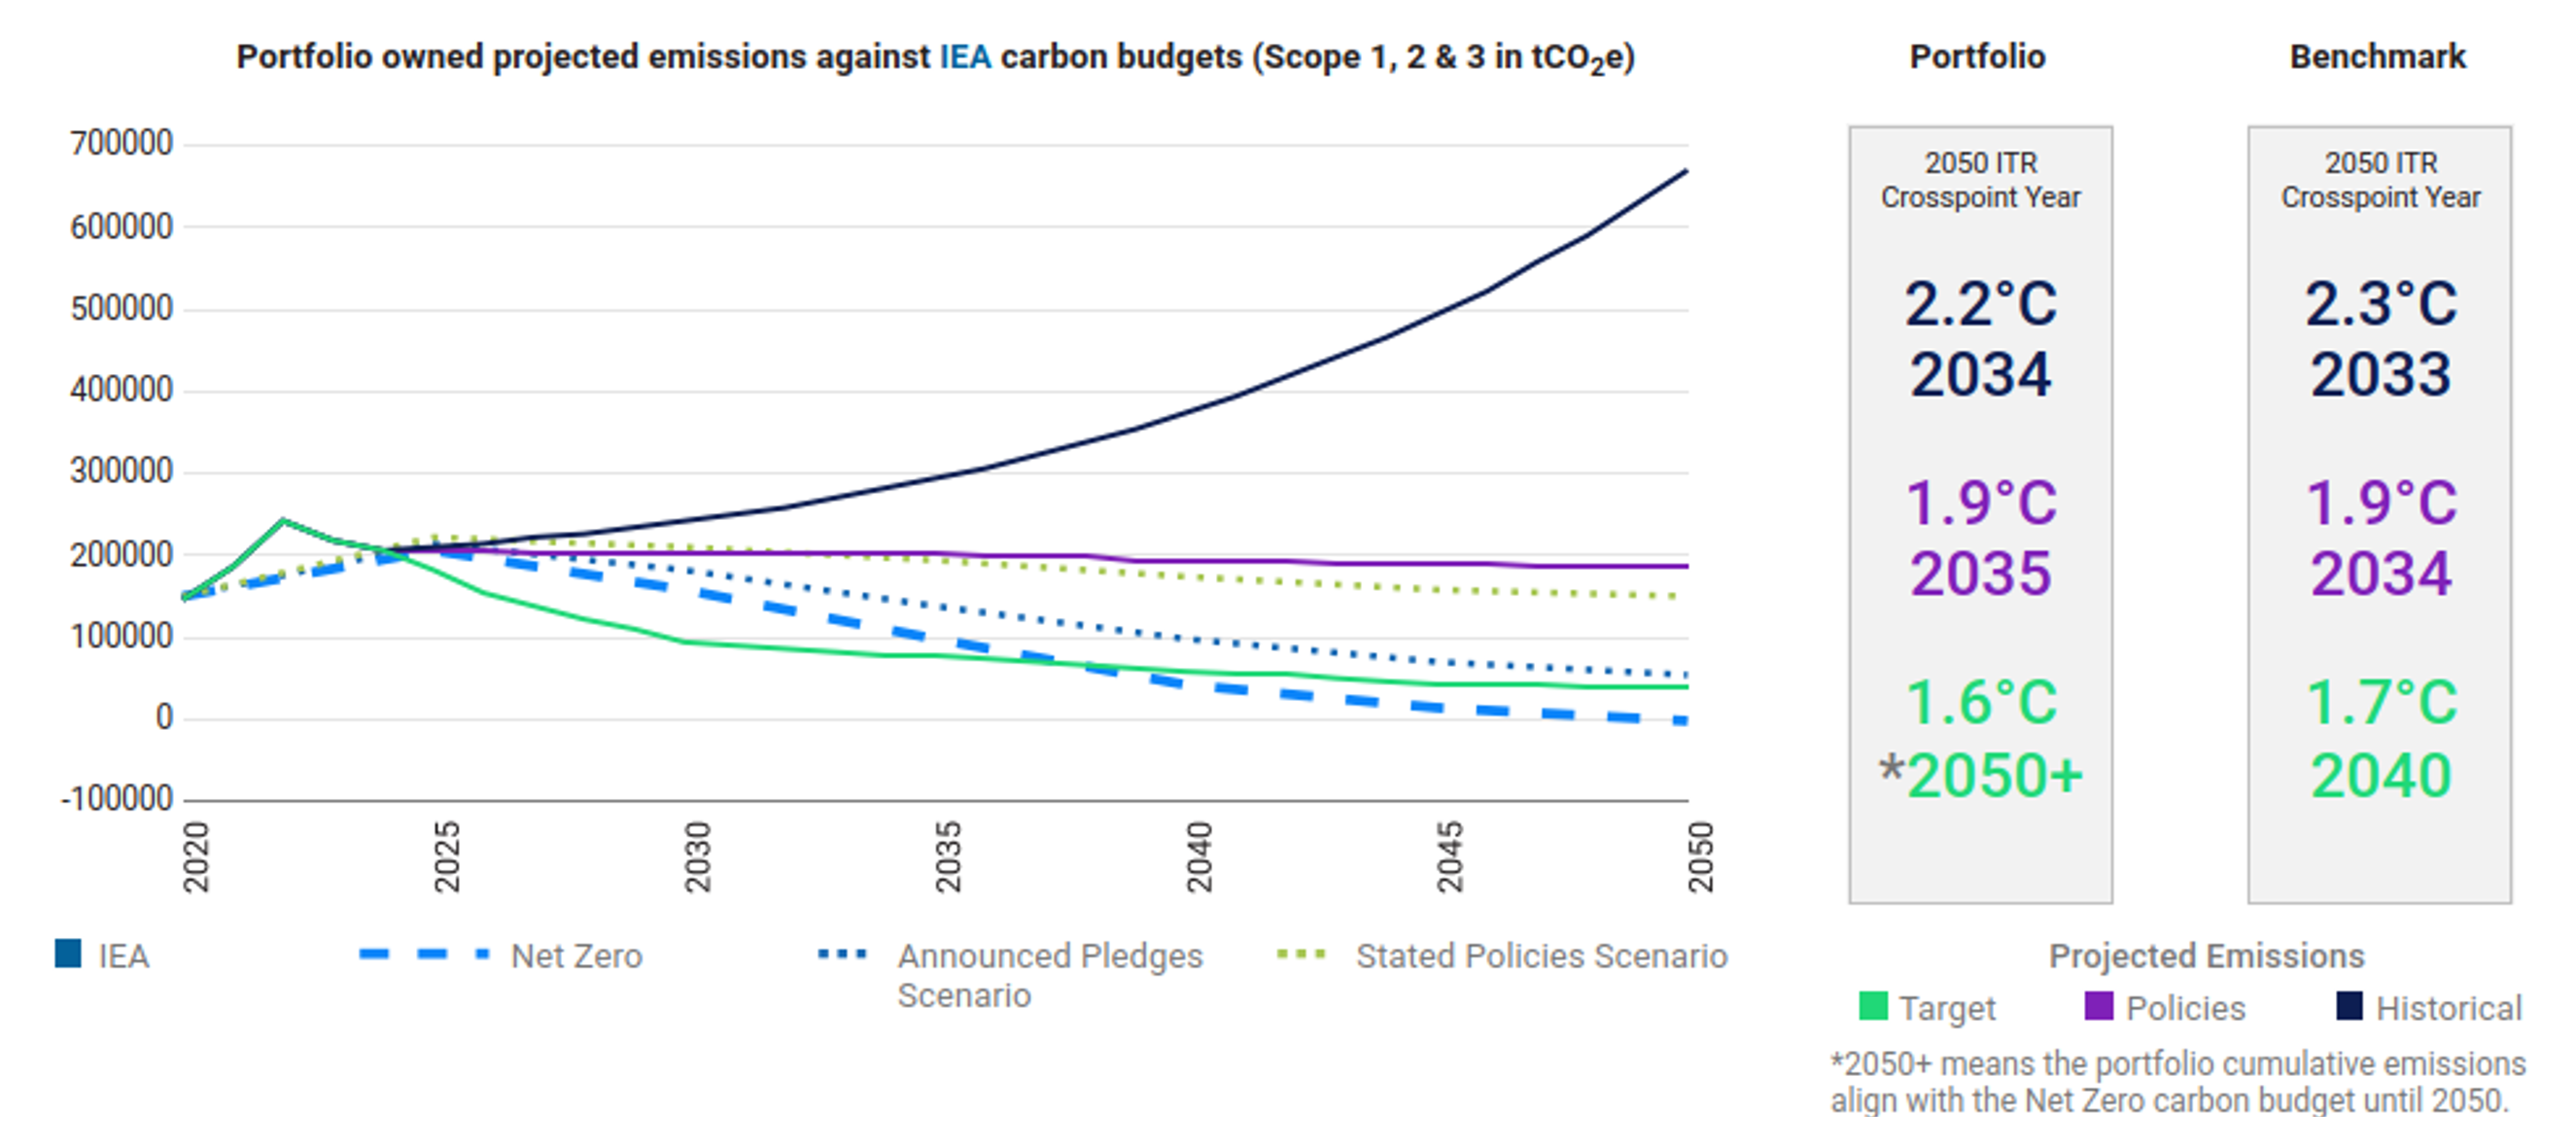
Overall, the results are positive. The portfolio outperforms the benchmark both under the target‑based trajectory and under the historical trajectory, indicating greater forward‑looking climate resilience.
The Target Projection shows that, if all companies in the portfolio were to fully achieve their stated emissions‑reduction commitments, the portfolio’s emissions pathway would be consistent with approximately 1.6°C, therefore broadly aligned with a Net Zero trajectory.
The Historical Projection, on the other hand, indicates that the actual pace of emissions reduction achieved to date is not yet sufficient: if historical trends were maintained, the portfolio would follow a pathway of around 2°C, highlighting the need for an acceleration in decarbonisation efforts.
The Policies Projection provides an intermediate outcome (around 1.9°C). By reflecting the impact of currently implemented climate policies, it shows that regulatory and sector‑level drivers already in place would improve the trajectory relative to history, suggesting that achieving corporate targets is ambitious but feasible.
In addition, when analysing issuer targets, Etica continues to invest in a larger share of companies with climate commitments compared to the benchmark.
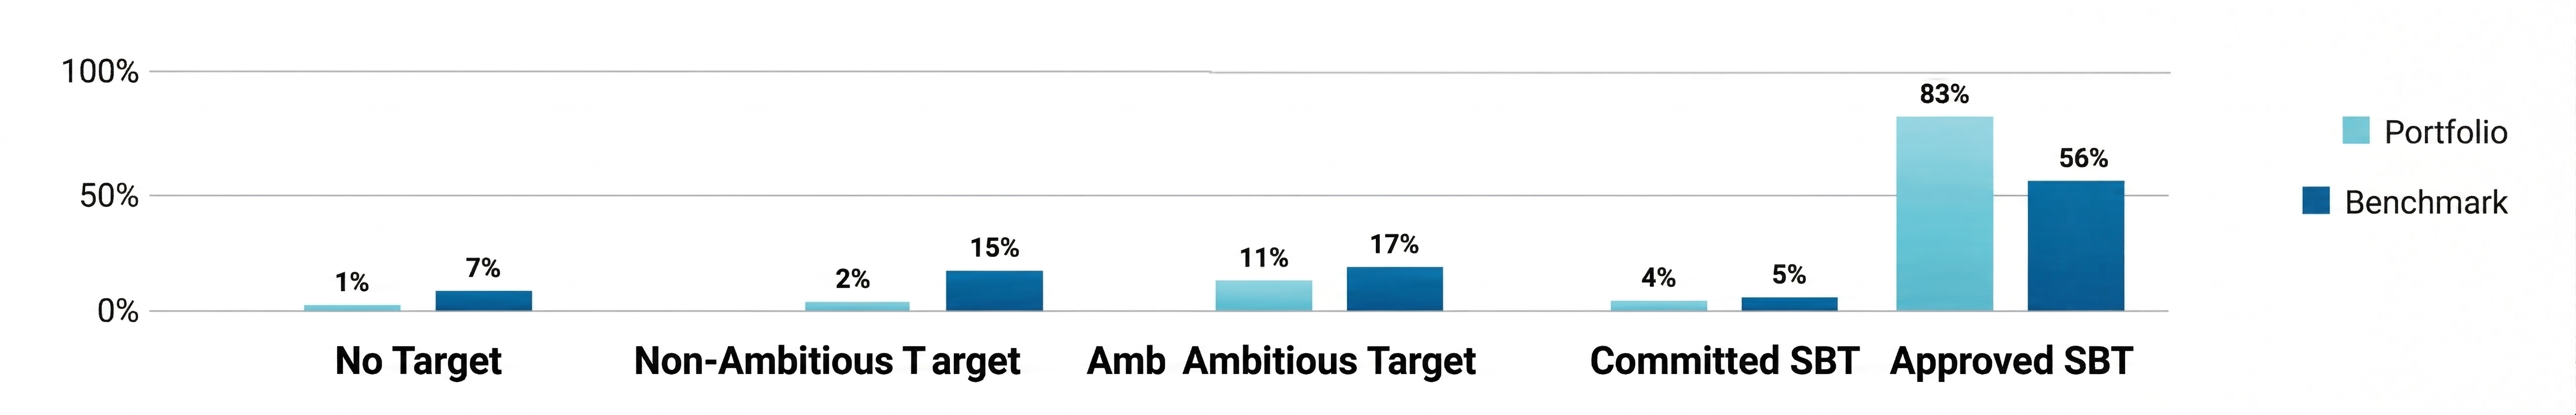
As of 31 December 2025, according to ISS, 98% of the portfolio’s value is either committed to or has already set a climate target, compared with 78% for the benchmark. Specifically, 83% of the portfolio’s value (up from 71% in the last TCFD report) has already set a greenhouse gas reduction target approved by the Science‑Based Targets initiative (SBTi), compared with 56% of the benchmark. Notably, only 3% of the portfolio companies have no target or have set a target considered unambitious in terms of greenhouse gas emissions.
Physical risk analysis
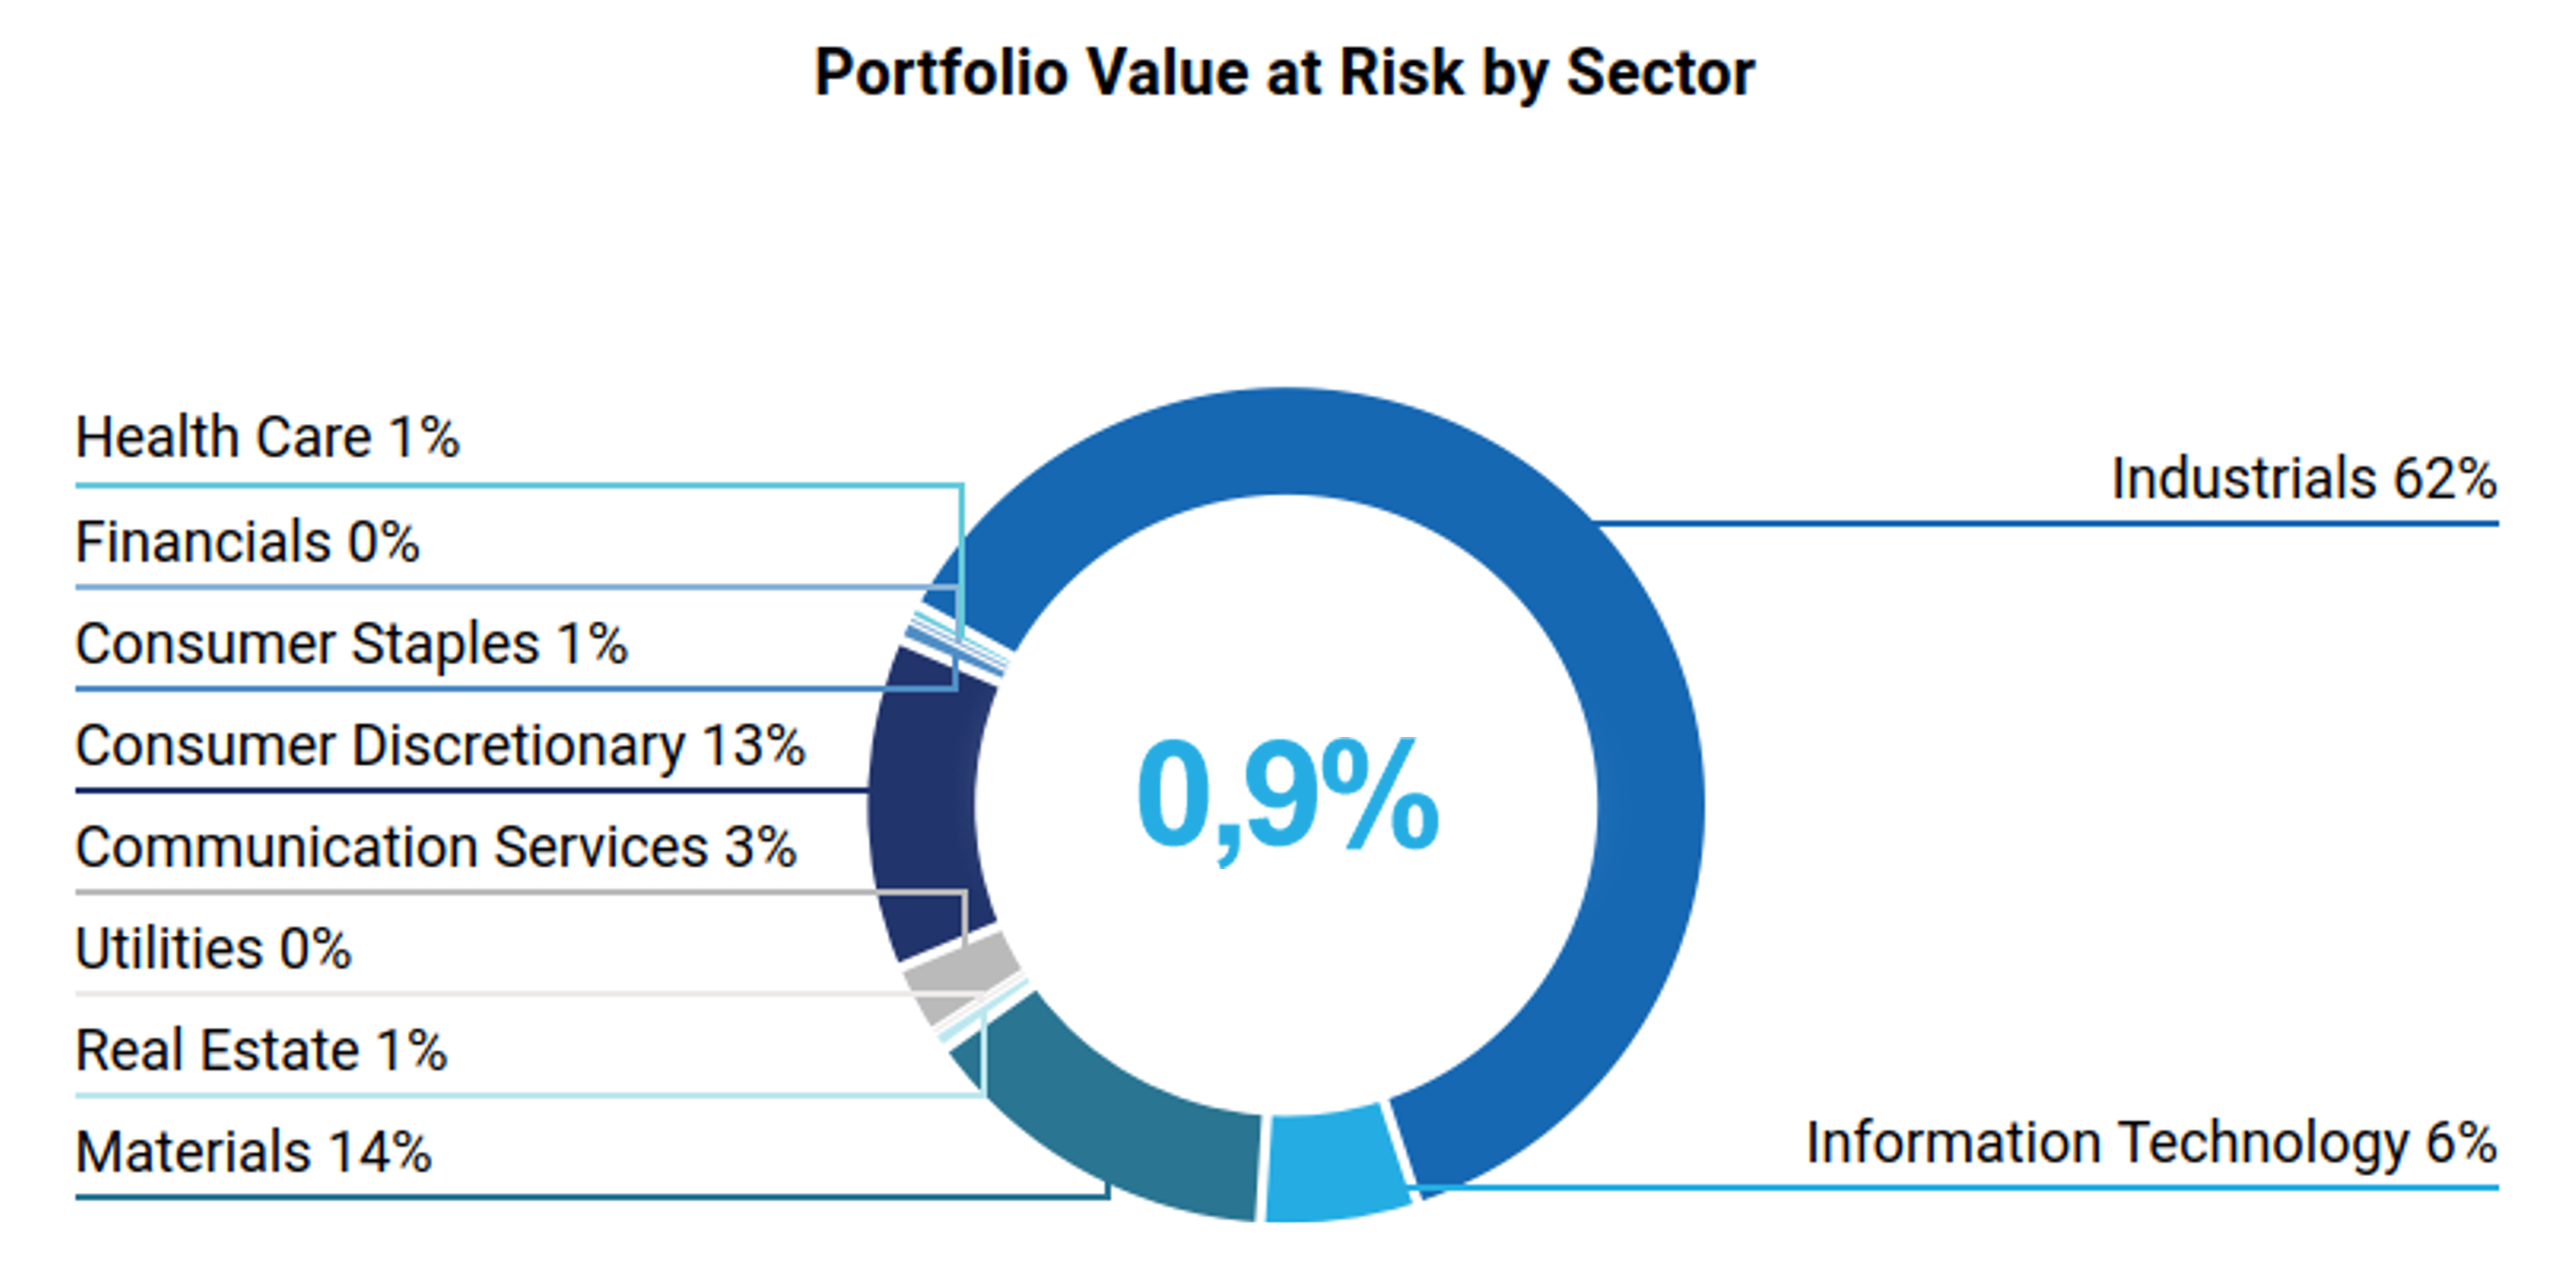
ISS uses a proprietary model to estimate the potential value losses for issuers arising from physical climate risks, calculating the Value at Risk (VaR) expected by 2050. The model assesses the financial impact of the main channels through which physical risks can affect share prices: changes in the value of fixed capital (PP&E), repair costs following extreme weather events requiring additional CAPEX, increases in operating costs linked to changes in SG&A or COGS, and revenue impacts due to production disruptions or reductions.
The analysis is based on the climate scenarios used in the IPCC Fifth Assessment Report (AR5) [5]. The primary reference scenario is RCP 4.5, which corresponds to an expected temperature increase between 1.7°C and 3.2°C by 2100.
Under this scenario, the portfolio’s VaR to 2050 is estimated at approximately €3.2 million, with Consumer Discretionary, Communication Services and Information Technology being the most exposed sectors. The overall impact remains below 1% of the total portfolio value, consistent with the results of the 2025 analysis.
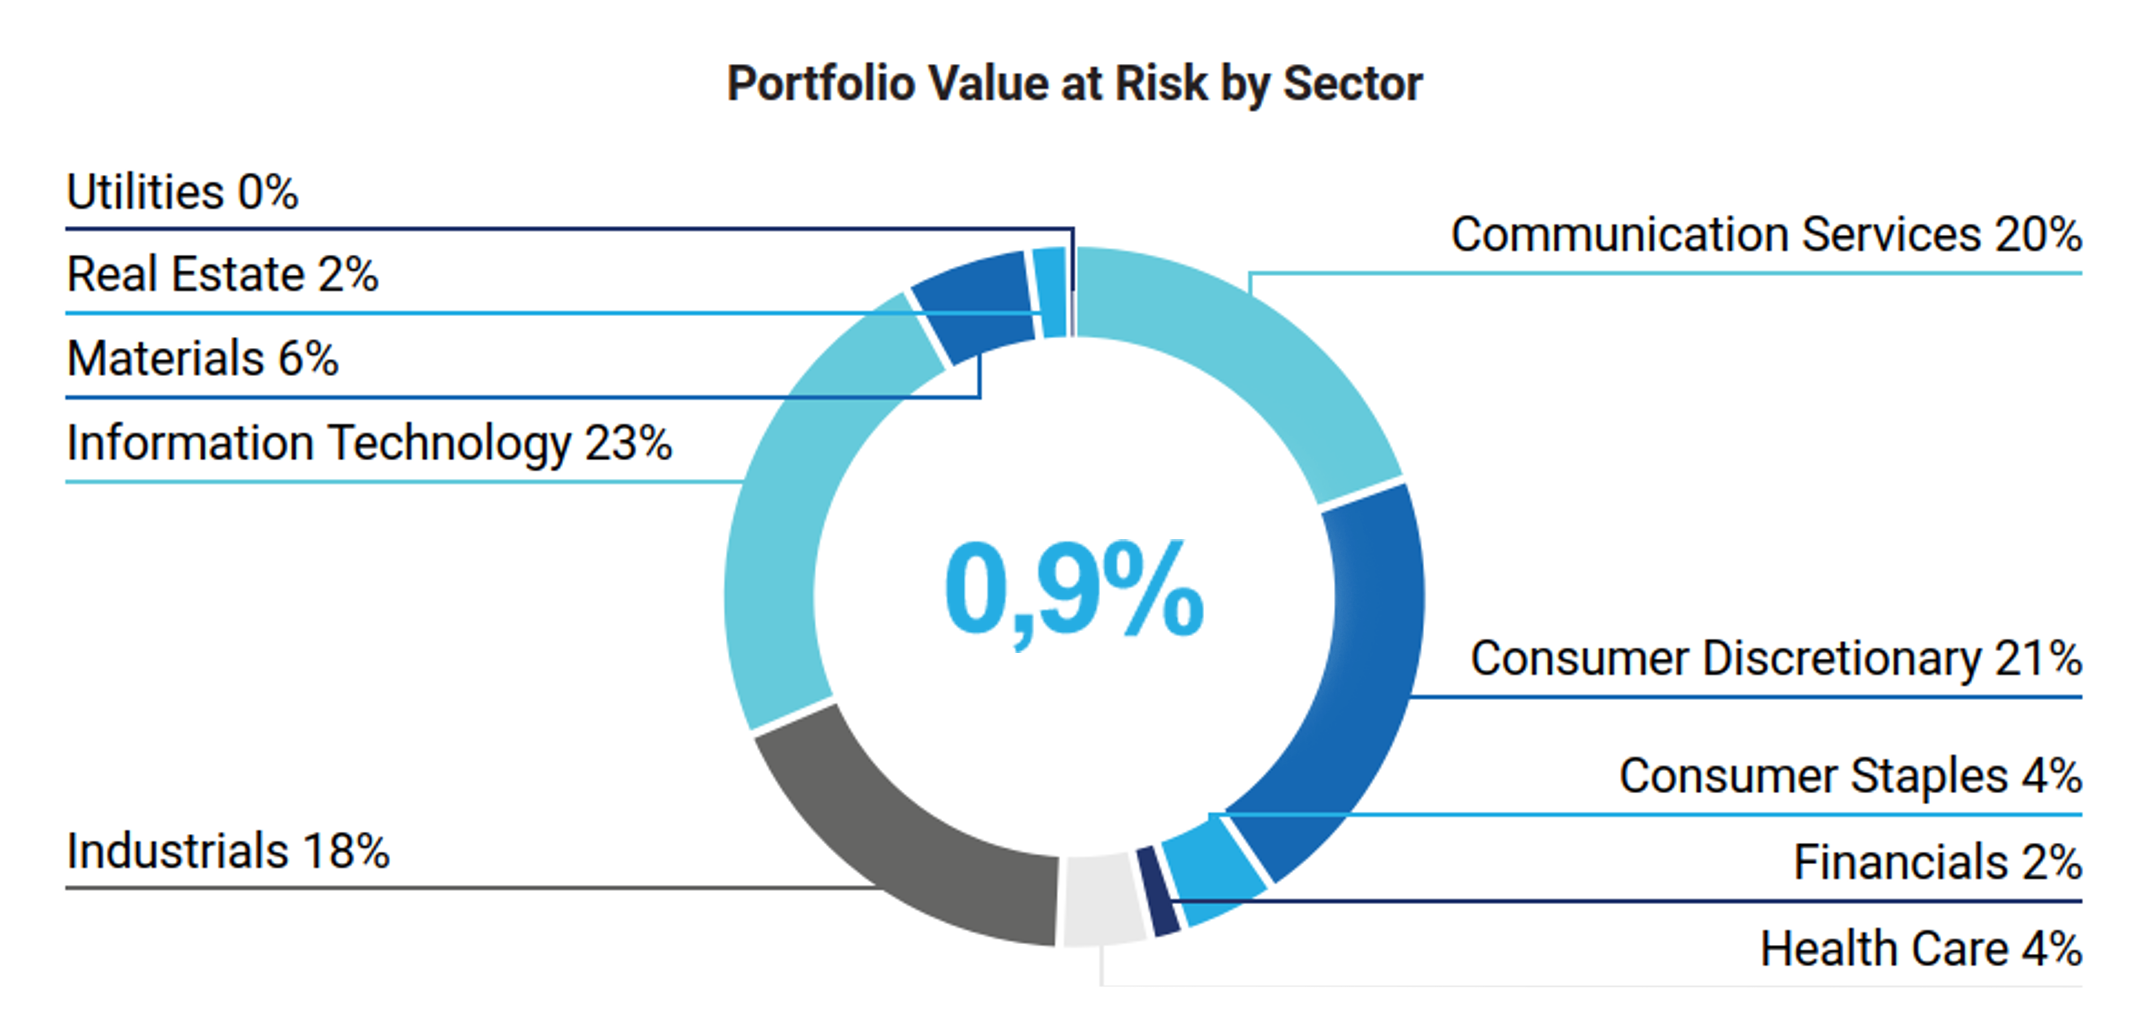
Under a more severe scenario – corresponding to warming above 3.2°C – the VaR increases to around €4.82 million. This confirms that worsening climate conditions lead to proportionally higher potential losses, while still remaining within a manageable magnitude (around 1% of AUM) relative to the total portfolio value.
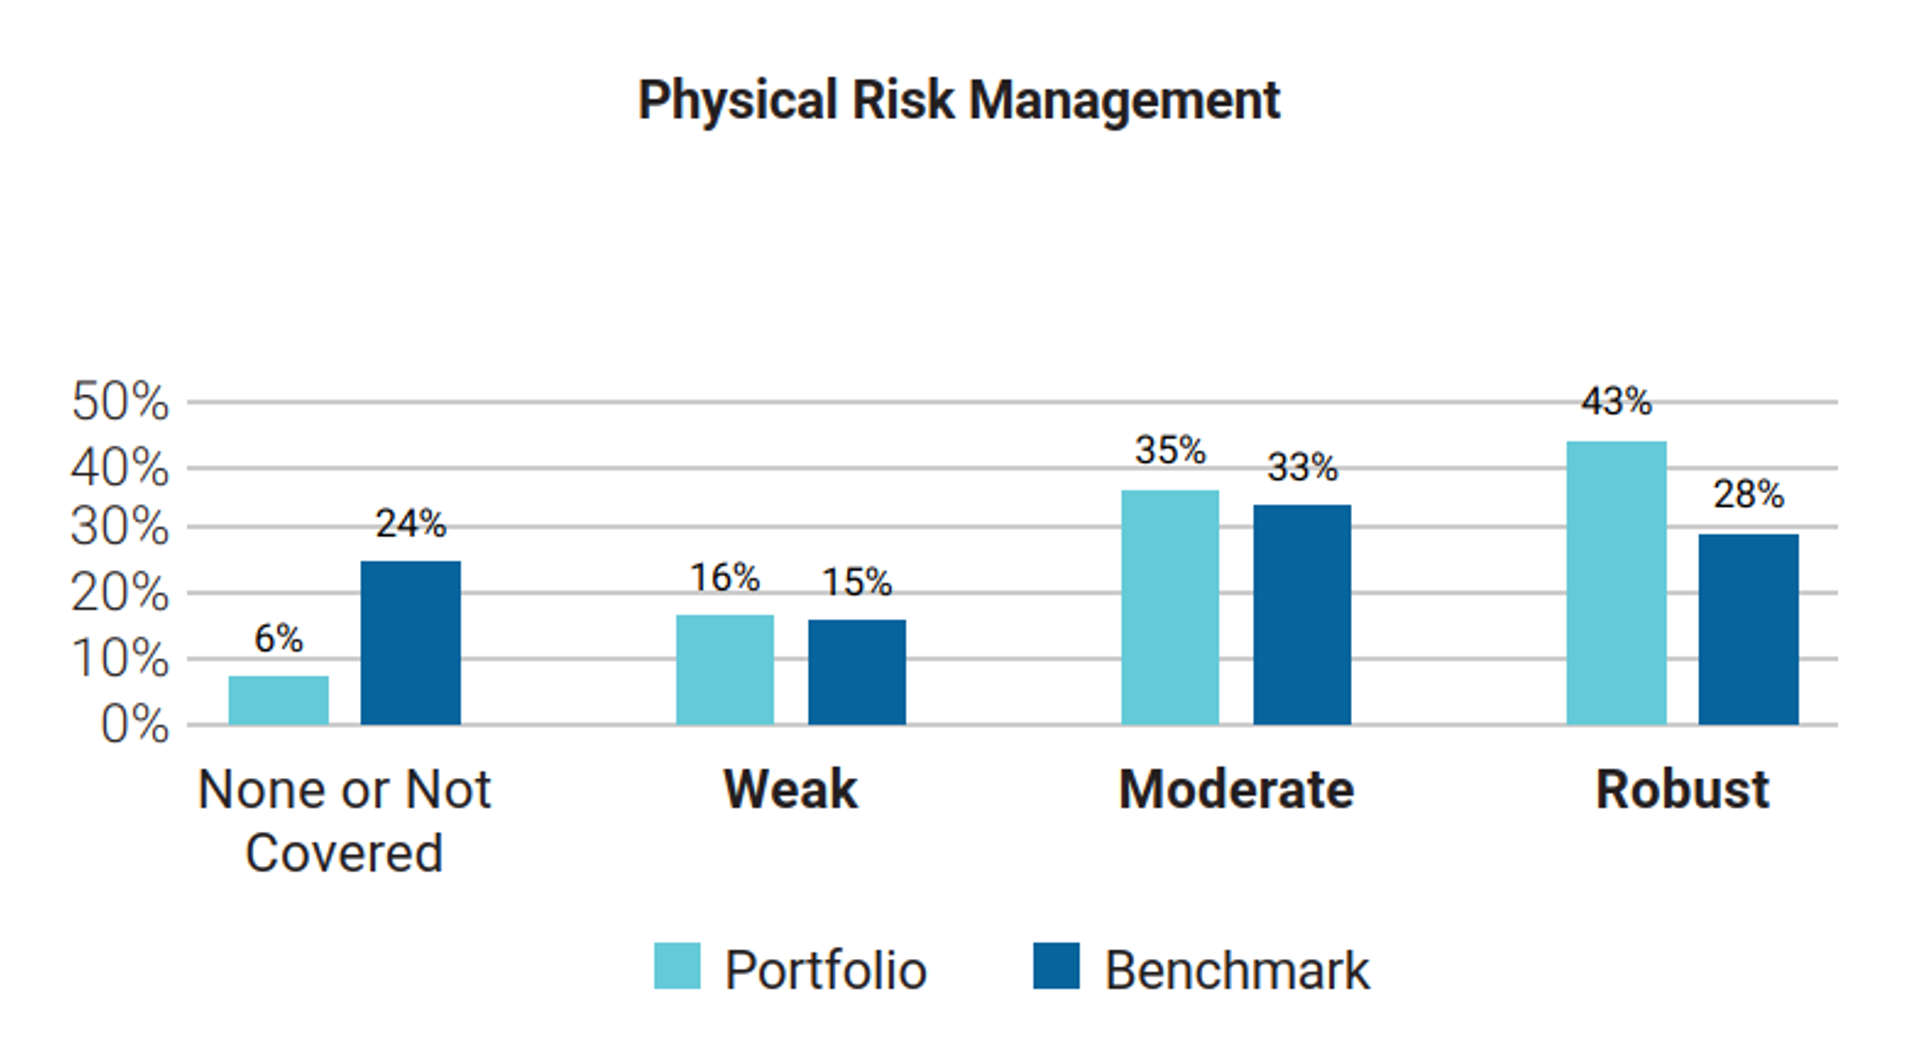
Furthermore, according to ISS’s assessment, only 16% of the issuers in the portfolio have a weak physical‑risk management strategy, while the large majority – around 78% – has a moderate or robust approach to managing physical climate risks.
The analysis also highlights better data coverage for the portfolio compared to the benchmark: only 6% of Etica’s holdings lack sufficient disclosure for a physical‑risk evaluation, versus 24% in the benchmark. This indicates higher quality and completeness of information for the portfolio companies, a crucial factor for reliably assessing long‑term resilience to physical risks.
Transitional Risk Analysis
ISS has developed a model that estimates the Transition Value at Risk (TVaR) of portfolios based on the International Energy Agency’s (IEA) Net Zero by 2050 scenario.
For Etica Transizione Climatica, the potential exposure is very limited: the estimated TVaR is approximately €4 million, corresponding to less than 1% of the total analysed value. This result is consistent with the findings of the June 2025 analysis and confirms the portfolio’s structurally low exposure to transition risk.
This year’s edition also incorporates Scope 3 emissions, which is reflected in the sector‑level results. The highest exposure to Scope 3 relates to the Industrials sector, which is also the sector with the greatest transition‑risk exposure according to ISS’s methodology. The Materials sector follows, as expected, since it is also the sector where the portfolio shows the highest exposure to Scope 1 and 2 emissions.
Despite this, the share of AUM potentially exposed to transition risk remains very limited.
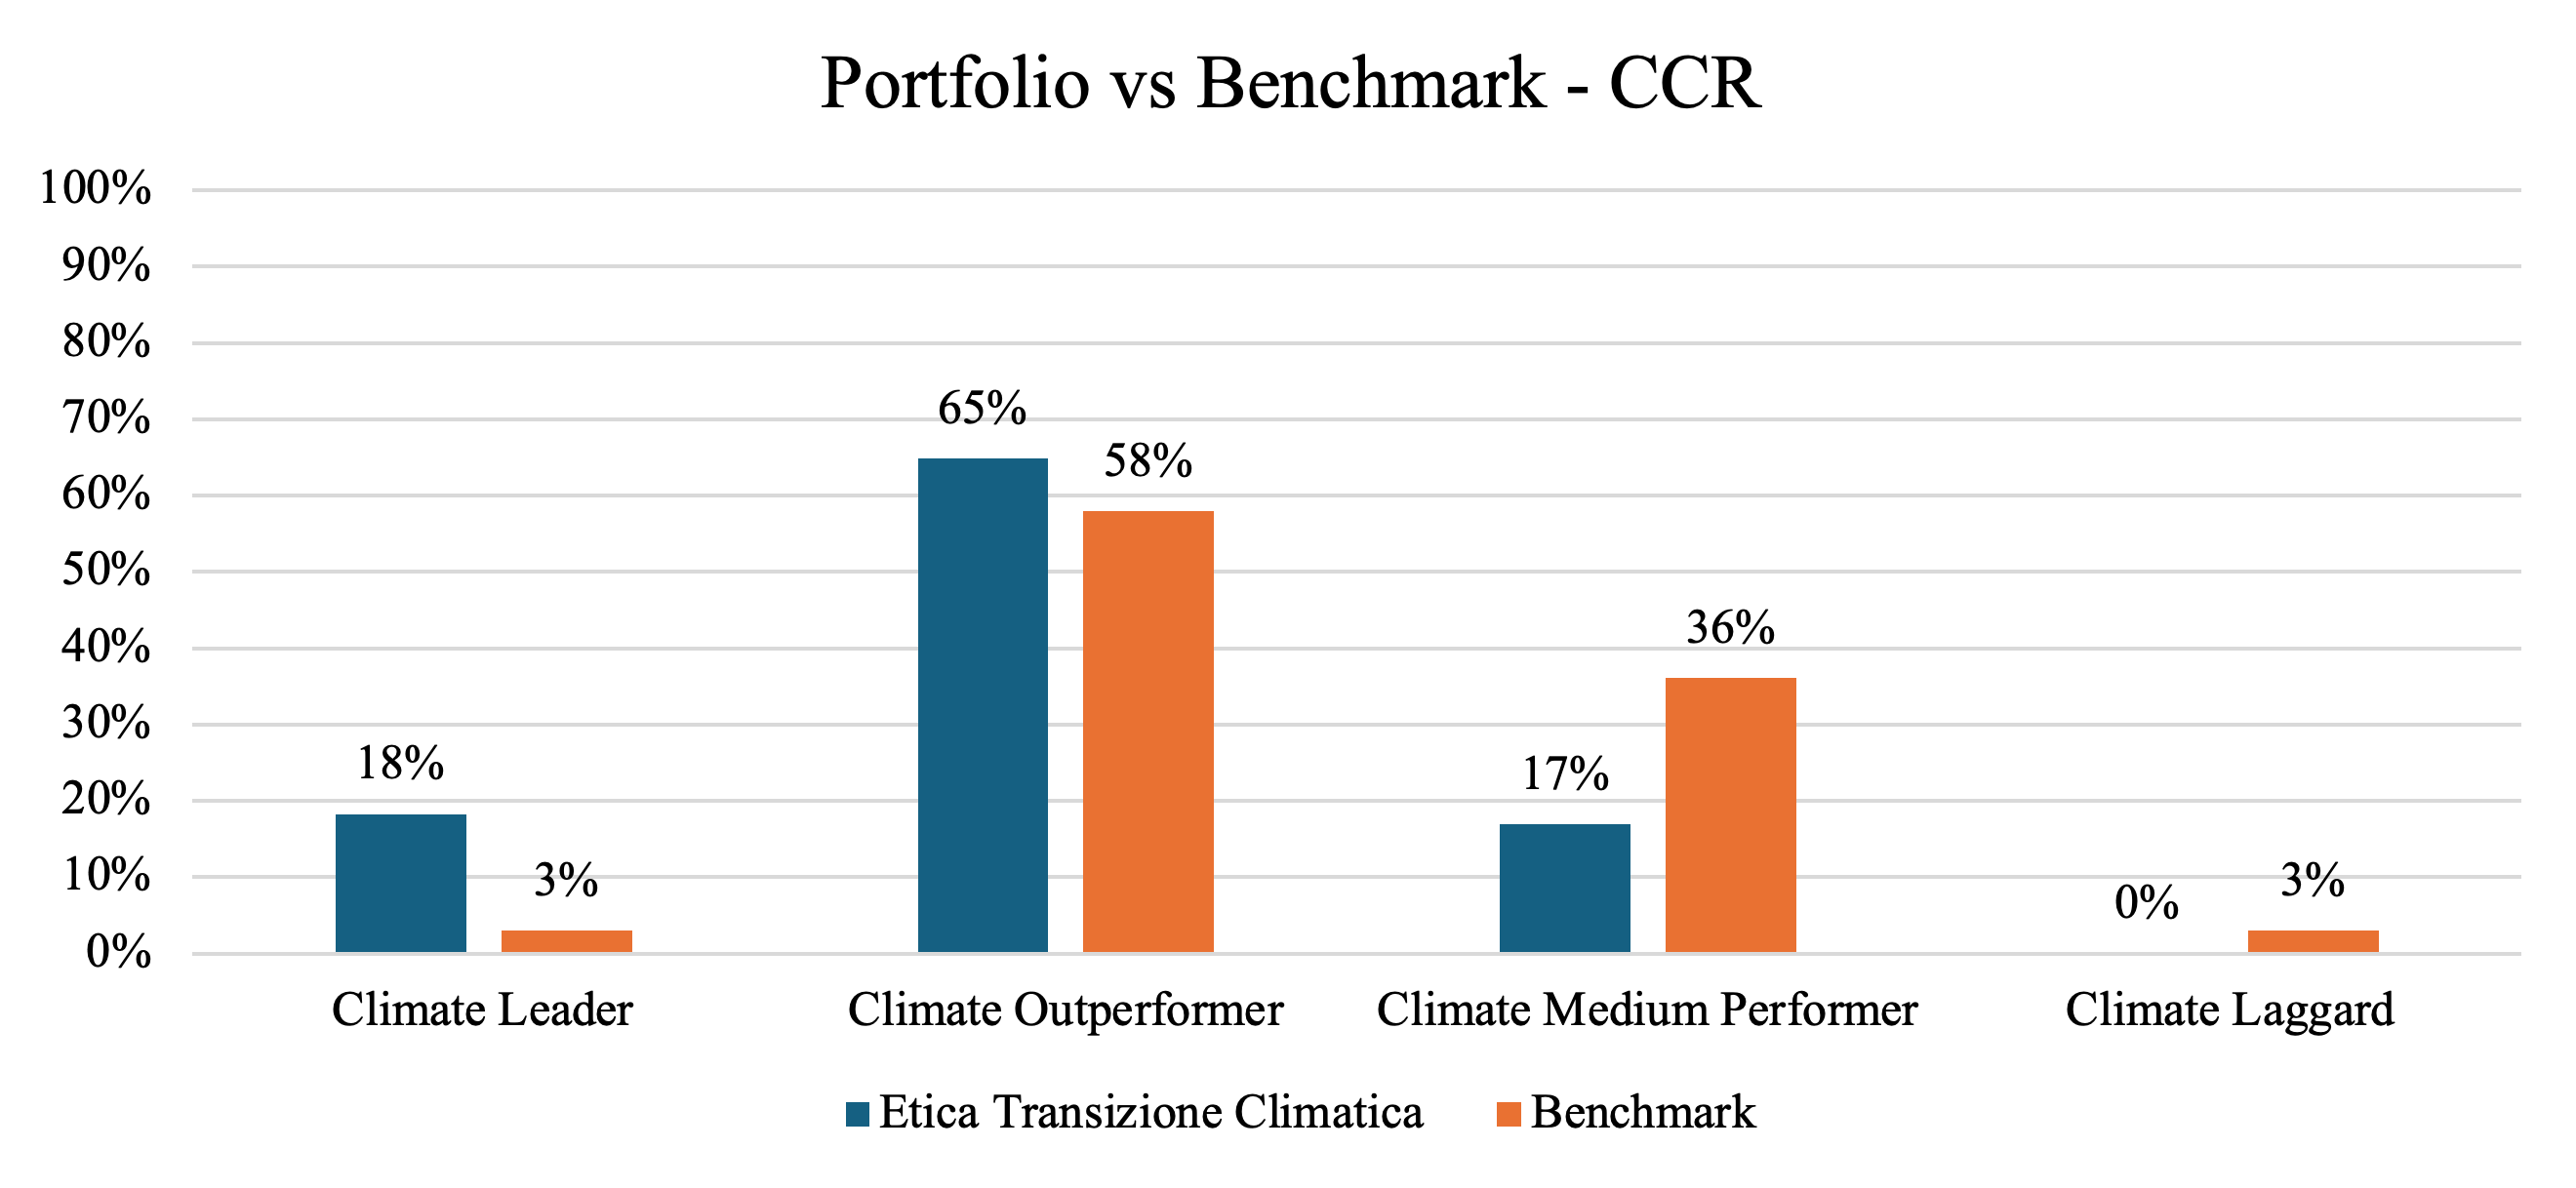
From a Carbon Risk Rating perspective – an ISS metric that summarises each issuer’s ability to manage climate‑related risks and capture opportunities – companies in both the Industrials and Materials sectors exhibit overall solid performance, with no issuers classified as Laggard.
When comparing the overall portfolio with the benchmark, the analysis shows that issuers held in the portfolio demonstrate a stronger capacity to manage transition risks and seize climate‑related opportunities.
ISS’s transition‑risk analysis also examines the power generation mix of the companies held in the portfolio. Etica Transizione Climatica includes seven issuers involved in electricity generation. Among them, two belong to non‑utility sectors, but integrate renewable‑energy generation as part of their business model.
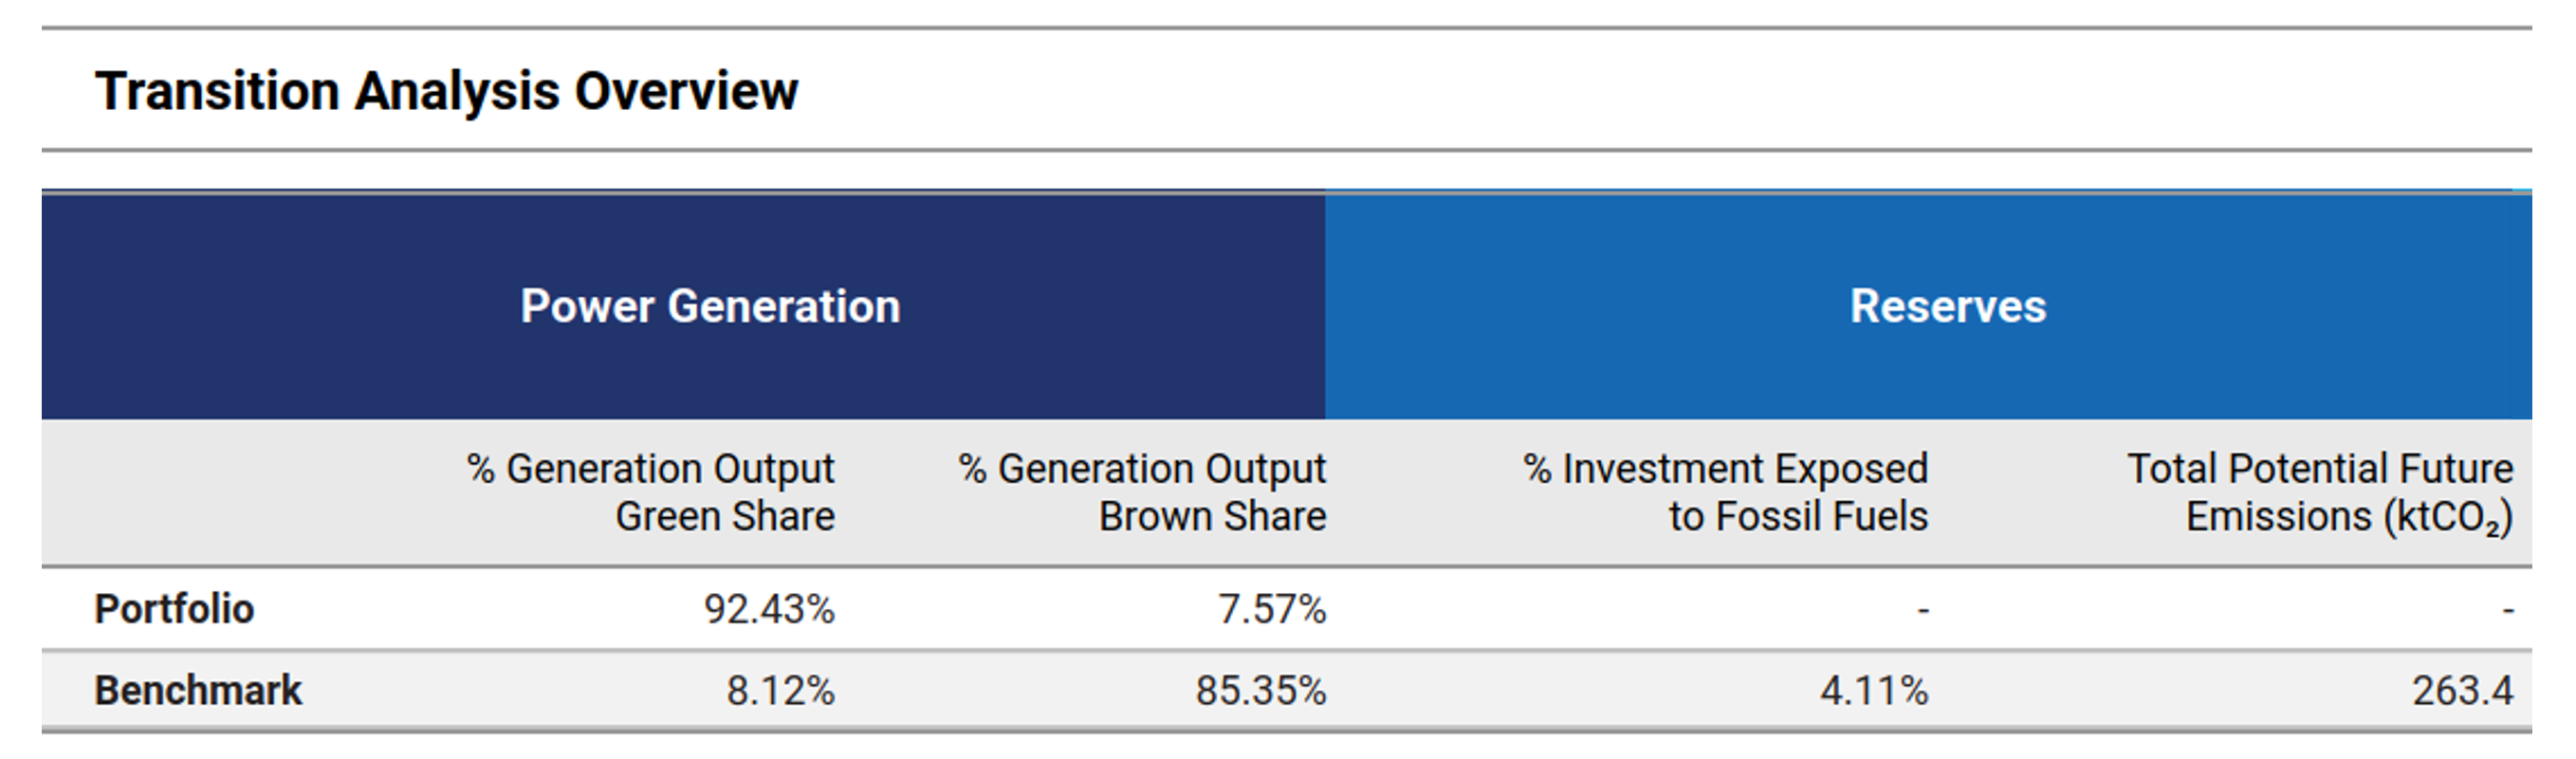
Considering the total installed generation capacity attributable to Etica under the ownership principle, more than 92% of financed power generation comes from renewable sources, while only 7.57% is derived from thermal generation. This improvement relative to the June analysis is driven by two factors: on the one hand, some issuers have increased their renewable‑energy output; on the other, changes in portfolio weights have favoured companies more engaged in clean‑energy generation.
The portfolio also shows a markedly stronger positioning compared to the benchmark, which has only about 8% renewable capacity and as much as 85% thermal capacity. This confirms the portfolio’s substantial contribution to the energy‑transition theme.
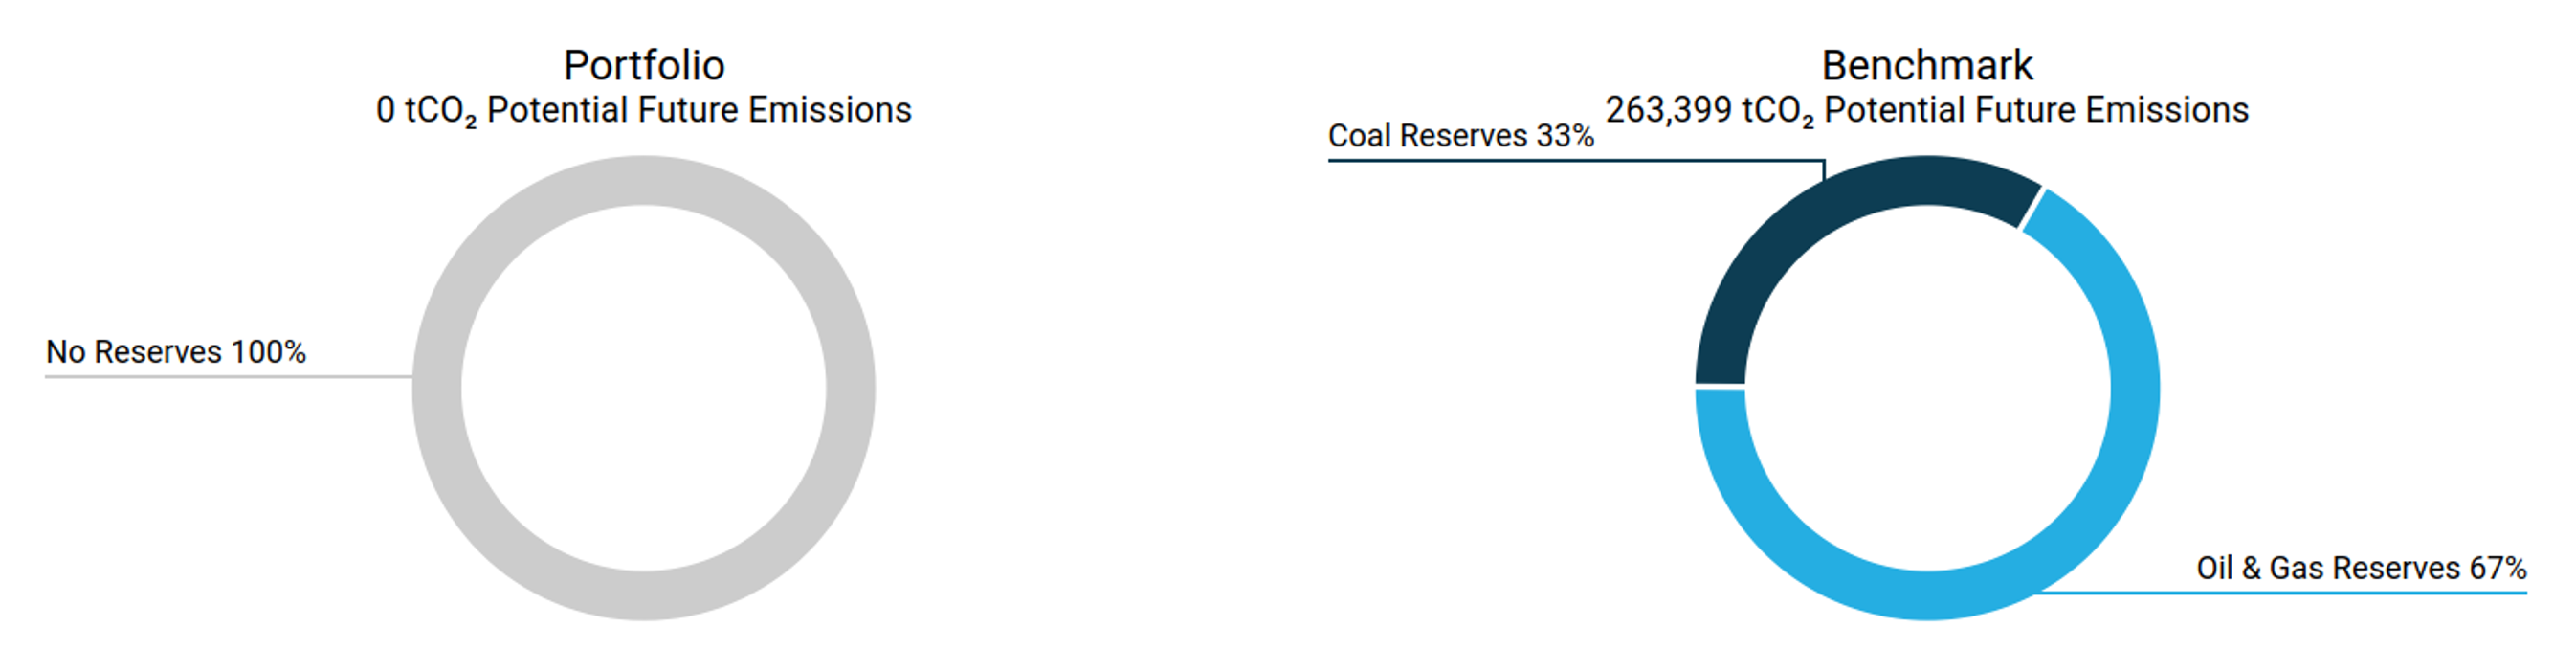
Finally, the portfolio has no direct exposure to unconventional or controversial energy‑extraction activities, such as fracking or Arctic drilling. Likewise, the portfolio does not hold any potential future emissions, as the selected issuers do not own fossil‑fuel reserves. This further contributes to keeping the portfolio’s transition risk structurally very low.
Corporate Green Bonds: use of proceeds analysis
As of 30 December 2025, the Etica Transizione Climatica portfolio included 43 corporate bonds, of which green bonds accounted for 86% of the total number of corporate issues and approximately 85% of the corporate AUM. As a result, the majority of the corporate bonds in the portfolio directly contribute to financing the issuers’ green transition.
Based on data collected by Bloomberg from issuers’ allocation reports, it is possible to identify the categories of projects [6] financed by the green bonds in the portfolio (a single bond may finance multiple categories). The green bonds held by Etica Transizione Climatica support a broad and diversified range of environmental projects that reflect the main pillars of the ecological transition.
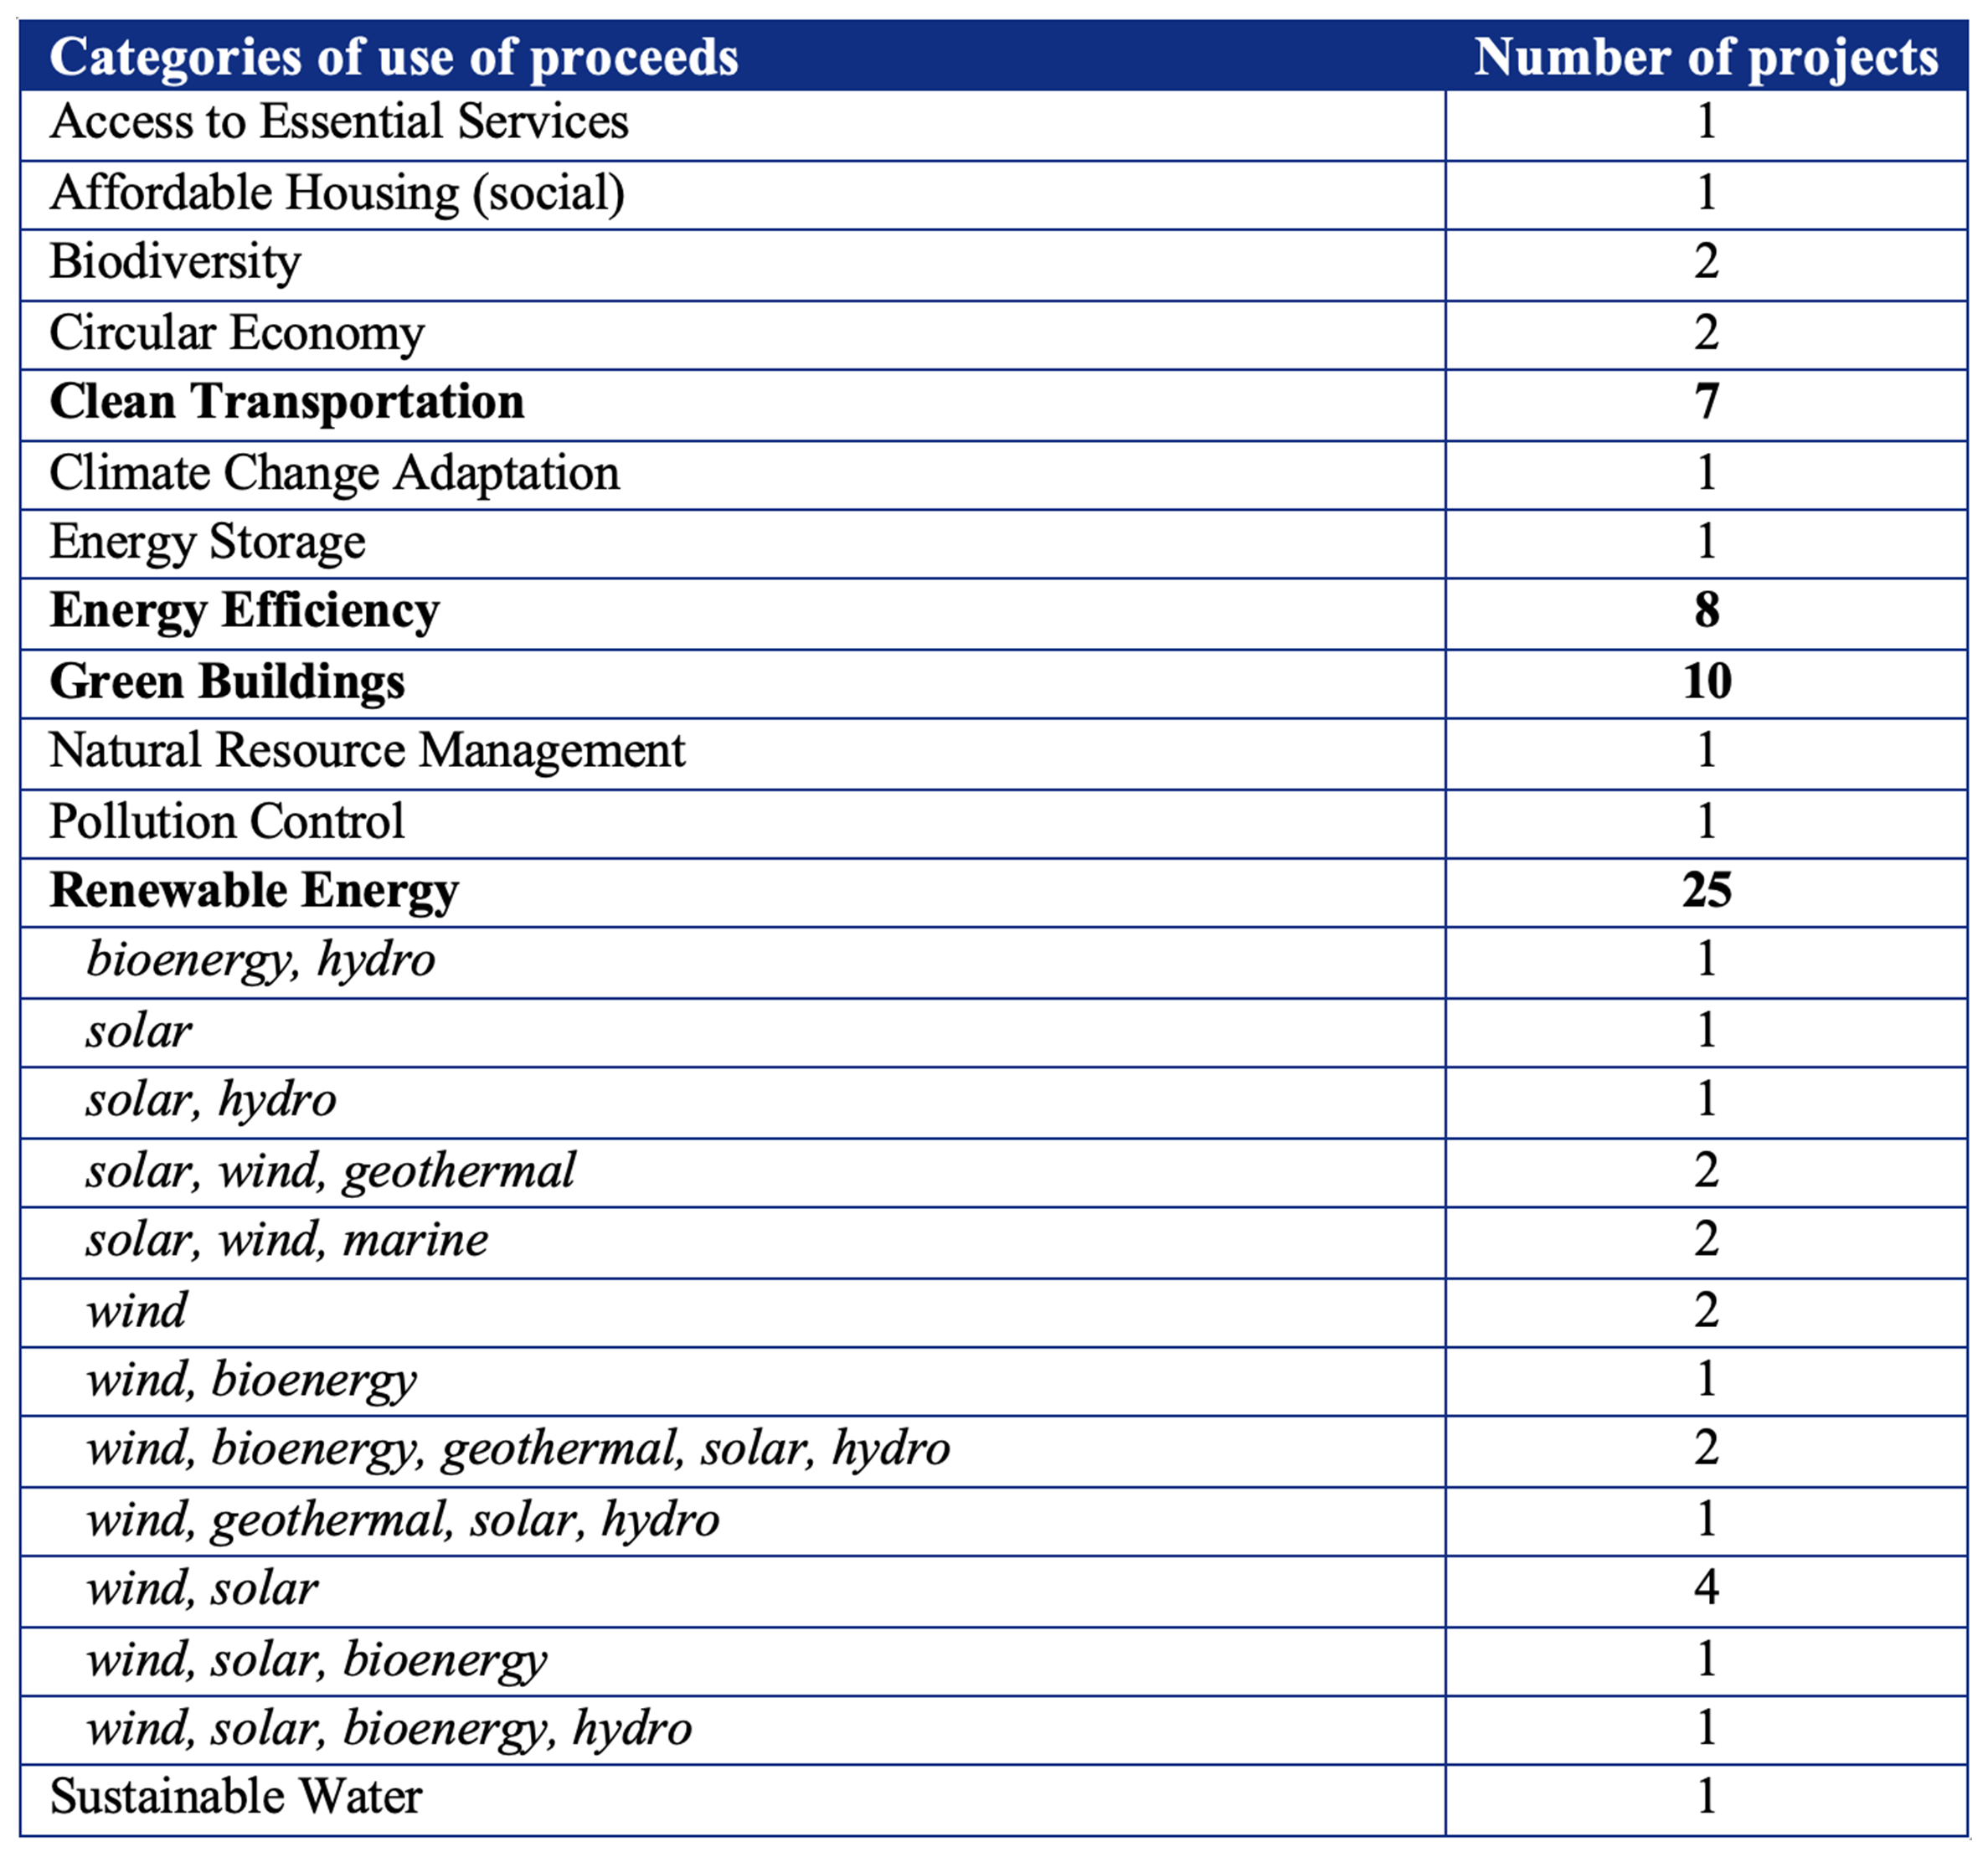
The largest category is Renewable Energy, with 25 projects of clean‑energy generation through various technologies, including solar, wind, hydro, bioenergy and geothermal. This strong focus is fully aligned with the fund’s mission: renewable‑energy deployment is one of the fundamental levers for reducing global emissions and enabling the shift toward low‑carbon energy systems.
Another highly represented category is Green Buildings, with 10 projects related to the construction or refurbishment of high‑energy‑efficiency buildings. This is a particularly critical area, given that the buildings sector accounts for a significant share of global CO₂ emissions. Investing in certified, more efficient and lower‑consumption buildings directly contributes to reducing energy use and operational emissions.
Clean Transportation projects follow (7), supporting sustainable mobility solutions such as electric‑transport infrastructure, low‑emission fleets and urban mobility systems. This category also plays a key role in decarbonisation, as the transport sector remains one of the major sources of global emissions.
Projects related to Energy Efficiency (8) further complement the portfolio’s impact profile by reducing energy consumption in industrial processes and infrastructures. Minimising energy waste is one of the most effective and immediate strategies to support decarbonisation, as it reduces emissions without requiring additional energy‑generation capacity.
Overall, the distribution of project categories demonstrates a portfolio strongly oriented toward high‑impact climate‑positive investments, addressing both emissions reduction and enhanced environmental resilience. This approach is fully consistent with the fund’s objectives, contributing meaningfully to the transition of the most emission‑intensive sectors and supporting the deployment of clean technologies that are already mature and readily scalable.
When available, it was also possible to estimate the avoided emissions and the renewable energy produced or installed through the projects financed by the green bonds.
The aggregated results are as follows:
- Avoided emissions: 127.45 million tonnes of CO₂;
- Renewable capacity constructed or rehabilitated: 38.78 GW;
- Renewable energy generated: 490,949.22 GWh.
These metrics are sourced from Bloomberg and reflect what is reported in the individual issuers’ allocation reports. Two types of conversions were required to calculate the final aggregated values:
- Unit conversion
In some cases, energy data were reported using different units (e.g., MWh instead of GWh).
This conversion is straightforward, as it simply involves applying a mathematical factor (1 GWh = 1,000 MWh). - Conversion of annual data into lifetime values
When issuers did not report total lifetime environmental benefits but only annual figures, total values were estimated by multiplying the annual benefit by the duration of the bond, calculated from issuance to maturity.
It is important to note that these metrics represent absolute values for the projects financed through the green bonds. They are not adjusted for the portfolio’s ownership share and do not follow the financed‑emissions methodology. They should therefore be interpreted as a measure of the overall contribution of the issuers’ projects.
In absolute terms, including data on green bonds, the companies in the portfolio generated 214,505.92 GWh of renewable energy in 2025, compared with 22,488.3 GWh of energy from fossil fuels.
Analysis of sovereign emissions
Carbon footprinting is increasingly used to assess climate‑transition risks, but it is important to note that, for sovereign issuers, emissions accounting follows different criteria than those applied to corporates. The sovereign emissions analysis is based on ISS’s dedicated sovereign methodology, which is fully consistent with major international reporting standards – most notably the PCAF Sovereign Accounting Guidelines – and compares the greenhouse‑gas emissions and climate‑related indicators of the countries in the Etica Transizione Climatica portfolio with those in the benchmark.
The tables report both absolute and relative emissions associated with the countries held in the portfolio, together with emissions‑intensity metrics. Production emissions (Scope 1) rely on the most recent available data: 2022 for Annex I countries (UNFCCC) and 2021 for non‑Annex I countries (CAIT). Scope 2 and 3 emissions are based on 2018 OECD data, which remains the last globally harmonised dataset.
To support the interpretation of results, a few essential definitions are provided:
- Production emissions (Scope 1): all territorial emissions generated by the production of goods and services within a country;
- LULUCF emissions: emissions or removals associated with land use, land‑use change and forestry. These are presented separately to provide a more comprehensive picture of each country’s emissions profile;
- Emission Exposure (absolute): the portfolio’s total sovereign emissions exposure, obtained by weighing each country’s emissions by its proportional exposure in the portfolio;
- Relative Emission Exposure: emissions attributed per million euros invested, expressed as Relative Carbon Footprint (RCF) and Weighted Average Carbon Intensity (WACI).
Consistent with the approach applied in the corporate section, sovereign green bonds were excluded from the calculation of financed emissions; the related use‑of‑proceeds analysis is presented separately in the following pages.
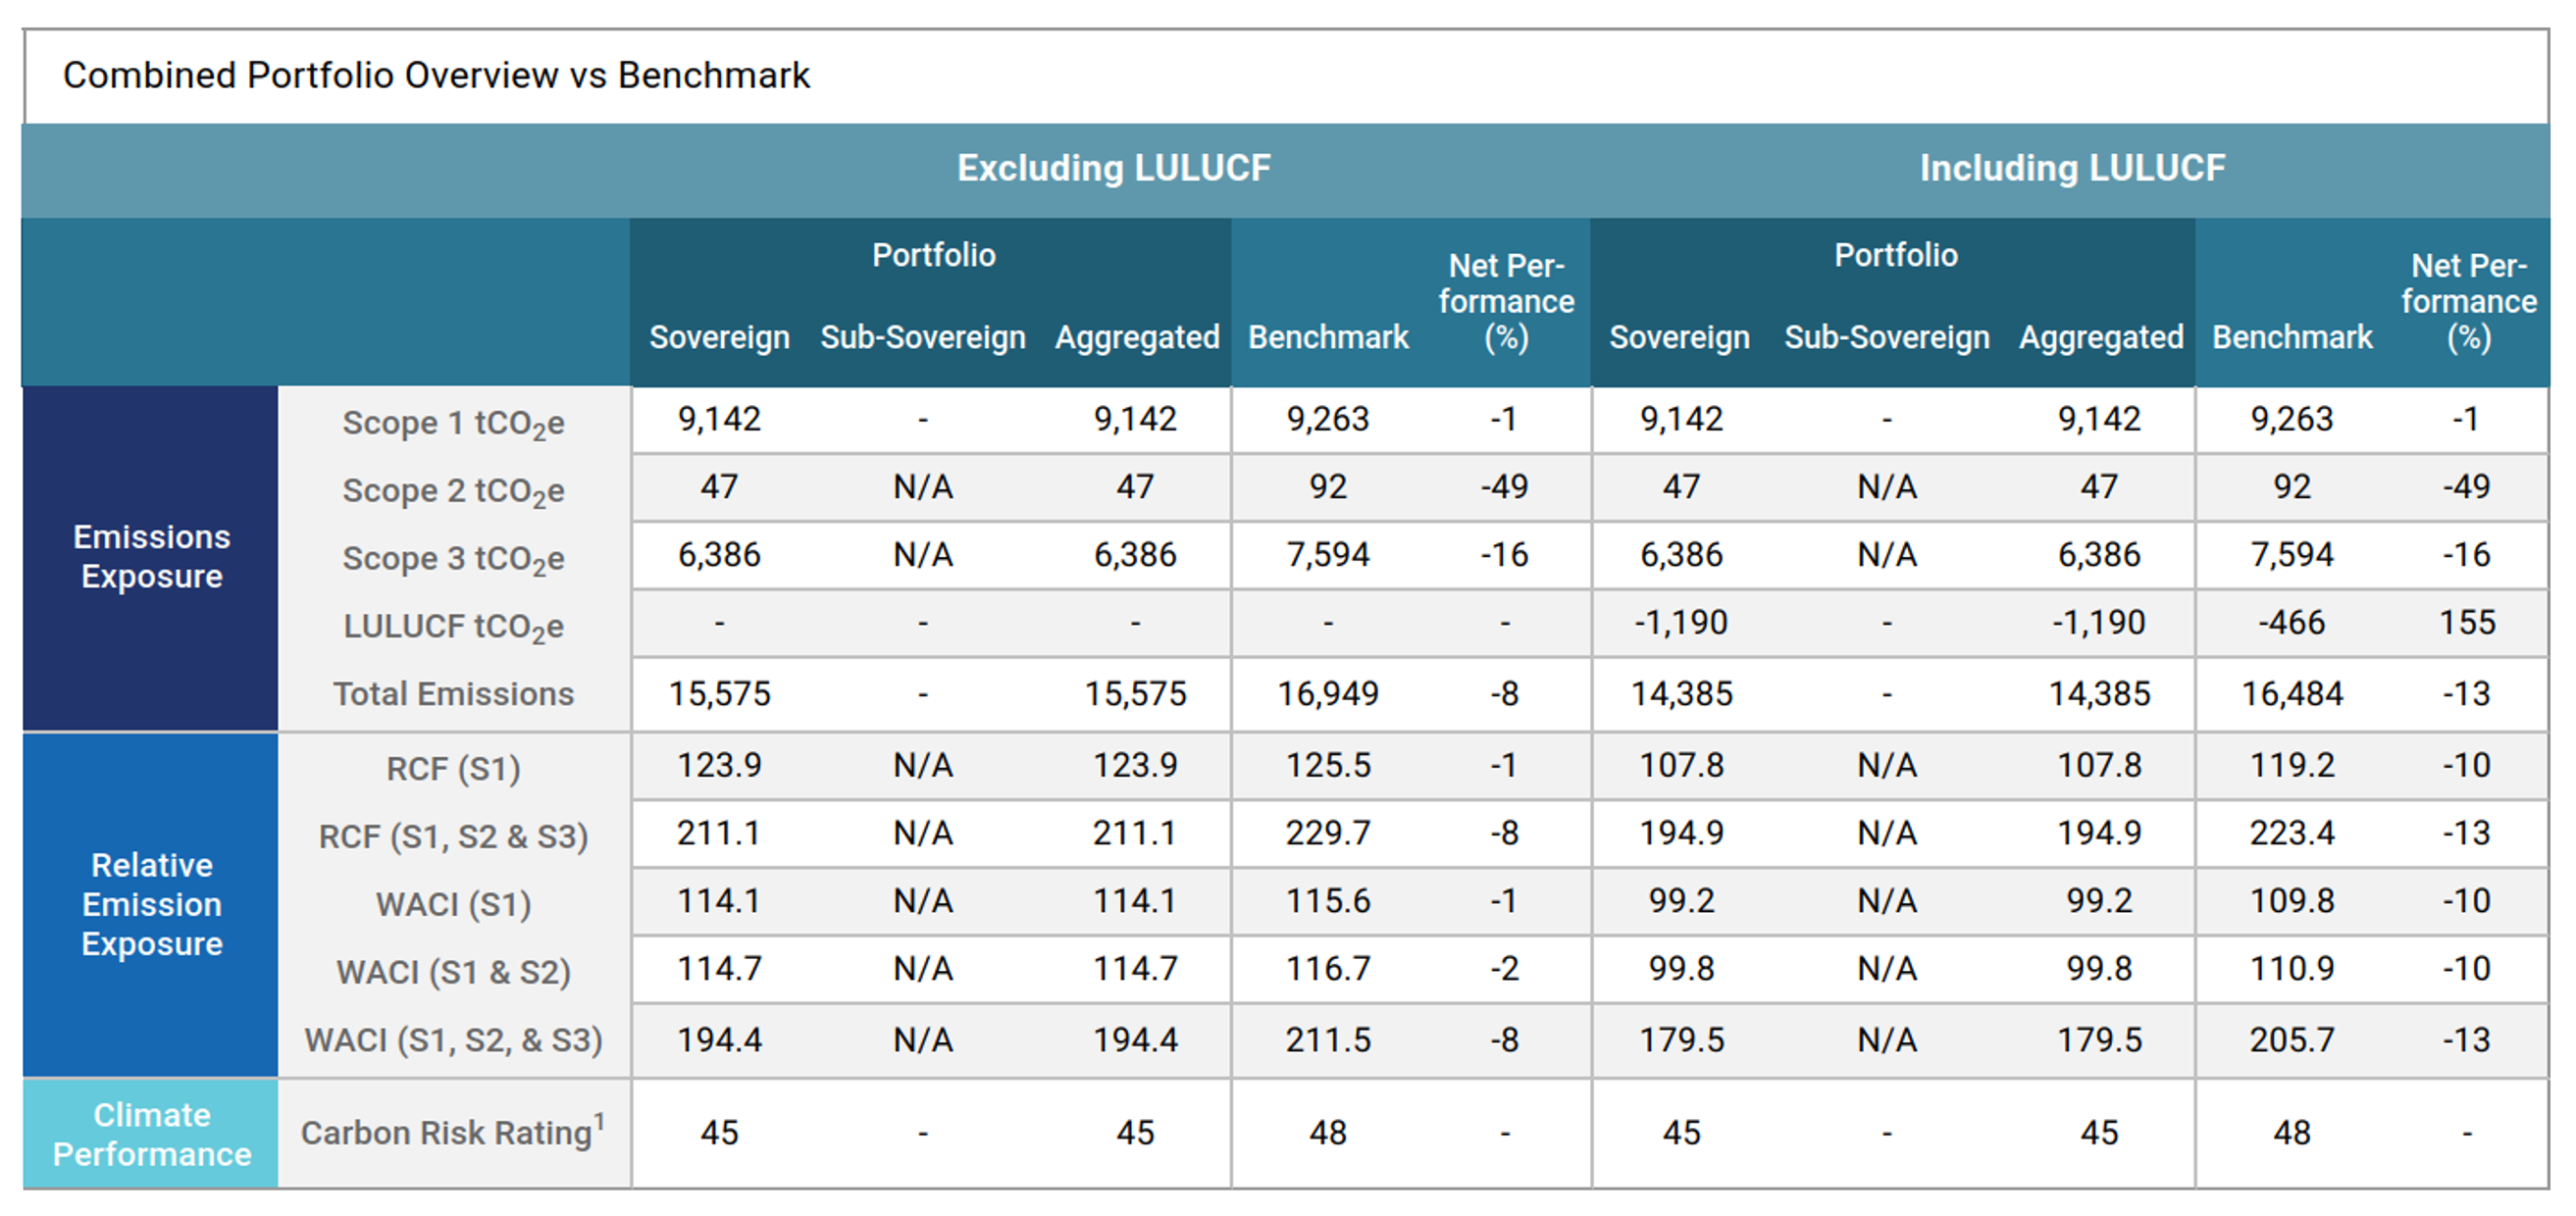
The portfolio’s emissions exposure for production emissions (Scope 1) is broadly aligned with the benchmark, with a difference of only –1%. The inclusion of LULUCF further improves the overall result: the countries in the portfolio exhibit stronger net absorption capacity, resulting in a larger carbon sink relative to the benchmark.
Differences become more pronounced in Scopes 2 and 3, where the portfolio shows significantly lower exposure: -49% in Scope 2 and -16% in Scope 3. This indicates that the portfolio is less exposed both to imported emissions through electricity and heat (Scope 2) and to embedded emissions in imported goods (Scope 3).
On Relative Emission Exposure, the portfolio’s performance is aligned with or better than the benchmark: the RCF is identical for Scope 1 and lower for Scopes 2 and 3. The favourable LULUCF effect further reduces the emissions footprint per million invested.
The same pattern is reflected in the WACI, which measures emissions intensity relative to GDP. The portfolio is broadly aligned with the benchmark for Scopes 1 and 2 but shows stronger performance (–8%) when Scope 3 is included—that is, when emissions related to trade and supply‑chain flows are taken into account. Once again, a more favourable LULUCF contribution reduces the portfolio’s aggregate emissions intensity.
In summary, the portfolio is aligned with the benchmark on Scope 1 production emissions, while exhibiting lower exposure to imported emissions and benefitting from stronger LULUCF absorption capacity, which enhances its overall emissions profile.
It is important to note that the sovereign selection methodology [8] of the fund includes only limited climate‑specific criteria. Therefore, the differences observed relative to the benchmark are mainly attributable to different country weightings within the portfolio.
Sovereign green bonds: use of proceeds analysis
At the end of 2025, the Etica Transizione Climatica portfolio included 24 sovereign bonds, half of which were classified as green bonds. Although they represent only 50% of the sovereign holdings by number, their economic weight is significantly higher: more than 77% of the total sovereign allocation comes from green bonds. This means that the majority of the portfolio’s sovereign exposure contributes directly to the financing of environmental projects with measurable impacts.
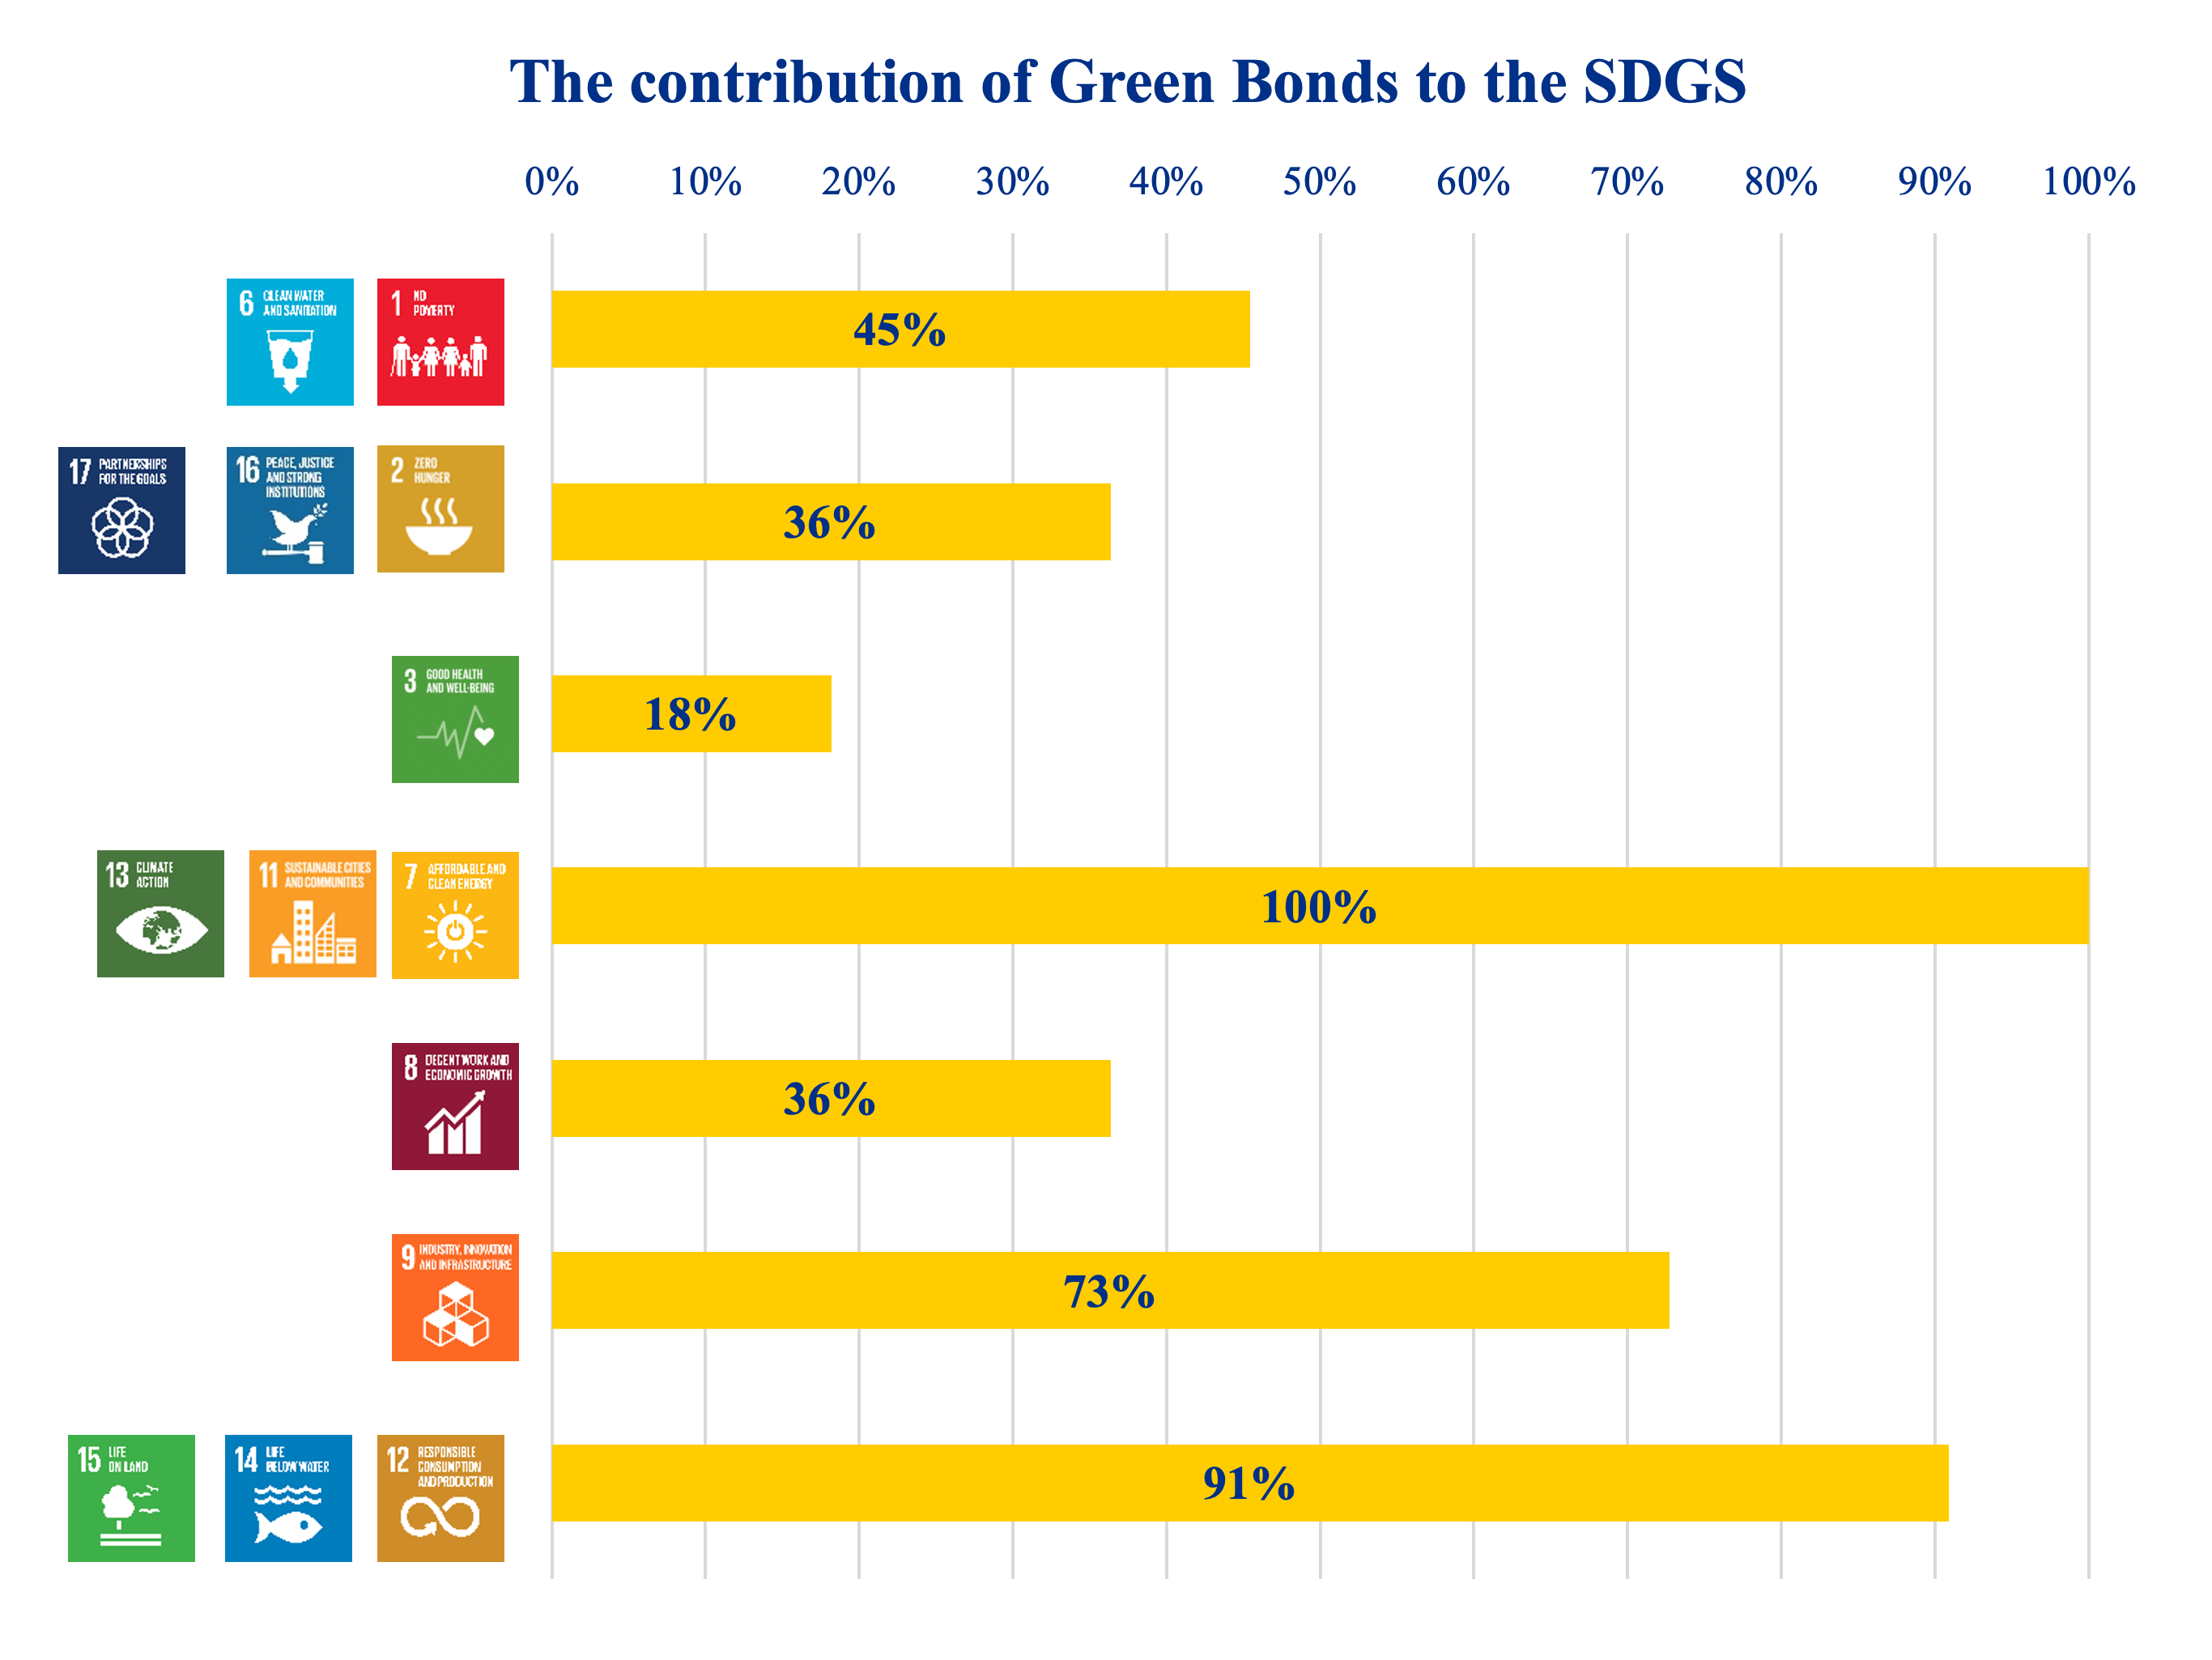
The analysis of use‑of‑proceeds, based on allocation data disclosed by sovereign issuers and categorised according to the Sustainable Development Goals (SDGs) [9], shows a strong concentration of investments in key areas for the ecological transition.
It is worth noting that the percentages shown refer to 100% of the green bonds held in the portfolio.
The table below sets out the various project categories [10] financed by the green bonds in the portfolio.
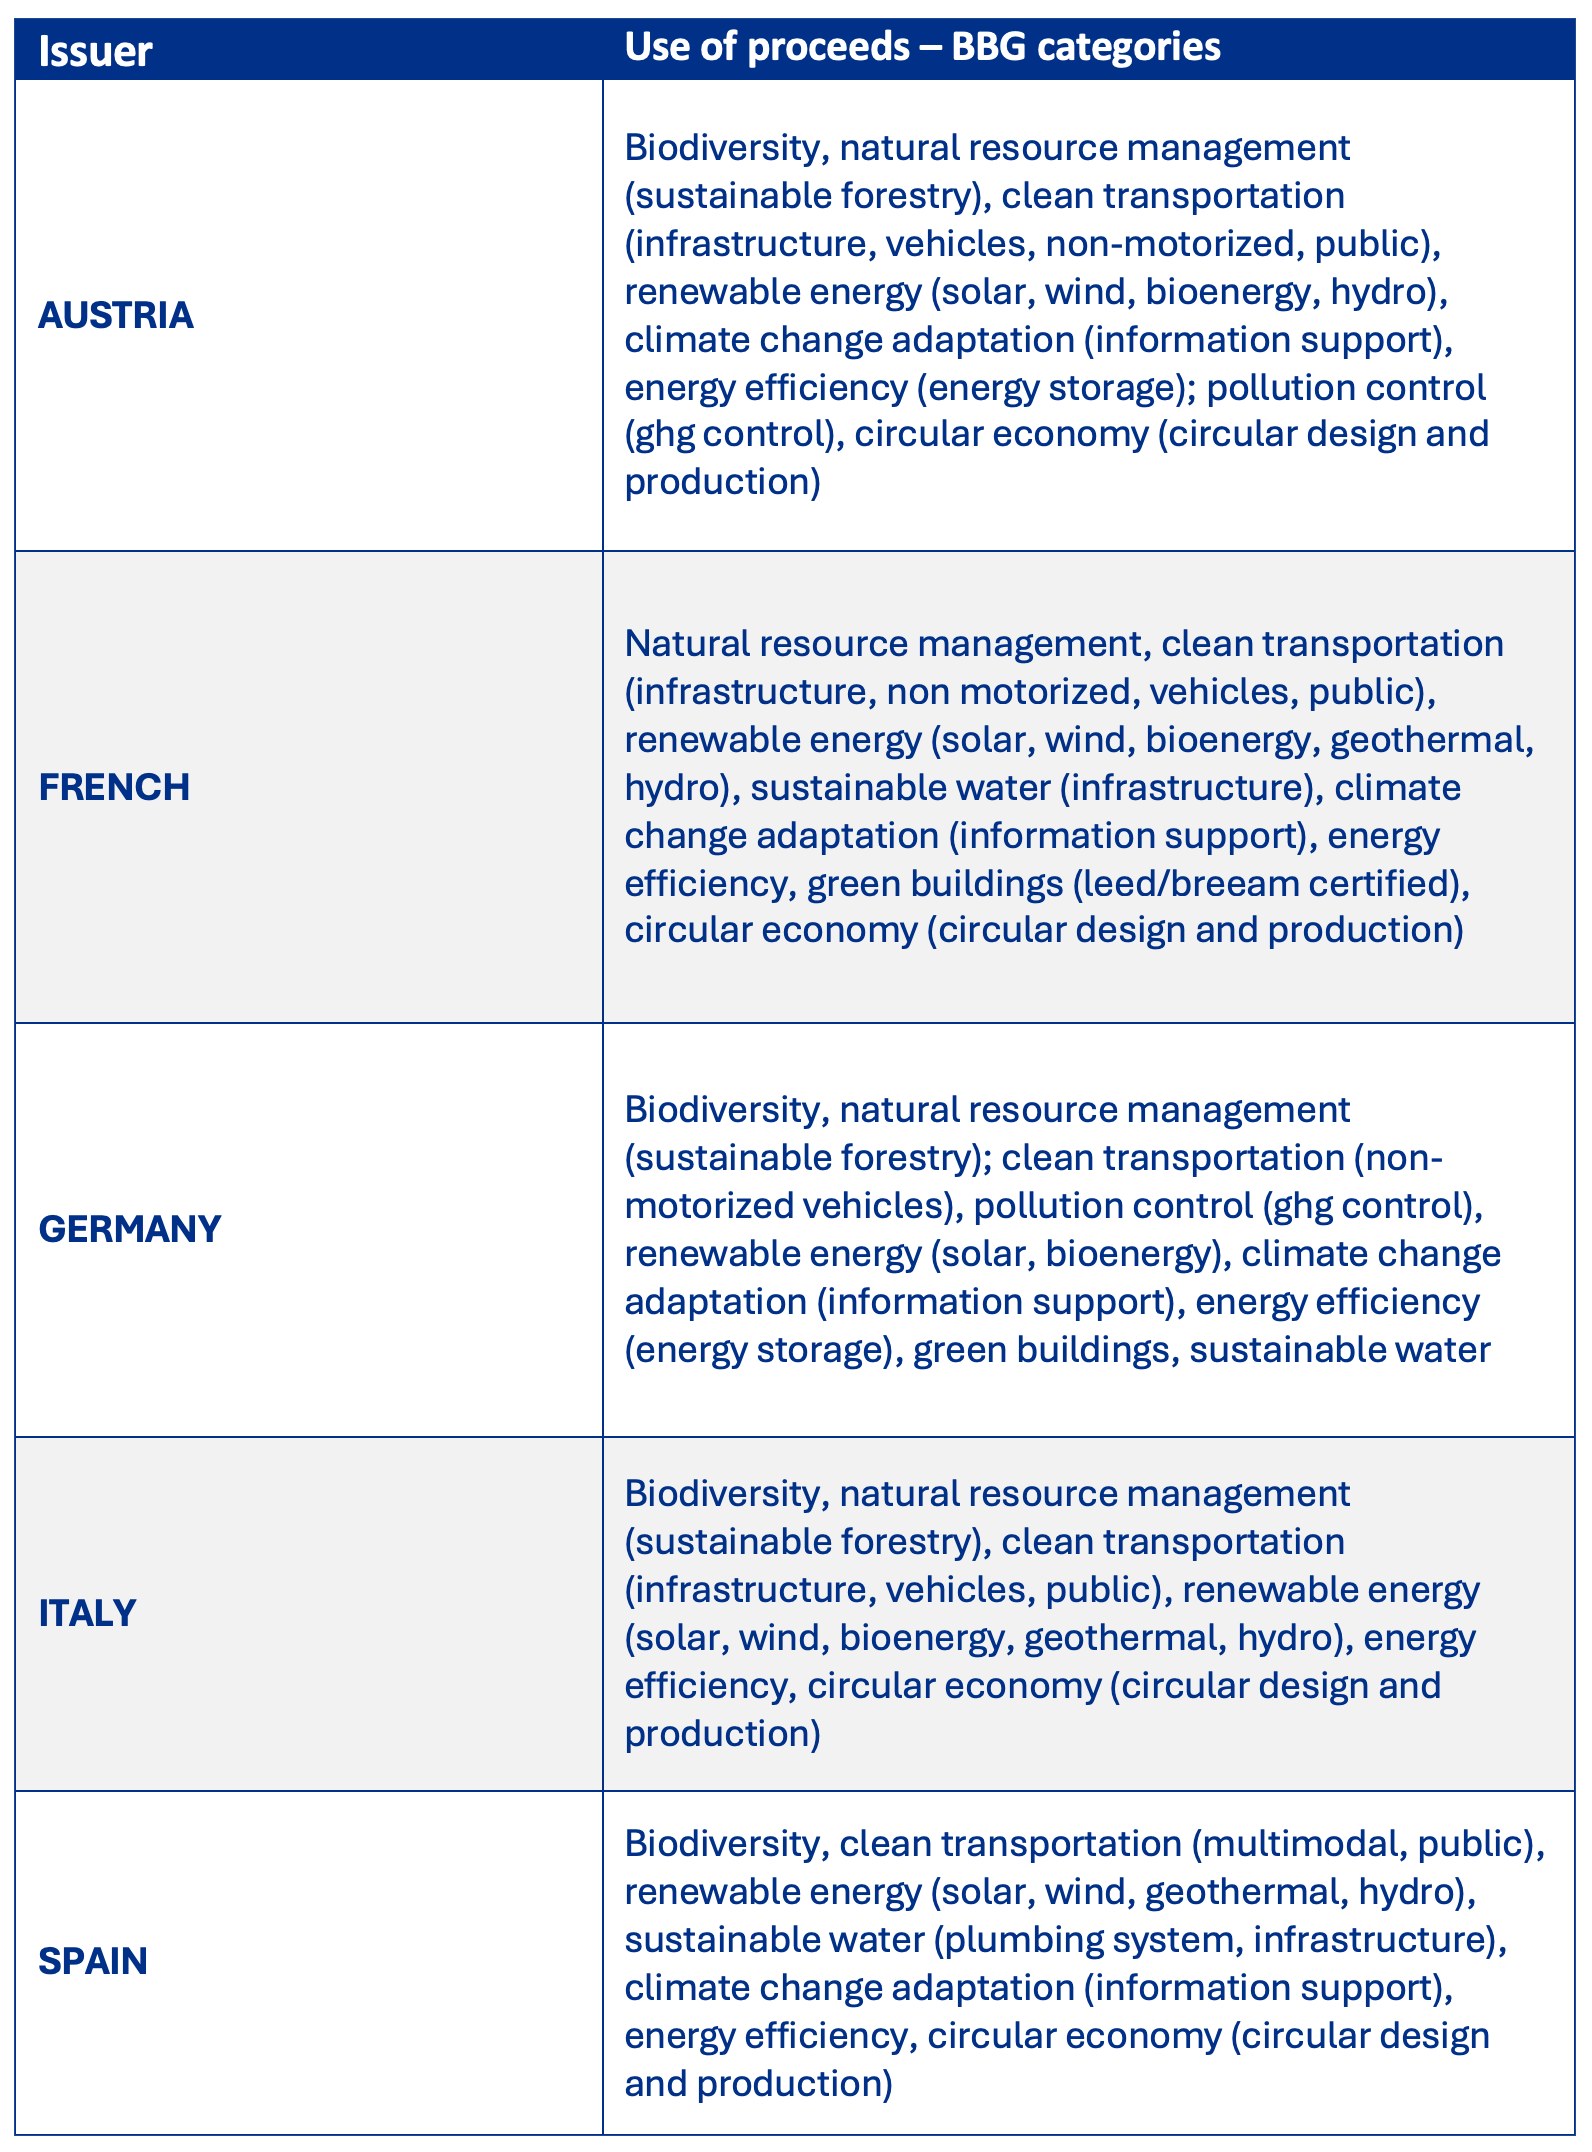
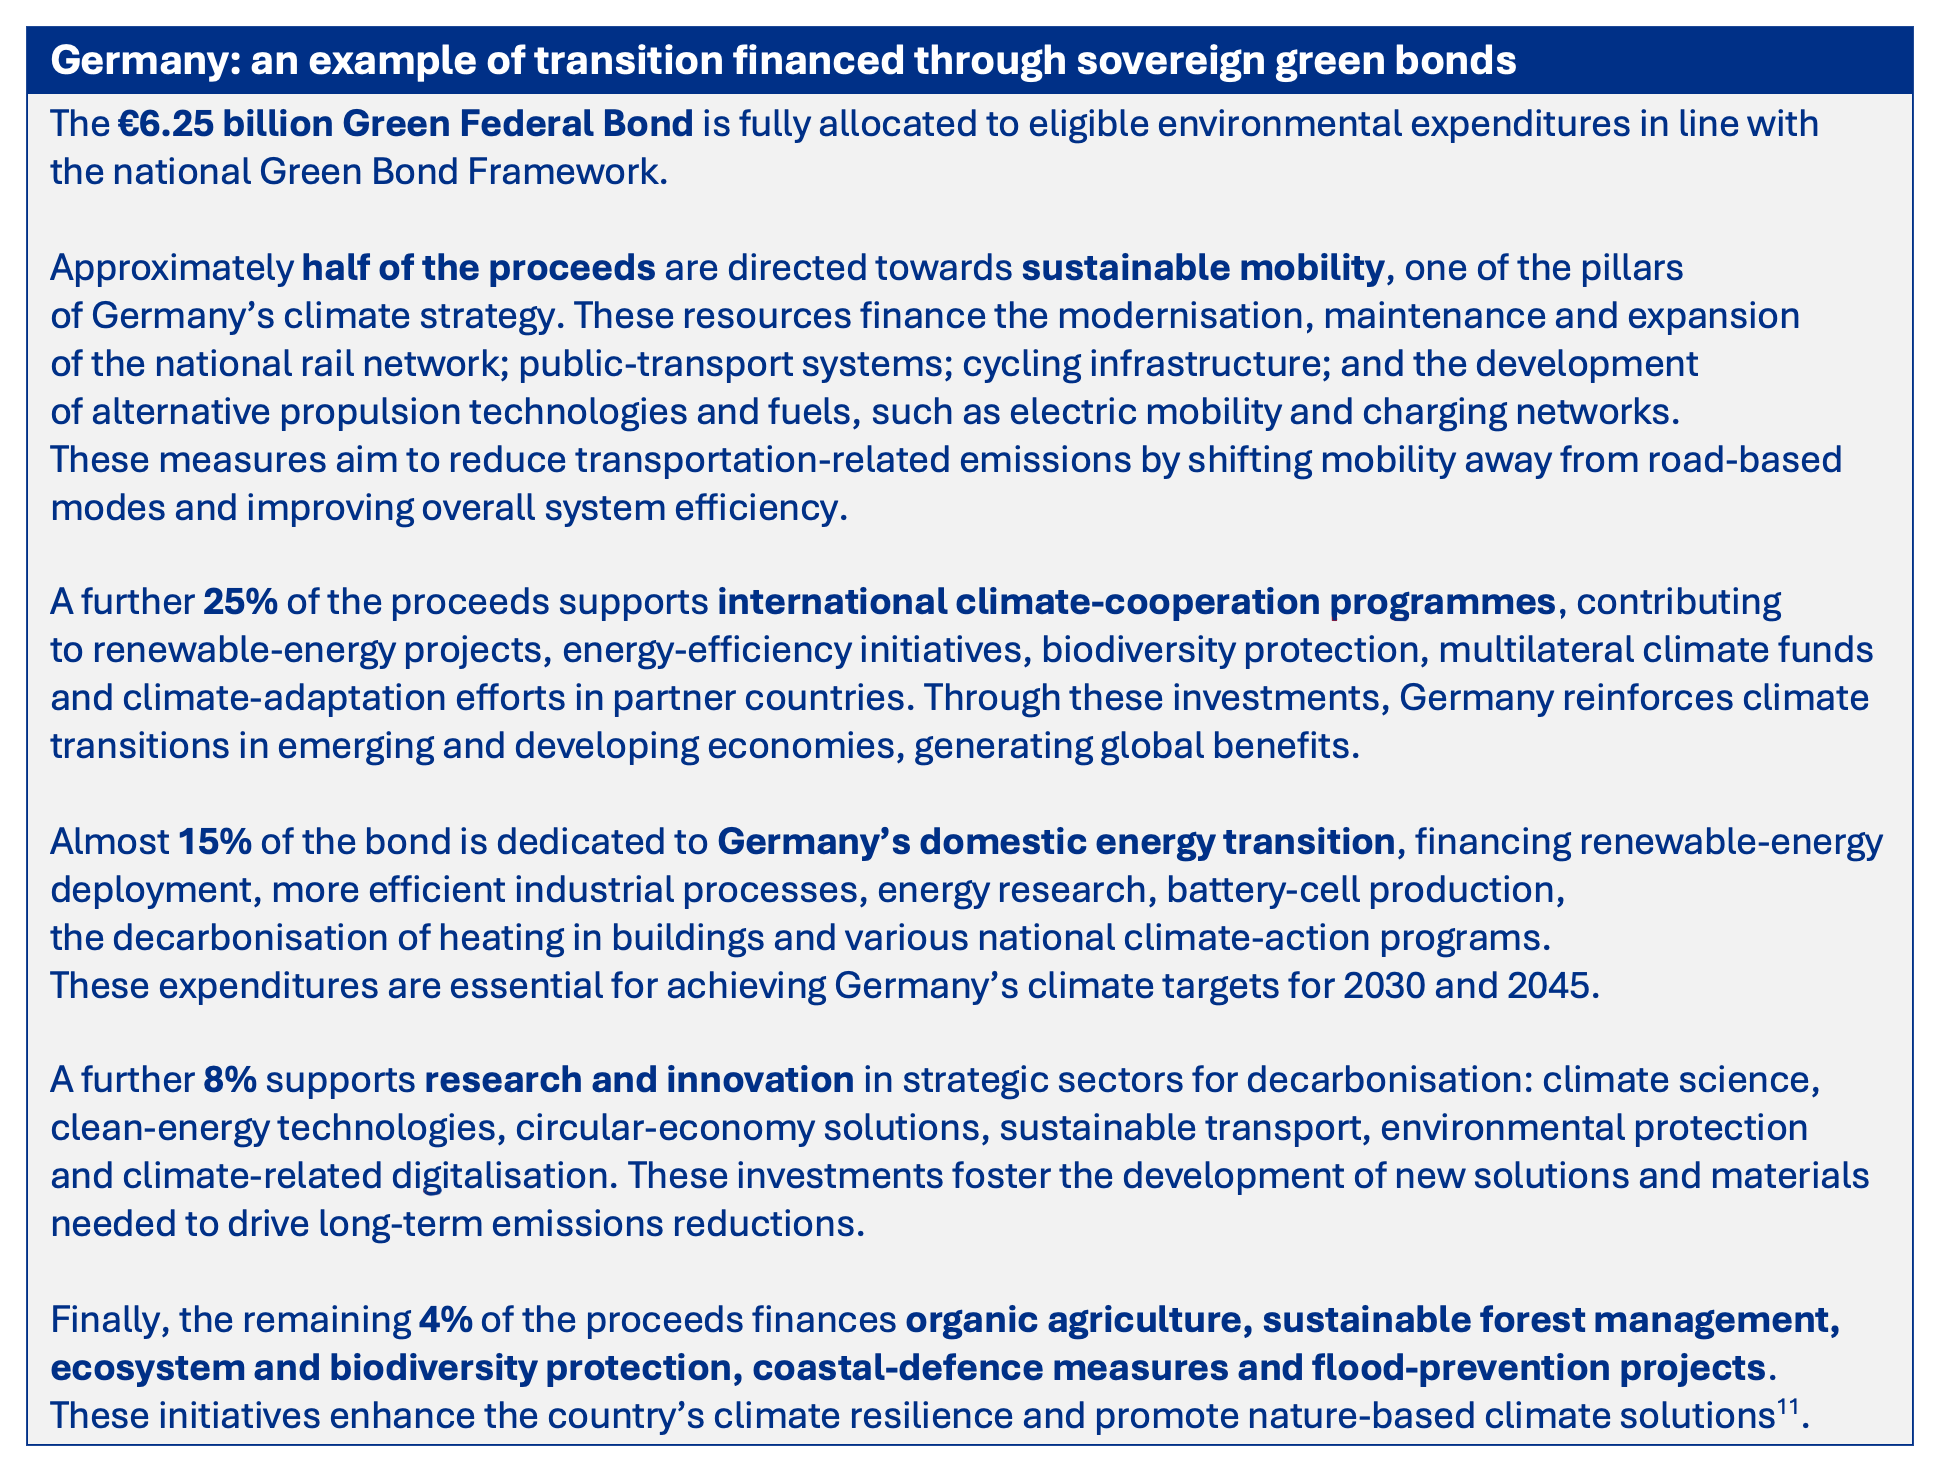
A particularly interesting element emerging from the analysis is that the portfolio’s exposure to Germany – one of the European countries with the highest absolute emission levels – occurs exclusively through green bonds. This means that, through Etica Transizione Climatica, the investment in Germany supports only climate‑positive projects, directly financing the country’s transition efforts.
Conclusions
Overall, the Etica Transizione Climatica portfolio confirms a very strong climate positioning, outperforming the benchmark and showing a significant reduction in emissions compared with 2019.
Specifically, the portfolio achieved:
- -72.32% in carbon footprint;
- -50.36% in carbon intensity;
- -35.74% in WACI.
These improvements highlight the effectiveness of the investment choices and the selection methodology applied in recent years.
The scenario analysis confirms good levels of alignment, while also underscoring the increasing relevance of Scope 3 emissions in assessing companies’ overall emissions trajectories.
From a transition perspective, the role of the portfolio is clear: more than 92.43% of the owned power‑generation capacity of issuers in the portfolio comes from renewable sources—an increase compared to the previous year. This share would be even higher if we also considered the corporate green bonds financing new renewable‑energy capacity, which are now essential to the broader energy‑transition process.
Climate risks – both transition and physical – remain very limited, thanks to the quality of the portfolio and the presence of issuers with robust climate‑risk management strategies.
Even in the sovereign segment, where climate criteria are not strongly embedded in the selection methodology, the portfolio outperforms the benchmark. This is due to a more favourable geographical allocation and a larger share of sovereign green bonds.
The analysis of the use of proceeds of both corporate and sovereign green bonds provides deeper insight into the portfolio actual contribution to the transition, highlighting the positive impact of the financed projects.
Finally, continuous monitoring of emissions remains essential to guide engagement activities and identify new areas for improvement. The introduction of updated IEA scenarios into forward‑looking assessments represents an important step, and more advanced use of this data may lead to further methodological enhancements. Likewise, the recent update of the fund’s methodology is expected to generate new results and additional opportunities, further strengthening the portfolio’s positioning along a credible and ambitious climate‑transition pathway.
Climate Impact in Brief
References
[1] https://www.issgovernance.com/esg/
[2] Launched after the 2015 Paris Agreement by the Financial Stability Board (FSB), the Task Force on Climate-related Financial Disclosure (TCFD – https://www.fsb-tcfd.org/) considers climate transparency as a crucial factor for the stability of financial markets. The objective of the TCFD is therefore to improve climate transparency in financial markets through recommendations on disclosure. These recommendations provide a “consistent framework that improves the ease of both producing and using climate-related financial disclosures”. The TCFD aims to create a unique standard for both corporate and investment disclosure, understanding that local regulatory frameworks may require different compliance levels. By October 12, 2023, the TCFD had fulfilled its mission and disbanded, although it remains a valid guideline for assessing and reporting on climate-related risks.
[3] IThe green colour indicates that green bonds have been excluded from the issuers’ emissions attribution analysis.
[4] It is important to note that the percentages reported for each effect do not represent shares of the total difference, but rather percentages of the benchmark’s total emissions.
[5] AR5 (2013/2014) – IPCC – Focal Point Italia
[6] Note that 1 bond could finance 1 or more project categories. The categories are defined according to Bloomberg analysis of the Allocation Report and Bond framework published by the issuers.
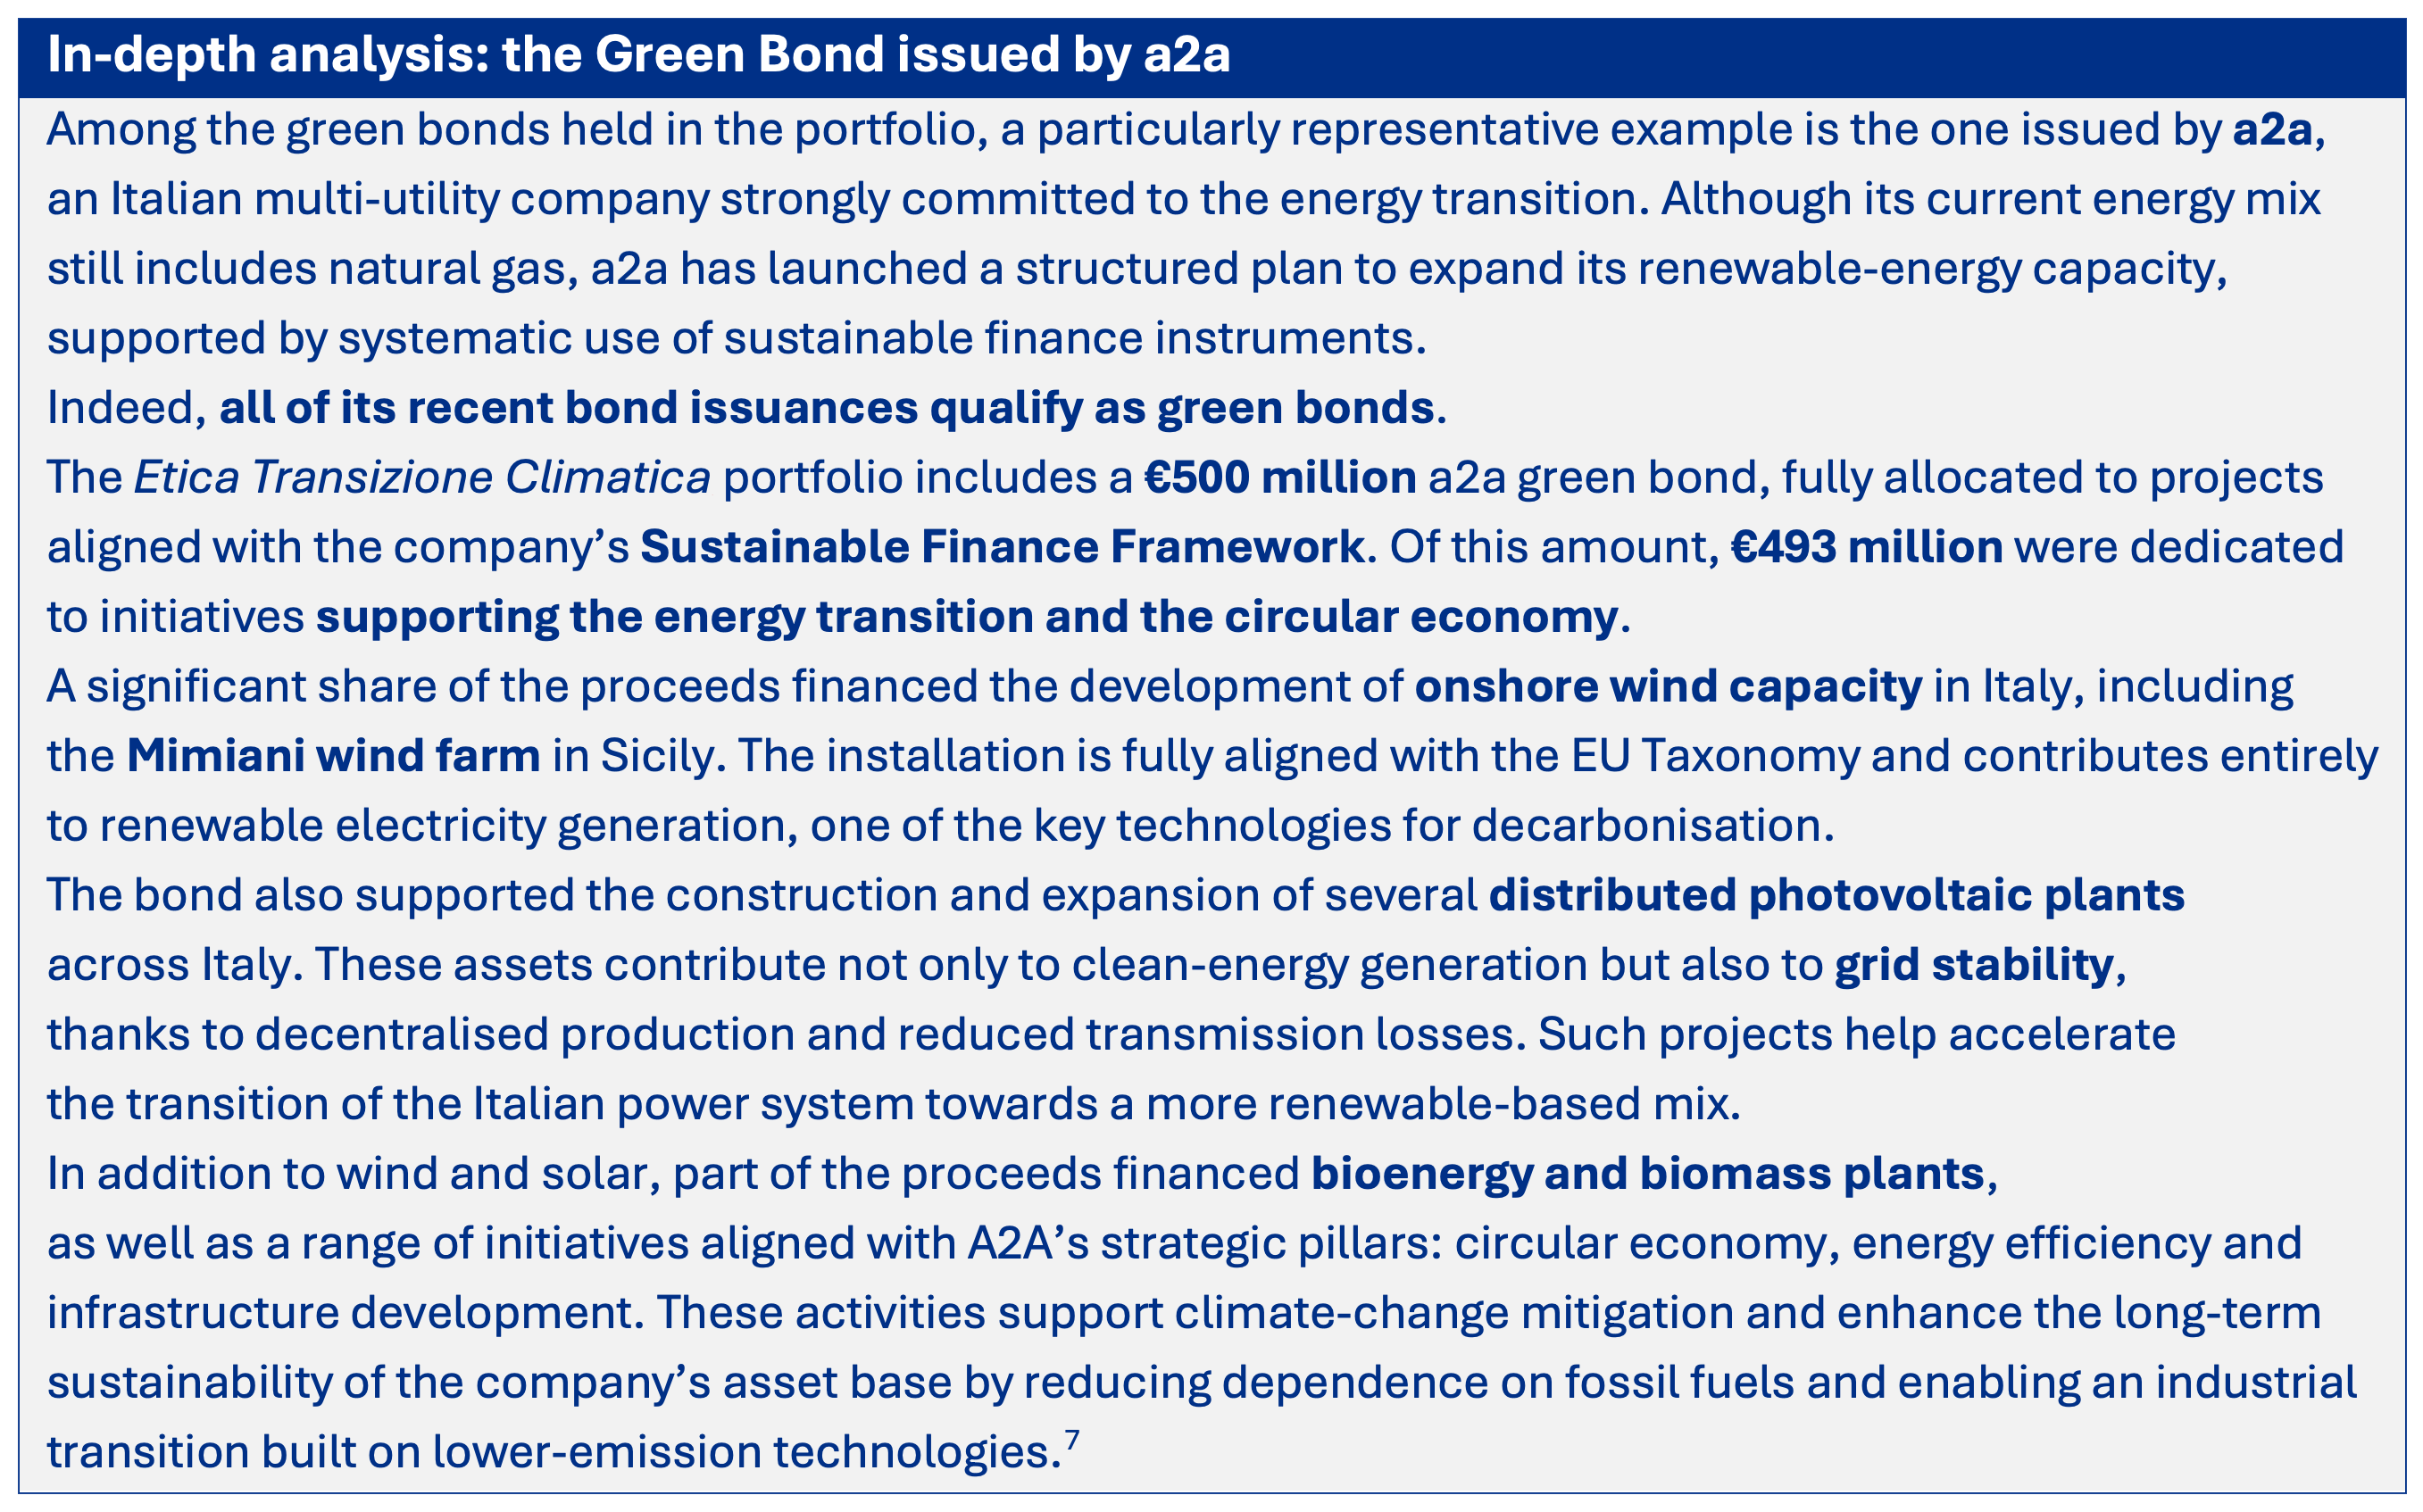
[7] a2a green Bond Report, Issuance 2019
[8] Selection of securities: ESG and financial analysis | Etica Funds
[9] The 17 United Nations Sustainable Development Goals cited by the issuer in the bond framework. The data was compiled by Bloomberg.
[10] Categories represent the eligible projects and/or activities classified by Bloomberg based on the information available.
[11] Federal Ministry of Finance, Green bond allocation report 2023, published in March 2025.
This document is a marketing communication issued by Etica Sgr S.p.A. (“Etica”). The economic and financial data, as well as the numerical, percentage or aggregated figures referred to in the material contained in this communication, reflect market conditions and the information available at the time of drafting and may therefore be subject to change in relation to developments in financial markets or newly available information. Etica is under no obligation to amend, supplement and/or update the data contained in this material. Any information contained in the material included in this communication relating to past performance, forecasts or assumptions regarding future prospects should not be considered indicative of future results; likewise, any opinion, strategy or assessment contained therein or derived therefrom is provided solely for illustrative purposes and may not be construed as a solicitation, an investment recommendation or investment advice. This communication does not in any way take into account the characteristics of any person who may become aware of it, including the applicable tax regime, investment objectives, knowledge and experience in investment matters, risk tolerance and financial situation. Investment in funds is subject to the risks associated with the underlying assets, which affect the performance of the value of the related units or shares. Etica SGR does not provide any guarantee of returns and does not guarantee the repayment of the invested capital. Etica makes no representation or warranty and assumes no liability with respect to the achievability, suitability, reasonableness or reliability of any forecast or assessment contained in, or derived from, the material provided. Investors should enter into an investment transaction only after fully understanding its overall characteristics and the degree of exposure to the related risks, through careful reading of the KID and the prospectus of the individual funds, which — together with information on sustainability-related aspects pursuant to Regulation (EU) 2019/2088 — are made available at https://www.eticasgr.com/en/

 – Etica Transizione Climatica")
 – SICAV")