The carbon footprint is a calculation of the climate change gases emitted by a product, organization or individual. We use this rigorous assessment of sustainability to give us an accurate measure of the environmental impact of our investments, which is taken into account during our analysis of securities.
The environmental impact of our investments
Etica made a commitment to measuring and reporting the emissions of its equity portfolio through a calculation of its carbon footprint with the signing of the Montréal Carbon Pledge beginning in 2015, focusing attention on the environmental aspects of our sustainable and responsible investments.
Carbon footprint 2019
 The Analysis has been conducted on Etica’s equity share within the Linea Valori Responsabili strategy compared with a benchmark[1] (holdings date 31st December 2018 for both).
The Weighted Average Carbon Intensity (WACI) of the Etica’s equity share within the Linea Valori Responsabili is 186 tCO2e per one EUR million of revenue. Below the historical trend[2] of the WACI is displayed:
| Holdings Date | Weighted Avg Carbon Intensity (tCO2e / EUR m Revenue) |
| 31st December 2018[3] | 185.84 |
| 31st December 2017 | 290.11[4] |
| 31st December 2016 | 333.46[5] |
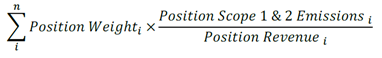
The Weighted Average Carbon Intensity (WACI) is the metric explicitly recommended by the Task Force for Climate-related Financial Disclosure (TCFD) (please refer to the Methodology session) for asset managers. Unlike the Emission Exposure and related Relative Carbon Footprint metrics based on the ownership principle, the WACI allocates Scope 1 & 2 GHG emissions based on portfolio weights.
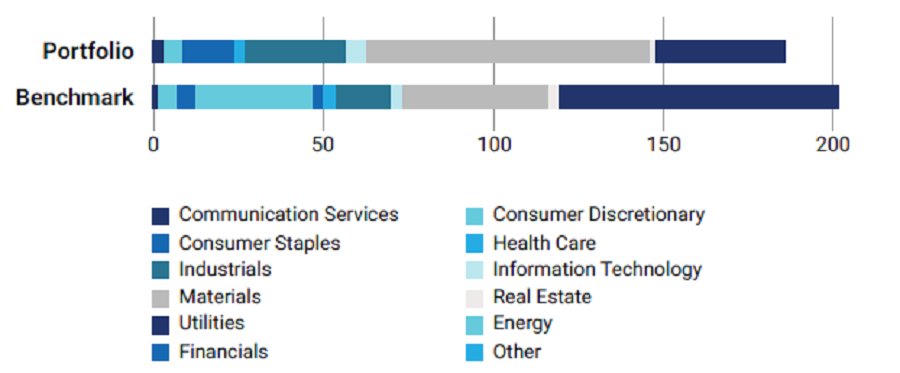
Figure 1: Sectoral Contributors to the WACI of the Etica Sgr Equity Portfolio.
Sectoral Contribution and Largest Contributors
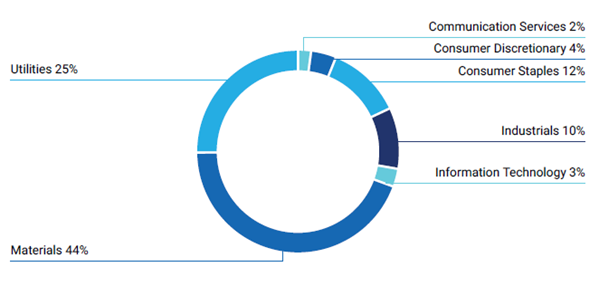
As displayed in Figure 2, 44% of the Portfolio’s Scope 1 & 2 emission exposure arises from the Materials sector, 25% from the Utilities sector, and 10% from the Industrials sector. Other sectors contribute to the remaining 21% of the Portfolio’s emission exposure.
Figure 2: Sectoral Contribution to Etica Sgr Equity Portfolio’s Scope 1 & 2 Emission Exposure.
The Relative Carbon Footprint of the Etica Sgr’s equity share within the Linea Valori Responsabili is 162 tCO2e per one EUR million invested. Below the historical trend of the Relative Carbon Footprint is displayed:
| Holdings Date | Relative Carbon Footprint (tCO2e / EUR m Invested) |
| 31st December 2018 | 162.16 |
| 31st December 2017 | 201.33[6] |
| 31st December 2016 | 271.69[7] |
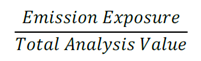
The Relative Carbon Footprint is crucial because it is based on the ownership principle, which is the key logic to the GHG protocol: one EUR million invested in the Etica Sgr Equity Portfolio is associated with 162 tCO2e and this is based on the investor’s “ownership” of the underlying companies.
Methodology
The analysis has been conducted by ISS ESG according to a proprietary methodology. The document contains just an extract of the whole analysis, focused on the positioning of the equity component of Linea Valori Responsabili funds in relation to the recommendations of the Task Force for Climate-related Financial Disclosure (TCFD), an established body by the Financial Stability Board (FSB) in order to provide guidelines on the reporting of risks related to climate change
Data
The data analysis is obtained via the ISS ESG ‘Portfolio Climate Impact Report’.
Scope 1 & 2 emissions
The methodology was developed over three years with the Swiss Federal Institute of Technology and includes about 800 sector and sub-sector specific models- allowing ISS ESG’s researchers to calculate the GHG emissions of companies based on those criteria that are most relevant to their line of business.
A summary of the process is provided below:
- Self-reported emissions data is collected from all available sources;
- Self-reported numbers are evaluated for trustworthiness and, where necessary, discarded;
- All companies are classified according to the proprietary ISS ESG CICS (Carbon Industry Classification System) – i.e. companies are classified in light of their carbon-profile, allowing ISS ESG to benchmark non-reporting companies against their reporting peers;
- ISS ESG applies its 800 sub-sector specific models to estimate the emissions of non-reporting companies according to sector-relevant financial or operational metrics.
Scope 3 emissions
ISS ESG’s methodology conceptually differentiates between two sources of Scope 3 emissions: a.) emissions from a company’s upstream and downstream supply chains and b.) emissions from the “use phase” of a company’s product or service.
- Supply Chain: For supply chain emissions, ISS ESG uses an Economic Input-Output Lifecycle Assessment table that models cash flows between sectors within an economy. The method uses information on industry transactions, such as the purchase of materials, to estimate total emissions throughout the supply chain.
- Product use phase: The “use phase” greenhouse gas emissions of representative products per industry are calculated based on Life Cycle Assessments (LCA) available through the Swiss Centre for Life Cycle Inventories (Ecoinvent) and other databases. ISS ESG uses LCA for representative products of the sectors to estimate, in average, the ratio between Scope 1&2 / Use Phase per activity.
For most sectors, Scope 3 emissions are “sector representative” emissions and should not be used for stock picking. They can, however, be used for quantifying the order of magnitude of a full portfolio assessment. Thus, considering Scope 3 emissions allows investors to focus their efforts on those sectors where Scope 3 data matters most and that might fall under the radar screen when just looking at Scope 1 & 2 emissions.
Carbon Footprint Metrics
For metrics, the calculations below are for equity, whereas for fixed income (corporate and sovereign), market capitalization is replaced with adjusted enterprise value[8].
Weighted Average Carbon Intensity
Relative Carbon Footprint
Before subscribing, please read the KIDs and Prospectus available from placing agents.
The placement of the “Linea Valori Responsabili” and “Linea Futuri Responsabili” funds is only available in Italy. For further information, please refer to the Italian version of the website.
Notes
[1] The benchmark used in the Data Analysis is iShares MSCI World ETF, which is a proxy of the actual benchmark (MSCI World Index).
[2] Please note that the carbon footprint methodology varies between the analysis based on holdings as of 31st December 2018 conducted by ISS ESG and the analyses based on holdings as of 31st December 2017 and 2016 conducted internally by Etica Sgr. Please refer to the Methodology for a detailed overview of the former.
[3] In order to allow for historical comparison, ISS ESG has analysed Etica Sgr’s equity share within the Linea Valori Responsabili as of 31st December 2018. GHG emission and revenue data refer to FY2017.
[4] Source: Etica Sgr internal 2018 carbon footprint 2018 report.
[5] Back calculated by ISS ESG based on Etica Sgr internal 2018 carbon footprint report.
[6] Launched after the 2015 Paris Agreement by the Financial Stability Board (FSB), the Task Force for Climate-related Financial Disclosure (TCFD) considers climate transparency as a crucial factor for the stability of financial markets. The objective of the TCFD is therefore to improve climate transparency in financial markets through recommendations on disclosure. These recommendations provide a “consistent framework that improves the ease of both producing and using climate-related financial disclosures”. The TCFD aims to create a unique standard for both corporate and investment disclosure, understanding that local regulatory frameworks may require different compliance levels.
[7] Source: Etica Sgr internal2018 carbon footprint 2018 report.
[8] Source: Etica Sgr internal2018 carbon footprint 2018 report.
[9] Adjusted Enterprise Value is calculated as Total Market Cap + Total Debt. For non-listed entities where MCap is not available, total debt only is used.


 – SICAV")