This content is an extract of the Task Force on Climate-related Financial Disclosures (TCFD[1]) aligned Report released by the company ISS ESG. It details results for the analysis conducted, for the first year, on the Fund Etica Impatto Clima (Linea Futuri Responsabli) which investment strategy is focused on climate change related topics, among others environmental considerations.
All asset classes have been analyzed accordingly to the TCFD recommendations: Portfolio of Equity plus Corporate Bonds together, and Portfolio of Sovereign bonds.
The document discloses results achieved at the year-end 2019 in the four areas of interests in line with TCFD recommendations: Governance, Strategy, Risk Management, Metrics and targets.
The related carbon metrics used in the Equity and Corporate Bonds analysis are the following ones (please refer to Appendix for more details):
- Relative Carbon Footprint: a normalised measure, defined as the total carbon emissions of the Portfolio per million EUR invested. Any reference to relative carbon metrics in the Analysis refers to tCO2e / EUR million Invested;
- The Weighted Average Carbon Intensity (WACI): is the metric explicitly recommended by the TCFD for asset managers. The WACI allocates Scope 1 & 2 GHG emissions based on Portfolio weights. and has among its positive aspects the fact that is simple to calculate and easy to communicate to investors and, most notably, it can be applied across asset classes as it does not rely on the ownership approach. Any reference to carbon intensity in the Analysis refers to tCO2e / EUR million Revenue;
The Data Analysis goes beyond the sole carbon footprint assessment by providing various metrics used to assess climate-related risks and opportunities in forward-looking perspectives. Those metrics include[2]: carbon risk rating, scenario analysis, transitional climate risk and physical risk exposure.
_____________________________
GOVERNANCE
The Board of Directors (hereinafter the “BoD”) is Etica Sgr’s decision-making body and is final accountable for climate-related matters, which are incorporated into Etica Sgr’s overall investment strategy focused on issuers that adopt good practices from an ESG viewpoint. The BoD oversees climate risks and opportunities via three main channels:
- the supervision of integration of climate-related considerations into the investment process by defining the final Countries and Companies investible universe;
- the definition of climate-related issues for engagement in the form of dialogue with issuers and/or the exercise of voting and other shareholders’ rights;
- the supervision of key initiatives in the climate change domain such as the annual carbon footprint of investments.
As the first Italian asset management company to have signed the Montreal Carbon Pledge in 2015, Etica Sgr is committed to measuring and reporting on the carbon footprint of its investments in line with the TCFD on an annual basis. Every year, the BoD of Etica Sgr oversees the results of the investment carbon footprint analysis with strategic objectives, such as:
- Positioning the Portfolio towards more sustainable companies in relation to environmental and climate change strategies (i.e. companies committed to keep global warming well below under 2°C in line with the Paris Agreement);
- Collecting climate-related data (e.g. GHG emissions reduction targets) that can be used as a basis for engagement with companies in the equity Portfolio.
STRATEGY
The investment strategy of the fund Etica Impatto Clima focuses on climate change and the selection of securities is implemented through an assessment of the climate profile of the issuers. Corporate issuers are excluded if involved in thermal coal mining and/or the revenue share from fossil fuel is larger than 33% of the total revenue and/or the revenue share from shale oil or oil sands is larger than 10% of the total revenue and/or the oil shale reserves are larger than 33% of the total revenue. Moreover, several industries are excluded also because of their climate impact. Those industries are oil exploration and production, integrated oil, oil and gas services and equipment, oil transportation, coal and coal mining, precious metal and other metal mining, mining services. Several climate-linked factors are included in the issuer-specific negative screening based on controversies (e.g. pollution, environmental and climate impact of value chain). It is also important to note that the Etica Impatto Clima fund does not invest in the Financial sector, but green bonds issued by financial institutions can be purchased after a careful analysis of the bond’s Prospectus by the ESG Analysis and Research Area.
RISK MANAGEMENT
The Etica Impatto Clima fund incorporate considerations on lower-carbon energy:
- By excluding the fossil fuel industry, for the majority, from the investible universe;
- By including criteria related to renewable energy in the sustainability assessment of issuers (e.g. revenue share from renewable energy power generation and/or from the production of turnkey solutions for the renewable energy industry etc.).
As a thematic fund focused on climate change, the Etica Impatto Clima fund includes additional criteria on fossil fuel involvement and lower-carbon energy. For instance, issuers that derive more than a given share of their revenue from certain fossil fuel activities are excluded. At the same time, green bonds, whose proceeds may be used to finance projects targeting renewable energy, energy efficiency, circular economy, sustainable water management, green buildings, and whose prospectus is in line with the Green Bond Principles outlined by the International Capital Market Association (ICMA)[3], can be purchased.
Etica Sgr’s consideration for lower-carbon energy is also reflected in its engagement activities where, most notably, disclosure on energy use from renewable energy sources is one of the long-term strategic issues Etica Sgr aims to discuss and to vote in favour of in related shareholder resolutions, and it is one of the topics for shorter-term dialogue with companies.
ESG considerations are in fact integrated into Etica Sgr’s risk management through the proprietary methodology “Rischio ESG” (i.e. ESG Risk). “Rischio ESG” is built on an ESG score that inter alia includes the climate-related indicators.
Rischio ESG is a statistic and predictive tool that calculates the risk arising from ESG-related issues that impact the performance of stocks in a mutual fund. Every security in Etica Sgr’s Portfolio holdings is assigned an ESG score. This score is higher for the securities of corporate and sovereign issuers that have a better ESG profile, and securities are then categorised in terms of classes of Rischio ESG. Considering this distribution, the ESG Risk is lower when the best performing securities (in ESG terms) are concentrated in the classes with a higher score.
Etica Sgr has measured a strong statistical correlation between Rischio ESG and the traditional financial risk represented by non-diversified Value-at-Risk (VaR), which consists in the potential loss on an investee in a given timeframe. This statistical correlation applies to both sectors and countries. A fund with a higher VaR also has a higher Rischio ESG and vice versa. Therefore, Etica Sgr approach to the risk/return analysis of a Portfolio can be regarded as holistic since it includes traditional as well as non-financial (ESG) variables.
Regarding the metric of VaRESG, for the portfolios belonging to the Linea Valori Responsabili, in order to have a coherent and complete integration between financial risk and ESG risk, Etica Sgr calculates an expected loss, affected by both the risk dimensions, i.e. a VaRESG, which represents a more prudential risk measure. Etica Sgr is looking for extending this metrics also to the Fund Etica Impatto Clima, so that is possible to predict portfolio drawdowns than simple traditional VaR (even if calculated with skewness, kurtosis and volatility jumps).
METRICS AND TARGETS
Climate change is regarded as a systemic issue with a focus on climate mitigation (GHG emission reduction targets and SBTs, disclosure and TCFD recommendations), climate adaptation, just transition and green bonds due diligence.
 “The results of the TCFD Analysis of the Fund confirm Etica Sgr’s effort over the past 20 years to invest in businesses and countries adopting virtuous practices from a climate prospective. Many of the recently observed climate changes are unprecedented and this is why we are reinforcing our commitment by applying TCFD recommendation and taking more ambitious steps.”
Mr. Luca Mattiazzi – Etica Sgr’s General Manager
 “The results seem to confirm Etica Sgr’s effort in order to elaborate new risk metrics, which consider both financial and ESG spheres. Indeed, our risk management aim to control the risk in a holistic perspective, i.e. following a more complete approach than traditional one, as the final goal is to reduce the Portfolio’s drawdowns”.
Mr. Paolo Capelli– Etica Sgr’s Head of Risk Management
- Etica Impatto Clima - Equity and Corporate bonds portfolios
- Etica Impatto Clima - Sovereign Bonds portfolio
Etica Impatto Clima - Equity and Corporate bonds portfolios
Carbon Footprint analysis of the equity and corporare bonds portfolios of Etica Impatto Clima[4].
1. Relative Carbon Footprint
The Relative Carbon Footprint is crucial because it is based on the ownership principle, which is the key logic to the GHG protocol: one EUR million invested in the Equity and Corporate Bonds Portfolio of Etica Impatto Clima Fund Portfolio is associated with 78.31 tCO2e and this is based on the investor’s “ownership” of the underlying companies.
The Portfolio Scope 1 & 2 emission exposure and Relative Carbon Footprint (tCO2e/EUR million Invested) are lower than the benchmark because of a lower allocation to the Energy sector and a less carbon-intense stock picking for Utilities.
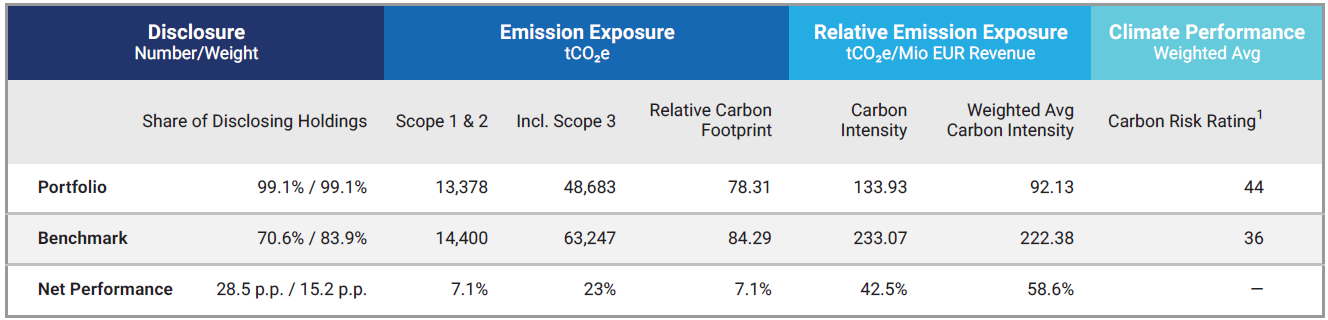
Figure1: Equity and Corporate Bonds Portfolio of Etica Impatto Clima Fund – Carbon Footprint Overview
2. Weighted Average Carbon Intensity
The Weighted Average Carbon Intensity (WACI) of the Equity and Corporate Bonds Portfolio of the Fund Etica Impatto Clima amounts to 92.13 tCO2e per one EUR million of revenue instead the benchmark WACI is 222.38 tCO2e per one EUR million of revenue.
The Portfolio out-performance compared to the benchmark (+ 58,5%) is mostly driven by lower investments in the Energy sector (0.73% for the Portfolio and 5.17% for the benchmark) and less revenue-intense investments in the Materials and Utilities sectors.
Figure 2 provides more insights into the WACI. First, in terms of sector contribution, the generally carbon-intensive Materials sector is the largest contributor to the Portfolio’s WACI. The contribution of another GHG-intensive sector such as Utilities is much lower than the benchmark. This highlights how the stock selection in the Portfolio favours lower-carbon intensity Utilities when compared to the benchmark. Moreover, the fact that the Portfolio has a more limited asset allocation to the Energy sector compared to the benchmark contributes positively to the WACI of the Portfolio versus the benchmark.
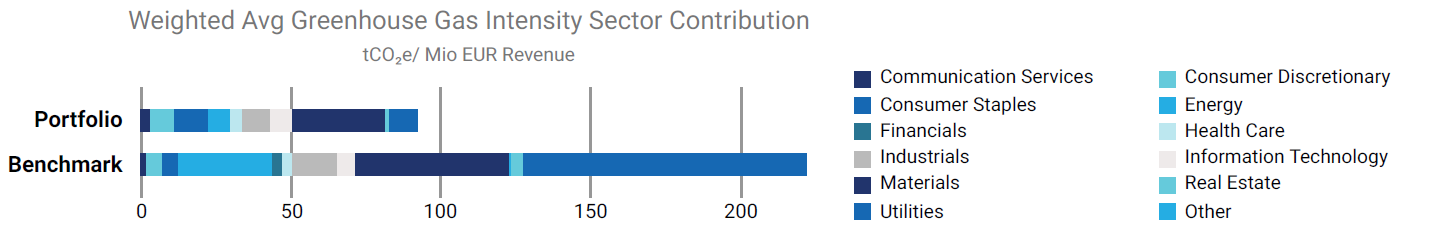
Figure 2: Sectoral Contributors to the WACI of the Equity and Corporate Bonds Portfolio of Etica Impatto Clima Fund
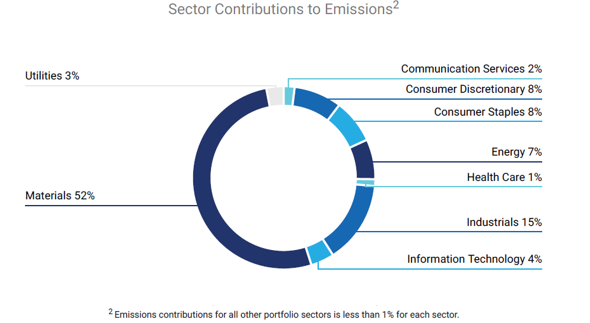
Figure 3: Sectoral Contribution to Equity and Corporate Bonds Portfolio of Etica Impatto Clima Fund’s Scope 1 & 2 Emission Exposure.
-
Carbon Risk Rating
The Carbon Risk Rating (CRR) assesses how an issuer is exposed to climate risks and opportunities, and whether these are managed in a way to seize opportunities, and to avoid or mitigate risks.
The metric of CRR[5] can provide critical insights into how issuers are prepared for a transition to a low carbon economy and is a central instrument for the forward-looking analysis of carbon-related risks at Portfolio and issuer level.
The weighted average CRR of the Equity and Corporate Bonds Portfolio of Etica Impatto Clima Fund is 44, outperforming the benchmark (36).
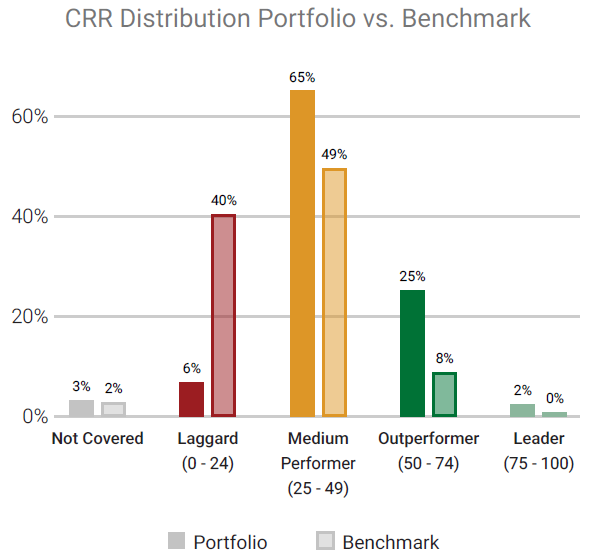
Figure 6 (below) displays the CRR distribution of the Equity and Corporate Bonds Portfolio of Etica Impatto Clima Fund versus the benchmark.
![]()
Figure 4: CRR Distribution Equity and Corporate Bonds Portfolio of Etica Impatto Clima Fund vs Benchmark
The average CRR of the Portfolio issuers generally tends to be towards the upper end (outperformers-leaders) of the industry-specific CRR spread across all issuers in the universe covered by the CRR. The statement above is especially significant for key industries such as Renewable Energy (Operation) & Energy Efficiency Equipment and Utilities.
-
Scenario Analysis
The quantitative analysis aims to analyse the emission intensity from the direct emission of an asset to assess with which climate scenario it is aligned, based on its market share and carbon budget, and aggregate the results for the Portfolio holdings at the Portfolio level. The ISS ESG scenario analysis combines the three climate scenarios provided by the International Energy Agency (IEA) and the emission reduction methodology according to the Sectoral Decarbonization Approach (SDA) developed by the Science Based Targets initiative (SBTi), which assumes that a company is responsible for its sector emission reduction pathway.
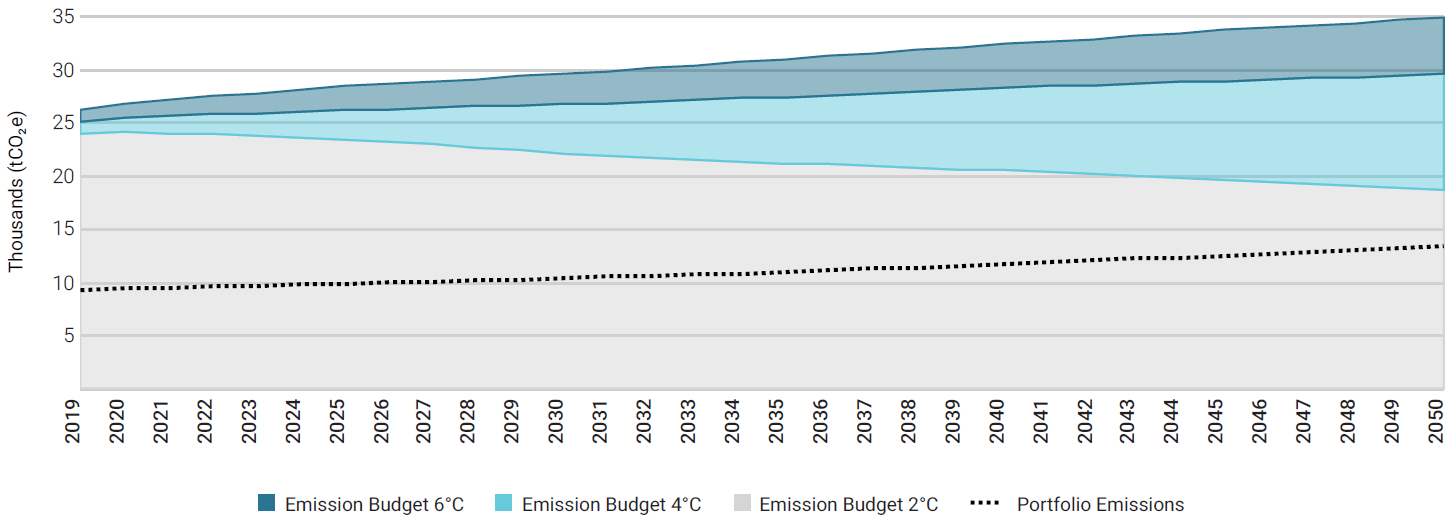
The Equity and Corporate Bonds Portfolio of Etica Impatto Clima Fund is within the carbon budget of the three IEA-derived climate scenarios at a given point in time: the Portfolio in its current status is aligned with a 2 degrees scenario for the full period analysed. The dotted line represents the projected Portfolio GHG emission pathway[6]. In a 2 degrees scenario, the GHG emission levels are expected to decrease slightly more substantially starting post 2027. As opposed to the Portfolio alignment with a 2DS for the full period analysed, the benchmark is not aligned with a 2DS and exceeds its budget in 2028.
![]()
Figure 5: Equity and Corporate Bonds Portfolio of Etica Impatto Clima Fund GHG Emission Pathway vs Climate Scenarios
-
Transitional Climate Risk
For a decarbonized future economy, it is key to transition the energy generation mix from fossil to renewable sources. Utilities relying on fossil power production without a substitute plan might run a higher risk of getting hit by climate change regulatory measures as well as reputational damages.
With regard to transitional climate risks[7], the Equity and Corporate Bonds Portfolio of Etica Impatto Clima Fund shows a stronger performance than the benchmark. The Portfolio exposure to renewable power generation (79.77%) is much larger than the benchmark, and it is already in line with the 2 degrees scenario compatible energy mix for 2050.
-
Physical Climate Risk Exposure
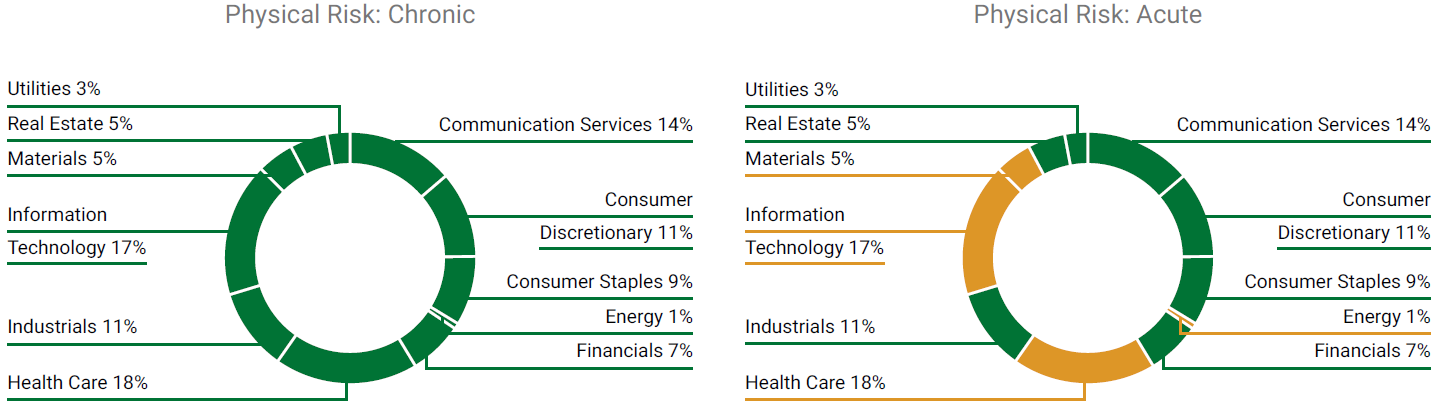
Rising temperature levels, even if limited to 2° Celsius, will result in changes of the climate system resulting in physical risks. Physical risks arising from climate change can be classified into chronic risks such as droughts, heat stress and sea level rise, and acute risks such as extreme weather events and flooding. Companies’ exposure to these two types of physical risk depends on two main factors: their sector as well as the geographical region they are active in[8].
![]()
Figure 6: Exposure to Physical Climate Risks of the Equity Portfolio of the Linea Valori Responsabili (Green: Low Risk; Orange: Medium Risk; Red: High Risk)
Etica Impatto Clima - Sovereign Bonds portfolio
Etica Impatto Clima – Carbon Footprint analysis of the sovereign bonds portfolio of Etica Impatto Clima.
The “Carbon Footprint” section compares the GHG emissions and other related carbon metrics for the Sovereign bonds Portfolio of the Etica Impatto Clima versus the benchmark[9], including absolute and relative values for the Portfolio’s carbon emissions[10].
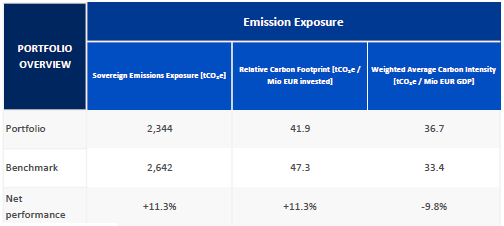
Figure 7: Sovereign bonds Portfolio of Etica Impatto Clima Fund– Carbon Footprint Overview
As shown in Figure 7, the overall Portfolio’s Scope 1 & 2 emission exposure is 2,344 tCO2e, which is 11.3% lower than the benchmark. This ranking is reflected in the Relative Carbon Footprint based on investor’s “ownership” of the underlying countries’ debts.
The WACI metric highlights the Portfolio’s exposure to carbon intensive countries. The WACI of the Portfolio amounts to 36.7 tCO2e per one EUR million of GDP. Instead, the benchmark WACI is 33.4 tCO2e per one EUR million of GDP.
Largest contributors
As displayed in Figure 8, 46% of the Portfolio’s Scope 1 & 2 emission exposure arises from the Italian bonds with a 67% investment allocation, whereas the contribution of the German bonds is 36%, with a capital allocation of 14%. The other main contributors to the emissions exposure are France and Netherlands with 6% each, while the other countries contribute to the remaining 6% of the Portfolio’s emission exposure.
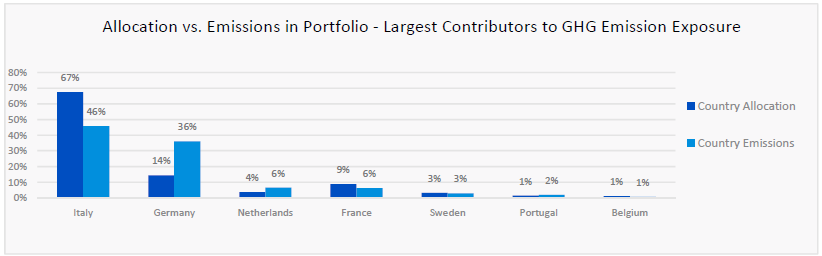
Figure 8: Sovereign bonds Portfolio of Etica Impatto Clima Fund– Largest Contributors
The different carbon intensities of the analysed countries are the main factors that explain the results of a carbon footprint analysis. For this reason, the sovereign report presents a dedicated column chart (Figure 9) showing both the emissions per EUR million of debt and the emissions per EUR million of GDP of the main contributors.
For the Sovereign bonds Portfolio of Etica Impatto Clima Fund the emissions intensity per unit debt of Italy is one of the lowest and this drags the emission exposure and the relative carbon footprint down. On the other hand, a much lower presence of France in the Portfolio’s capital allocation compared to the benchmark, as well as the absence of other low intensity countries like Spain (not present in the portfolio while having a 14% weight in the benchmark) explains the higher WACI of the Portfolio.
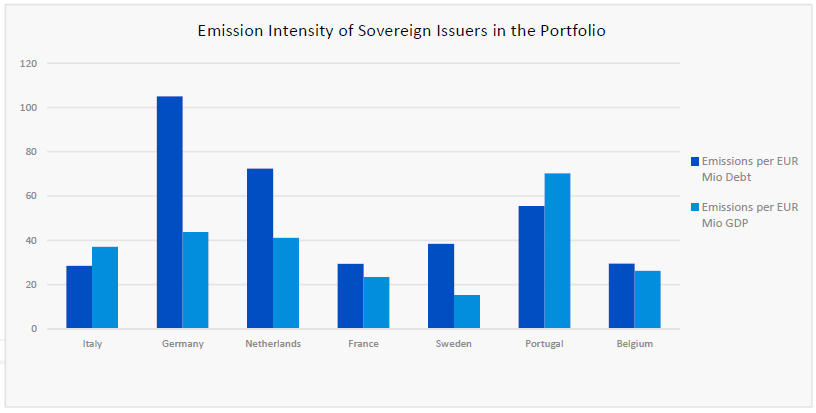
Figure 9: Emission intensity of the main constituents in the Sovereign bonds Portfolio of Etica Impatto Clima Fund
[1] Launched after the 2015 Paris Agreement by the Financial Stability Board (FSB), the Task Force on Climate-related Financial Disclosure (TCFD – https://www.fsb-tcfd.org/) considers climate transparency as a crucial factor for the stability of financial markets. The objective of the TCFD is therefore to improve climate transparency in financial markets through recommendations on disclosure. These recommendations provide a “consistent framework that improves the ease of both producing and using climate-related financial disclosures”. The TCFD aims to create a unique standard for both corporate and investment disclosure, understanding that local regulatory frameworks may require different compliance levels.
[2] The metrics mentioned in the list refer to equity and corporate bonds portfolios. For sovereign bonds portfolios the risk-related metrics are limited to physical risk exposure of countries.
[3] https://www.icmagroup.org/green-social-and-sustainability-bonds/green-bond-principles-gbp/
[4] The benchmark used in the Data Analysis is ISHARES MSCI ACWI ETF as a proxy of the MSCI World Net Total Return (in Euro). This benchmark is applied to the Equity Portfolio and to the Corporate Bonds Portfolio of both asset classes for the fund Etica Impatto Clima.
[5] CRR is based on a scale of 0 (very poor performance) to 100 (excellent performance) and allows to categorise companies according to their carbon-related performance into four groups: Climate Laggards, Climate Underperformers, Climate Performers, and Climate Leaders. For more details, please refer to Appendix.
[6] The GHG emission pathway and carbon budget of the Portfolio are the result of the aggregation of company-level data. The GHG emission trajectories at the company-level include both historical (i) and forward-looking indicators (ii) to project the emission intensity profile of a company from now until year 2050:
- The scenario analysis utilises 5 years of the ISS ESG historical, high-quality emission intensity data to create a trend for each company included in the analysis.
- The historical trend is then combined with forward looking emission reduction commitments and targets to estimate future emissions.
For a specific company to be in line with either the 2°C, 4°C and 6°C climate scenario, the allocated carbon budget per year need to be higher than the estimated direct emissions for the same company. The emissions and carbon budget at the company-level are then aggregated to get a Portfolio 2°C, 4°C and 6°C scenario alignment.
For more details, please refer to the Appendix.
[7] Further details on the methodology are reported in the Appendix.
[8] Further details on the methodology are reported in the Appendix.
[9] For the Sovereign bonds portfolios two benchmarks are used: AMUNDI INDEX JPM EMU GOVIES ETF as a proxy of the benchmark JP Morgan EMU and the index Invesco Euro Government Bonds 1 – 3 Year UCITS ETF EUR Inav as a proxy of the benchmark ICE BofAML Euro Treasury Bill Index.
[10] In the Sovereign Bonds section of this report, Figure 7 displays the “Sovereign Emissions Exposure” of the Portfolio taking Scope 1 & 2 emissions into account. The “Relative Carbon Footprint” is a normalised measure, defined as the total carbon emissions of the Portfolio per million EUR invested. “The Weighted Average Carbon Intensity” differs from the one calculated for non-sovereign portfolios because the GDP of the country is used instead of the revenue of the company.
[11] Adjusted Enterprise Value is calculated as Total Market Cap + Total Debt. For non-listed entities where MCap is not available, total debt only is used.
[12] For sovereign bonds the revenue is replaced by the GDP of the country.
[13] The PCAF is a coalition of twelve Dutch financial institutions launched via the Dutch Carbon Pledge at the COP-21 Summit in Paris and is led by ASN Bank. The objective of this coalition is to develop a standard that enables financial institutions to set targets for carbon emissions and measure the extent to which these targets are achieved, which was presented in a December 2017 report (http://carbonaccountingfinancials.com/).
[14] Data availability limits the implementation of the exact methodology in practice. Data scarcity consists of (i) lack of data based on the same sector classifications for emissions and for expenditure, resulting in inaccuracies when matching the two data sets; and (ii) lack of sector-based expenditure data for many countries, particularly developing countries.
-
Appendix - Methodology
The analysis has been conducted by ISS ESG according to a proprietary methodology.
The document contains just an extract of the whole methodology.
Data
The data analysis is obtained via the ISS ESG ‘Portfolio Climate Impact Report’. Etica provided holdings for three asset classes (equity, corporate fixed income and sovereign fixed income) which, after a mapping exercise to ensure company indicators were matched appropriately and were uploaded onto ISS ESG’s online tool.
Scope 1 & 2 emissions
The methodology was developed over three years with the Swiss Federal Institute of Technology and includes about 800 sector and sub-sector specific models- allowing ISS ESG’s researchers to calculate the GHG emissions of companies based on those criteria that are most relevant to their line of business.
A summary of the process is provided below:
- Self-reported emissions data is collected from all available sources;
- Self-reported numbers are evaluated for trustworthiness and, where necessary, discarded;
- All companies are classified according to the proprietary ISS ESG CICS (Carbon Industry Classification System) – i.e. companies are classified in light of their carbon-profile, allowing ISS ESG to benchmark non-reporting companies against their reporting peers;
- ISS ESG applies its 800 sub-sector specific models to estimate the emissions of non-reporting companies according to sector-relevant financial or operational metrics.
Scope 3 emissions
ISS ESG’s methodology conceptually differentiates between two sources of Scope 3 emissions: a.) emissions from a company’s upstream and downstream supply chains and b.) emissions from the “use phase” of a company’s product or service.
- Supply Chain: For supply chain emissions, ISS ESG uses an Economic Input-Output Lifecycle Assessment table that models cash flows between sectors within an economy. The method uses information on industry transactions, such as the purchase of materials, to estimate total emissions throughout the supply chain.
- Product use phase: The “use phase” greenhouse gas emissions of representative products per industry are calculated based on Life Cycle Assessments (LCA) available through the Swiss Centre for Life Cycle Inventories (Ecoinvent) and other databases. ISS ESG uses LCA for representative products of the sectors to estimate, in average, the ratio between Scope 1&2 / Use Phase per activity.
For most sectors, Scope 3 emissions are “sector representative” emissions and should not be used for stock picking. They can, however, be used for quantifying the order of magnitude of a full portfolio assessment. Thus, considering Scope 3 emissions allows investors to focus their efforts on those sectors where Scope 3 data matters most and that might fall under the radar screen when just looking at Scope 1 & 2 emissions.
Carbon Metrics
For all equity calculations below, market capitalization represents the value of a company. For fixed income/corporate bonds calculations, instead, market capitalization is replaced with the adjusted enterprise value of a company (AEV)[11]. For sovereign bonds, market capitalization is replaced by the total national debt.
Position Ownership Ratio
Calculated as the aggregated position value / MCap or AEV or national debt.
Disclosure (Number/Weight)
Calculates the % number and % weight of companies that report reliable emissions in the Portfolio and benchmark respectively. Net performance is calculated in percentage points.
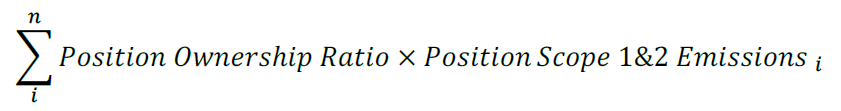
Emission Exposure
Calculated using the following formula for “scope 1&2”. The same approach is used for calculating scope 3 emissions.
![]()
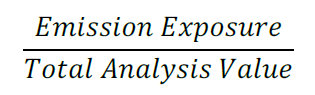
Relative Carbon Footprint
![]()
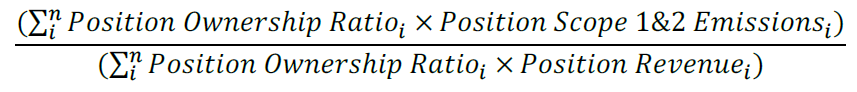
Carbon Intensity
![]()
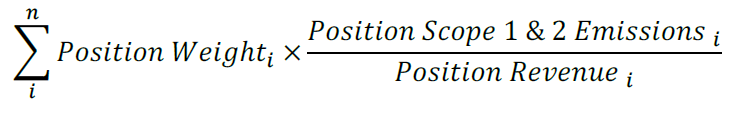
Weighted Average Carbon Intensity[12]
![]()
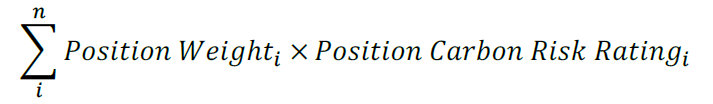
Climate Performance – Weighted Average
![]()
Carbon Risk Rating
The Carbon Risk Rating (CRR) is a comprehensive assessment of the carbon-related performance of companies, based on a combination of quantitative indicators (e.g. current intensity and trend of greenhouse gas emissions, carbon impact of the product Portfolio including revenue shares of products or services associated with positive as well as negative climate impact), forward-looking qualitative indicators (e.g. corporate policies, ongoing shift in product and services Portfolio, emission reduction targets and action plans, etc.), and a classification of the company’s absolute climate risk exposure due to its business activities.
The CRR is based on two complementary elements:
- Carbon Performance Score (CPS): a metric for the current carbon-related performance of a company as well as its capabilities to seize climate-related opportunities and manage its industry-specific climate risks in future;
- Carbon Risk Classification (CRC): a classification of a company’s individual exposure to climate change risks based on its specific industry assignment and business activities.
The Carbon Risk Rating is available for the full ISS ESG Rating Universe and assesses on a scale of 0 (very poor performance) to 100 (excellent performance) how a company deals with industry-specific climate risks both in production and in the supply chain. It allows to categorize companies according to their carbon-related performance into four groups: Climate Laggards, Climate Underperformers, Climate Performers, and Climate Leaders.
Emissions for sovereign bonds
The methodology was developed in accordance with the indications of the Platform Carbon Accounting Financials (PCAF)[13] and allows ISS ESG’s researchers to calculate the GHG emissions attributable to the governmental activities of a specific country.
A summary of the process is provided below:
- Greenhouse gas emissions data are gathered. PCAF separates emissions caused by direct government activity from emissions caused by other sectors. Emissions from government activity is attributed directly to the government[14].
- The sources of data include the sectoral greenhouse gas emissions for each country published by the United Nations Framework Convention on Climate Change (UNFCCC). This approach allocates emissions to a government using expenditure input-output data from the World Input Output Database (WIOD). To cover countries for which such data is not available, a secondary approach is used, in which a country’s greenhouse gas emissions are allocated to the government by using the government’s consumption expenditure as part of total GDP.
- The emissions are allocated to the bond based on bond investment as part of total national debt.
Scenario analysis
General approach (applies to all sectors except Utilities and Oil, which are described below)
- Break down IEA sector divisions: The IEA provides very broad sector divisions and it is thus essential to break down those sector divisions into sub-sectors that better reflect company activities. For example, the Power sector is broken down into Mixed Electricity, Gas distribution, Electric Utilities, Conventional Electricity and Alternative Electricity.
- Estimate sector revenue: This estimation includes both public and private companies. Each company is then allocated a market share based on its share of the sector revenue. For example, if a sector has a total revenue of 1 billion and a company in that sector has a revenue of 100 million the company is allocated 10% of the market share.
- Apply an expected growth rate: Since the analysis covers several decades, the sectors are expected to grow in line with the world GDP. Therefore, an expected growth rate of 3.2 % is applied to each sector and company. This is the same rate that is used by the IEA when constructing the scenarios.
- Calculate carbon budget emissions intensity: The sector carbon budget is divided by the sector revenue to get the emission intensity ton of carbon dioxide per 1,000 USD of revenue (tCO2/1,000 USD) up until 2050. This number shows how much a company can emit per revenue in a specific year to remain within a scenario carbon budget. By looking at the intensity reduction necessary per year until 2050 an average trajectory is established for the emission intensity within a sector over time.
- Calculate expected emission intensity per year: The emissions calculated in Step 4 are divided by the company’s revenue to obtain the expected emission intensity per year. If the intensity is in line with, or below the required sector intensity for the scenario, the company is considered aligned. If not, the company is considered unaligned. Depending on the sector and the scenario, the alignment can change over time. For example, a company can be aligned 2018 to 2025 but then be unaligned from 2025 onwards. If a company has committed to an SBT, this will positively influence its trajectory path within a 2 degrees scenario.
Utilities: In the case of electric utilities, the analysis is based on carbon intensity per generated output, tCO2e/GWh, in relation to the total world output. Market share is decided based on company generation in relation to total world production of electricity. The IEA scenarios include the energy mix necessary to generate electricity in line with the different scenarios. Regional consideration is taken based on the utilities’ country of incorporation. If a utility is located in the EU, the EU specific energy mix for the scenarios will be used to assess scenario alignment. A utility with a carbon intensity aligned with the scenario is considered on track. A utility with a carbon intensity above that necessary to stay in line with the scenario is unaligned.
Oil: Similar to utilities, oil companies’ market share is estimated based on the company’s reserves in relation to total world reserves. For example, if a company has produced 2% of the world output in a certain year, they are assigned 2% of the market share. The IEA scenarios present the amount of oil that can be combusted to stay within a certain scenario. If world production exceeds this amount, every company in the oil sector needs to reduce their production to become aligned. If world production of oil is 110 barrels and the amount of oil that can be combusted in the 2 degrees is 100 barrels, the difference between the scenario and the sector is 9%. Thus, all companies within the sector need to reduce their production by 9% to remain within the scenario. Future production is estimated based on historical data.
Physical Risk Assessment
The two donut charts sum the weight in the Portfolio per GICS sector. The colours of the sections indicate the aggregated sector-based physical risk score of the companies in the benchmark according to the following logic:
- Red: High Risk
- Yellow: Medium Risk
- Green: Low Risk


 – SICAV")