
This document provides a summary of the Climate Impact Report prepared by ISS ESG[1] , which is based on its proprietary methodology and relating to the holdings of the funds in Etica Sgr’s Valori Responsabili investment line (hereafter referred to as “the portfolio”). The report incorporates metrics that comply with the Task Force on Climate-related Financial Disclosures’ (TCFD [2]) guidelines.
All asset classes were analysed in accordance with the TCFD recommendations and grouped into two components: Equity Portfolio (including unlabelled equities and corporate bonds) and Sovereign Bond Portfolio (comprising only unlabelled sovereign securities).
Green bonds were excluded from the calculation of issuers’ emissions, as the proceeds are allocated exclusively to the financing of environmental projects. The TCFD analysis measures the contribution of each issuer to greenhouse gas emissions based on its weight in the portfolio, so that the correct share of emissions can be attributed to Etica’s investment. Including green bonds in this calculation would increase the weighting of the relevant issuer in the portfolio, and consequently the emissions financed. This would distort the results. A separate assessment of the use of proceeds from both corporate and sovereign green bonds is available in the report.
This illustrates the climate performance of the portfolio as of 30 December 2025 and compares it with that of the MSCI World Universal Net Total Return Index (hereinafter referred to as “the benchmark”), which is used as the market benchmark as of 31 December 2025.
The content is divided into the following sections: carbon metrics, scenario analysis, transition risk analysis, physical risk analysis, corporate green bonds, sovereign emissions analysis, conclusions.
- Corporate carbon metrics
- Scenario analysis
- Physical risk analysis
- Transitional Risk Analysis
- Corporate Green Bonds: use of proceeds analysis
- Analysis of sovereign emissions
- Sovereign green bonds: use of proceeds analysis
- Conclusion
Corporate carbon metrics
The carbon metrics used in the corporate analysis are those recommended by the TCFD and are defined as follows:
- Emissions Exposure – How much emissions am I responsible for as an investor?
Measures the portfolio’s ‘financed’ or ‘owned’ emissions, including Scope 1, 2 and 3. Represents the absolute amount of emissions attributable to investments in the portfolio.
- Relative Carbon Footprint – For every million invested, what is my emissions exposure?
Measures the emissions financed for every million euro invested, applying the principle of ownership. It is expressed in tonnes of CO₂ equivalent per million euro invested and is an impact risk metric.
- Carbon Intensity – How efficient are the companies I invest in in terms of emissions?
It calculates the portfolio’s emissions in relation to the revenues generated by the issuers. It is obtained by dividing the portfolio’s financed emissions by ‘owned’ revenues and is expressed in tonnes of CO₂ equivalent per million euro of revenues. It measures the risk associated with the operational performance of companies.
- Weighted Average Carbon Intensity (WACI) – What is my exposure to high-emission investments?ù
It assesses the portfolio’s exposure to carbon-intensive companies. Unlike financed emissions, this metric does not apply the ownership principle but considers the weighted average emissions per million euros of revenues of the issuers in the portfolio. It is expressed in tonnes of CO₂ equivalent per million euros of revenues and is a transition risk indicator.
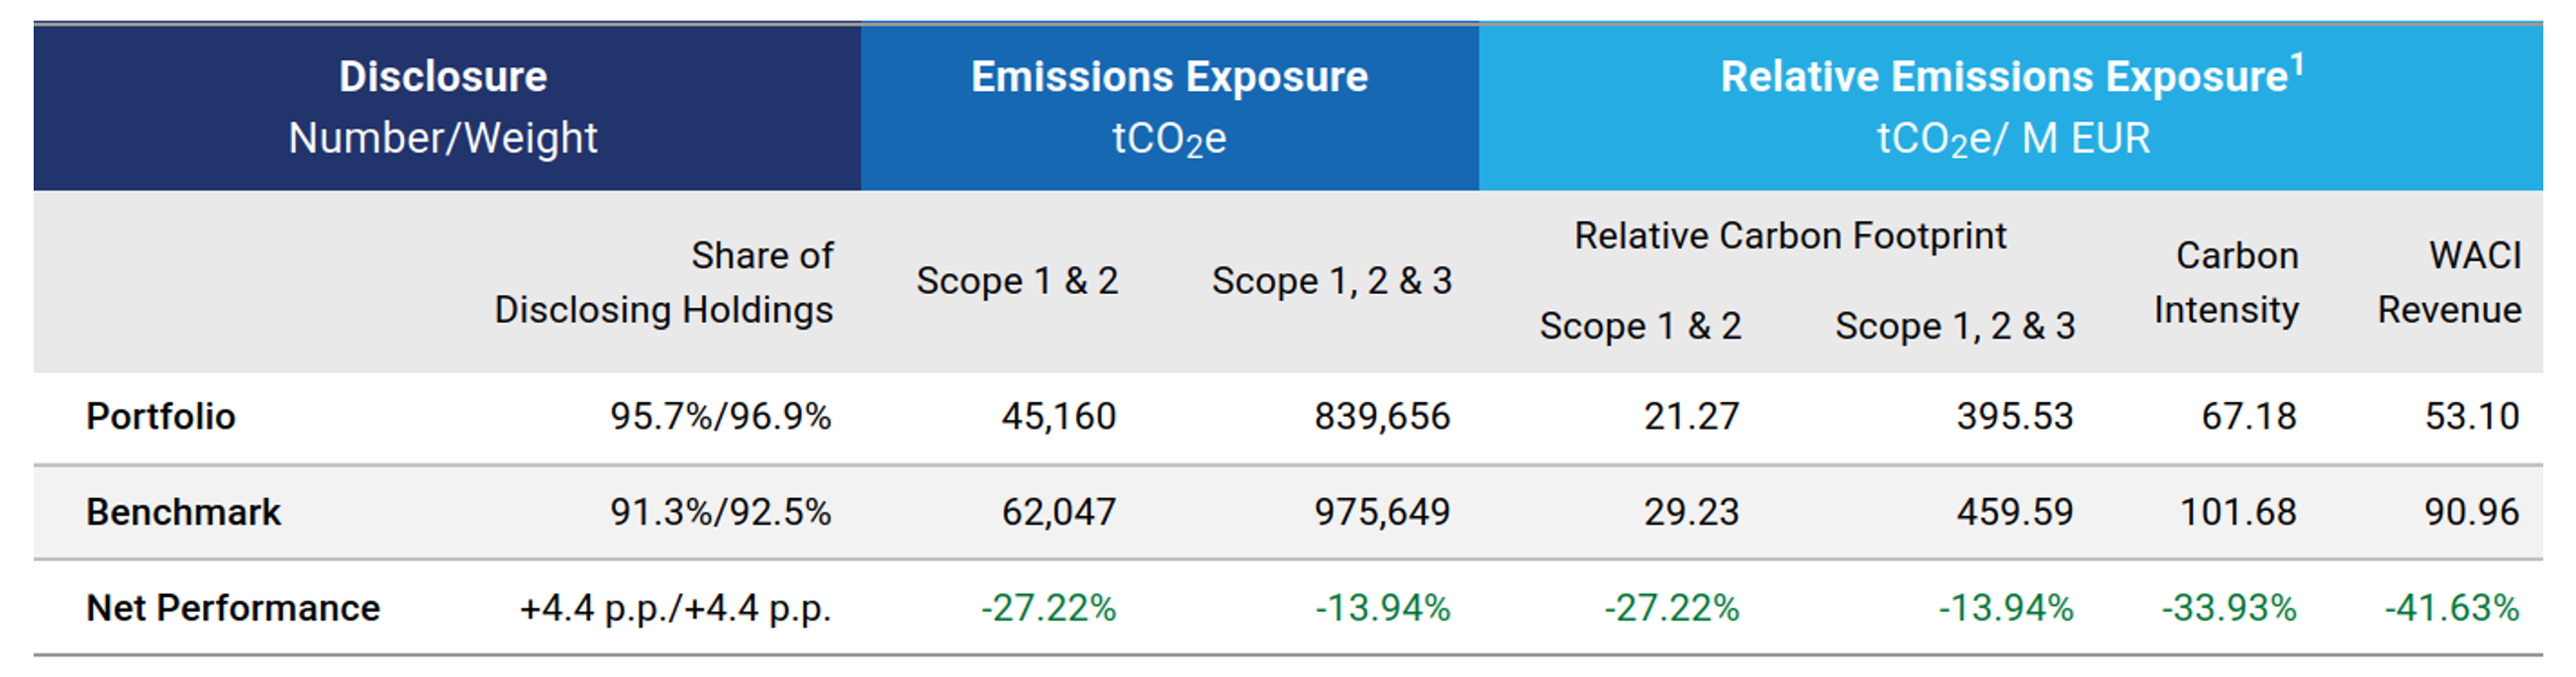
The portfolio outperforms the benchmark in all metrics analysed:
- -27.22% carbon footprint (Scope 1 & 2), indicating lower emissions per million invested, and –13.94% when Scope 3 is also considered;
- -33.93% carbon intensity, indicating greater efficiency: the companies in the portfolio generate fewer emissions per unit of revenue;
- -41.63% WACI, reflecting the portfolio’s lower exposure to sectors characterised by high emissions intensity.
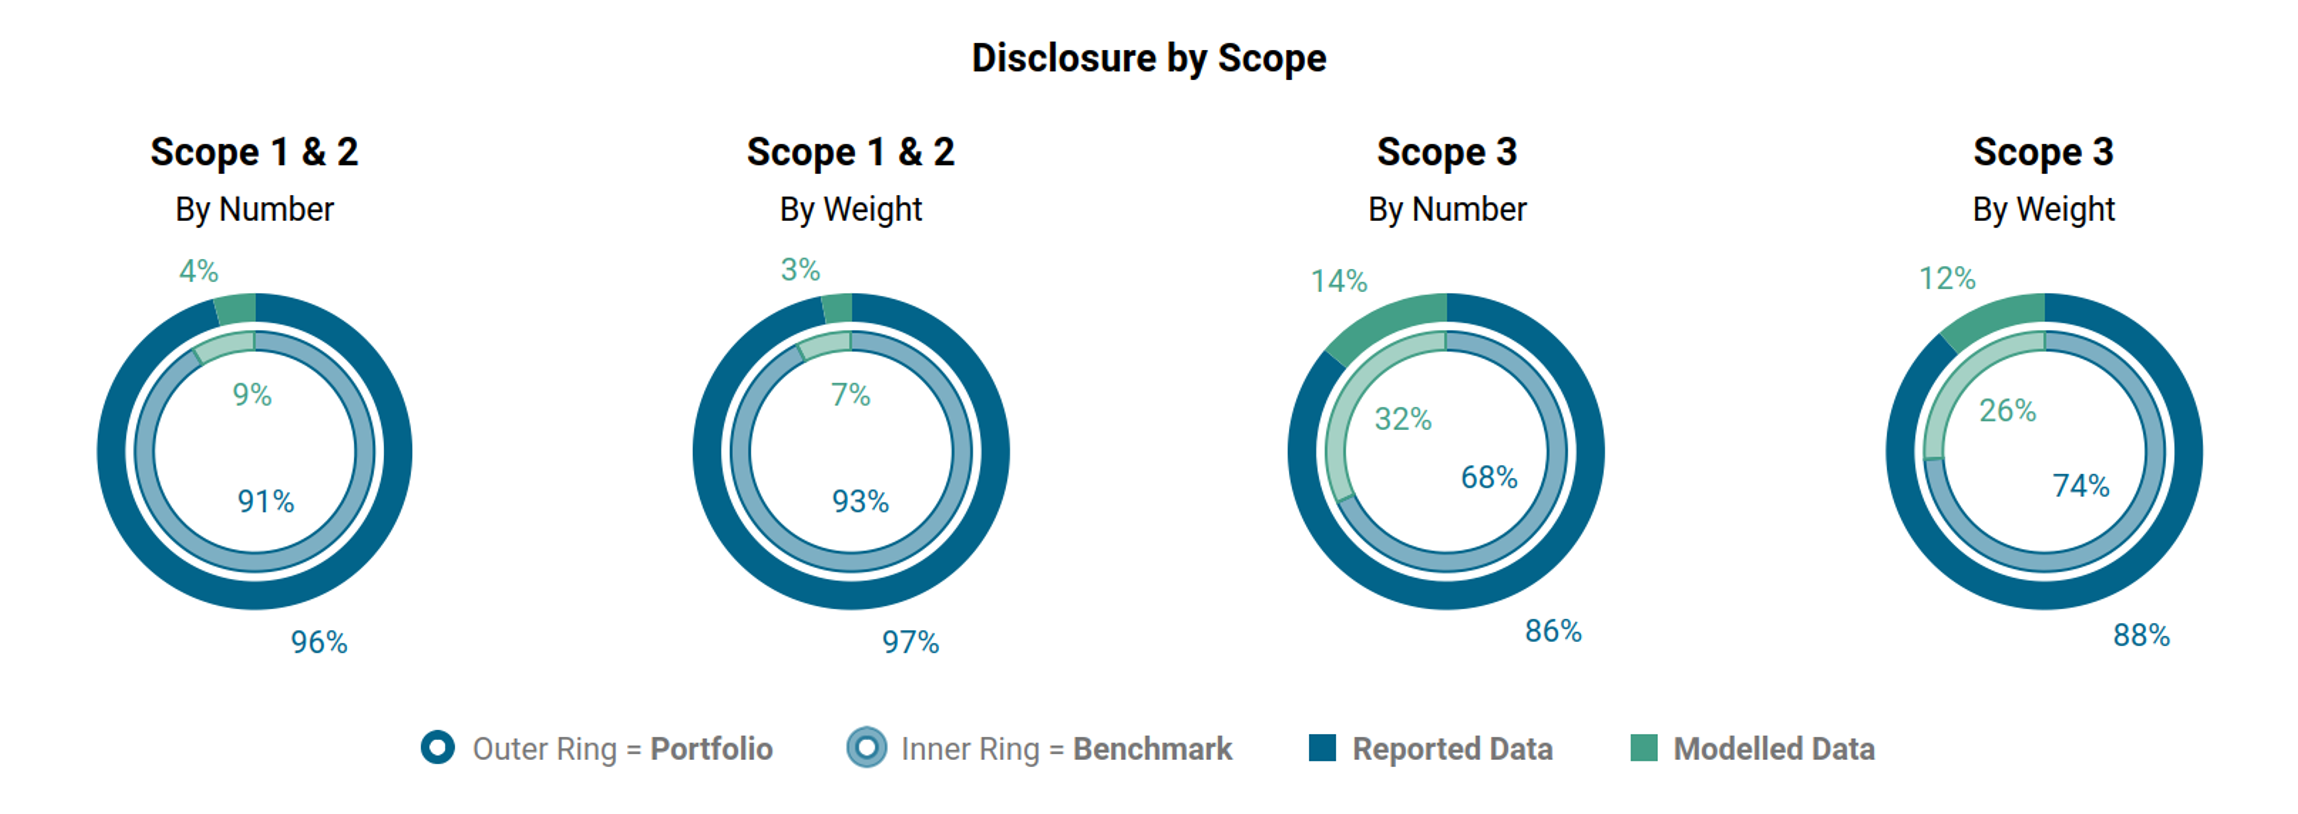
Moreover, it is also worth noting that a higher share of companies in the portfolio disclosed their emissions compared to the benchmark. This means that our analysis relies more on reported data and less on estimates, resulting in greater transparency. Scope 3 emissions remain particularly challenging, especially for US issuers, partly because disclosure is not mandatory in the United States.
As stated, this year, we excluded green bonds from the climate analysis because, by definition, they finance environmentally sustainable projects and should not contribute to the fund’s financed emissions. When green bonds are included, the portfolio amounts to €2.3 billion; when excluded, €2.1 billion. Given their very limited exposure – around €2 million – their inclusion or exclusion has only a negligible effect on the results. In fact, the emissions figures obtained using the two approaches (with and without green bonds) are almost identical; therefore, we will not examine this issue in further detail in this section.
In general, these results are positive for Etica and show an improvement compared to last year. The main drivers are:
- changes in the portfolio composition due to Etica Sgr’s selection methodology and asset‑manager decisions;
- improvements in issuers’ emissions intensity.
1) Changes in the portfolio composition
When analysing how emissions are allocated, Etica’s impact becomes clearer. The table below compares the portfolio’s Scope 1 and 2 emissions with those of the benchmark and breaks down the differences into two components:
- Sector Allocation: how much of the difference is due to overweighting or underweighting specific sectors;
- Issuer Selection: how much is attributable to selecting issuers that are more or less emissions‑intensive.
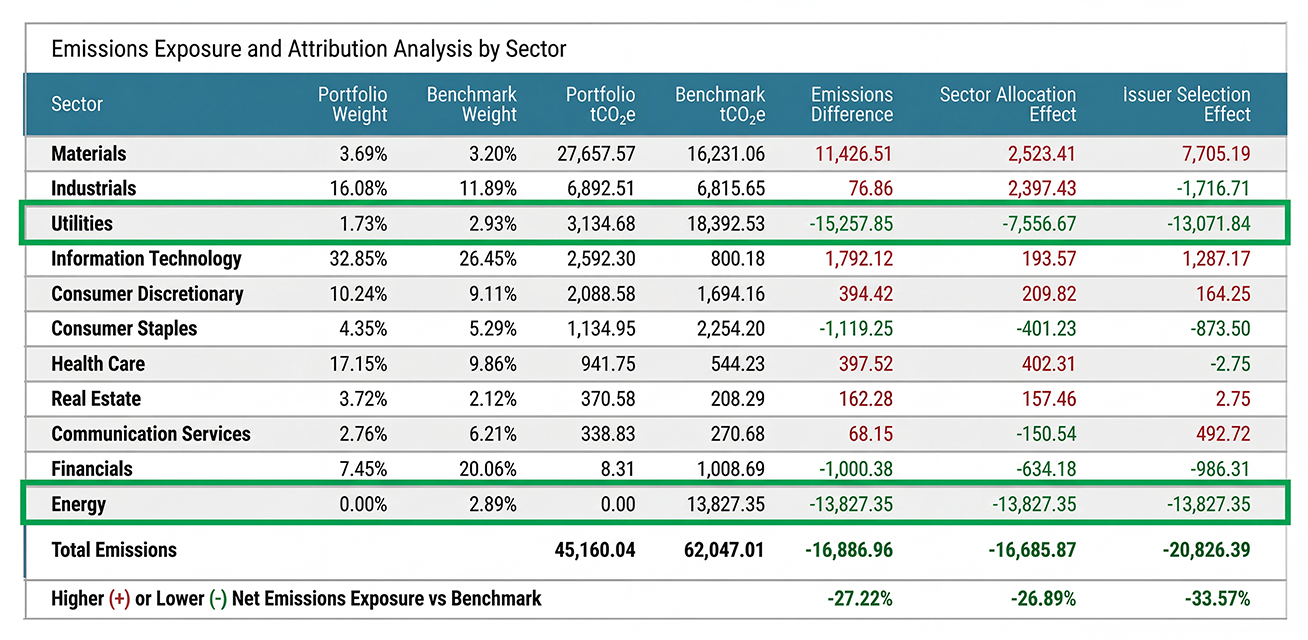
The portfolio has -16,886.96 tCO₂e (-27.22%) fewer total emissions than the benchmark.
Attribution effects show that this improvement stems from:
- Sector Allocation: -26.89%, meaning the portfolio is underexposed to more carbon‑intensive sectors.
- Issuer Selection: -33.57%, meaning the portfolio favours issuers that are less emissions‑intensive than their peers [3].
A portfolio with a larger allocation to emissions‑intensive sectors will naturally exhibit higher GHG exposure. However, this effect can be mitigated by selecting less emissions‑intensive issuers within the same sector. In particular, the methodological choice to avoid investments in the energy sector and to apply rigorous climate assessments to companies involved in fossil‑fuel activities – primarily in the utilities sector – largely explains the improvement observed.
Looking again at the table, the Materials sector is where the portfolio shows the greatest exposure to Scope 1 and 2 emissions relative to the benchmark. This can be explained by several structural factors:
- the strict methodology applied to the sector significantly reduces the investable universe, leaving only a very small number of issuers compatible with sustainability criteria. With such a limited universe, it is inevitable that some “eligible” holdings become overweight relative to the benchmark, increasing emissions exposure;
- the Materials sector is, by definition, hard to abate, characterised by production processes difficult to electrify and by immature decarbonisation technologies; even when strict criteria are applied, remaining issuers still have relatively high emissions.
In contrast, the opposite is true for the Utilities sector. The availability of well-established decarbonisation technologies, such as renewable energy generation, enables more efficient emitters to be identified and selected. This has a positive attribution effect in the utilities sector, which explains why the portfolio outperforms the benchmark — the opposite effect is seen in other sectors.
The same logic can be applied to Scope 3 emissions, which in this portfolio are largely driven by the industrial sector.
2) improvements in issuers’ emissions intensity.
One of the most significant factors underlying these results was the improvement in issuers’ emissions performance. Even if the investable universe had remained unchanged between 2024 and 2025, changes in emissions data alone would have led to a 21% reduction in emissions intensity. Portfolio turnover—that is, the inclusion and exclusion of issuers for ESG or financial reasons—contributed a further 3% reduction.
Overall, 85% of the reduction in emissions by 2025 is attributable to improvements made by issuers, whilst 14% is attributable to the selection of issuers based on ESG and financial criteria.
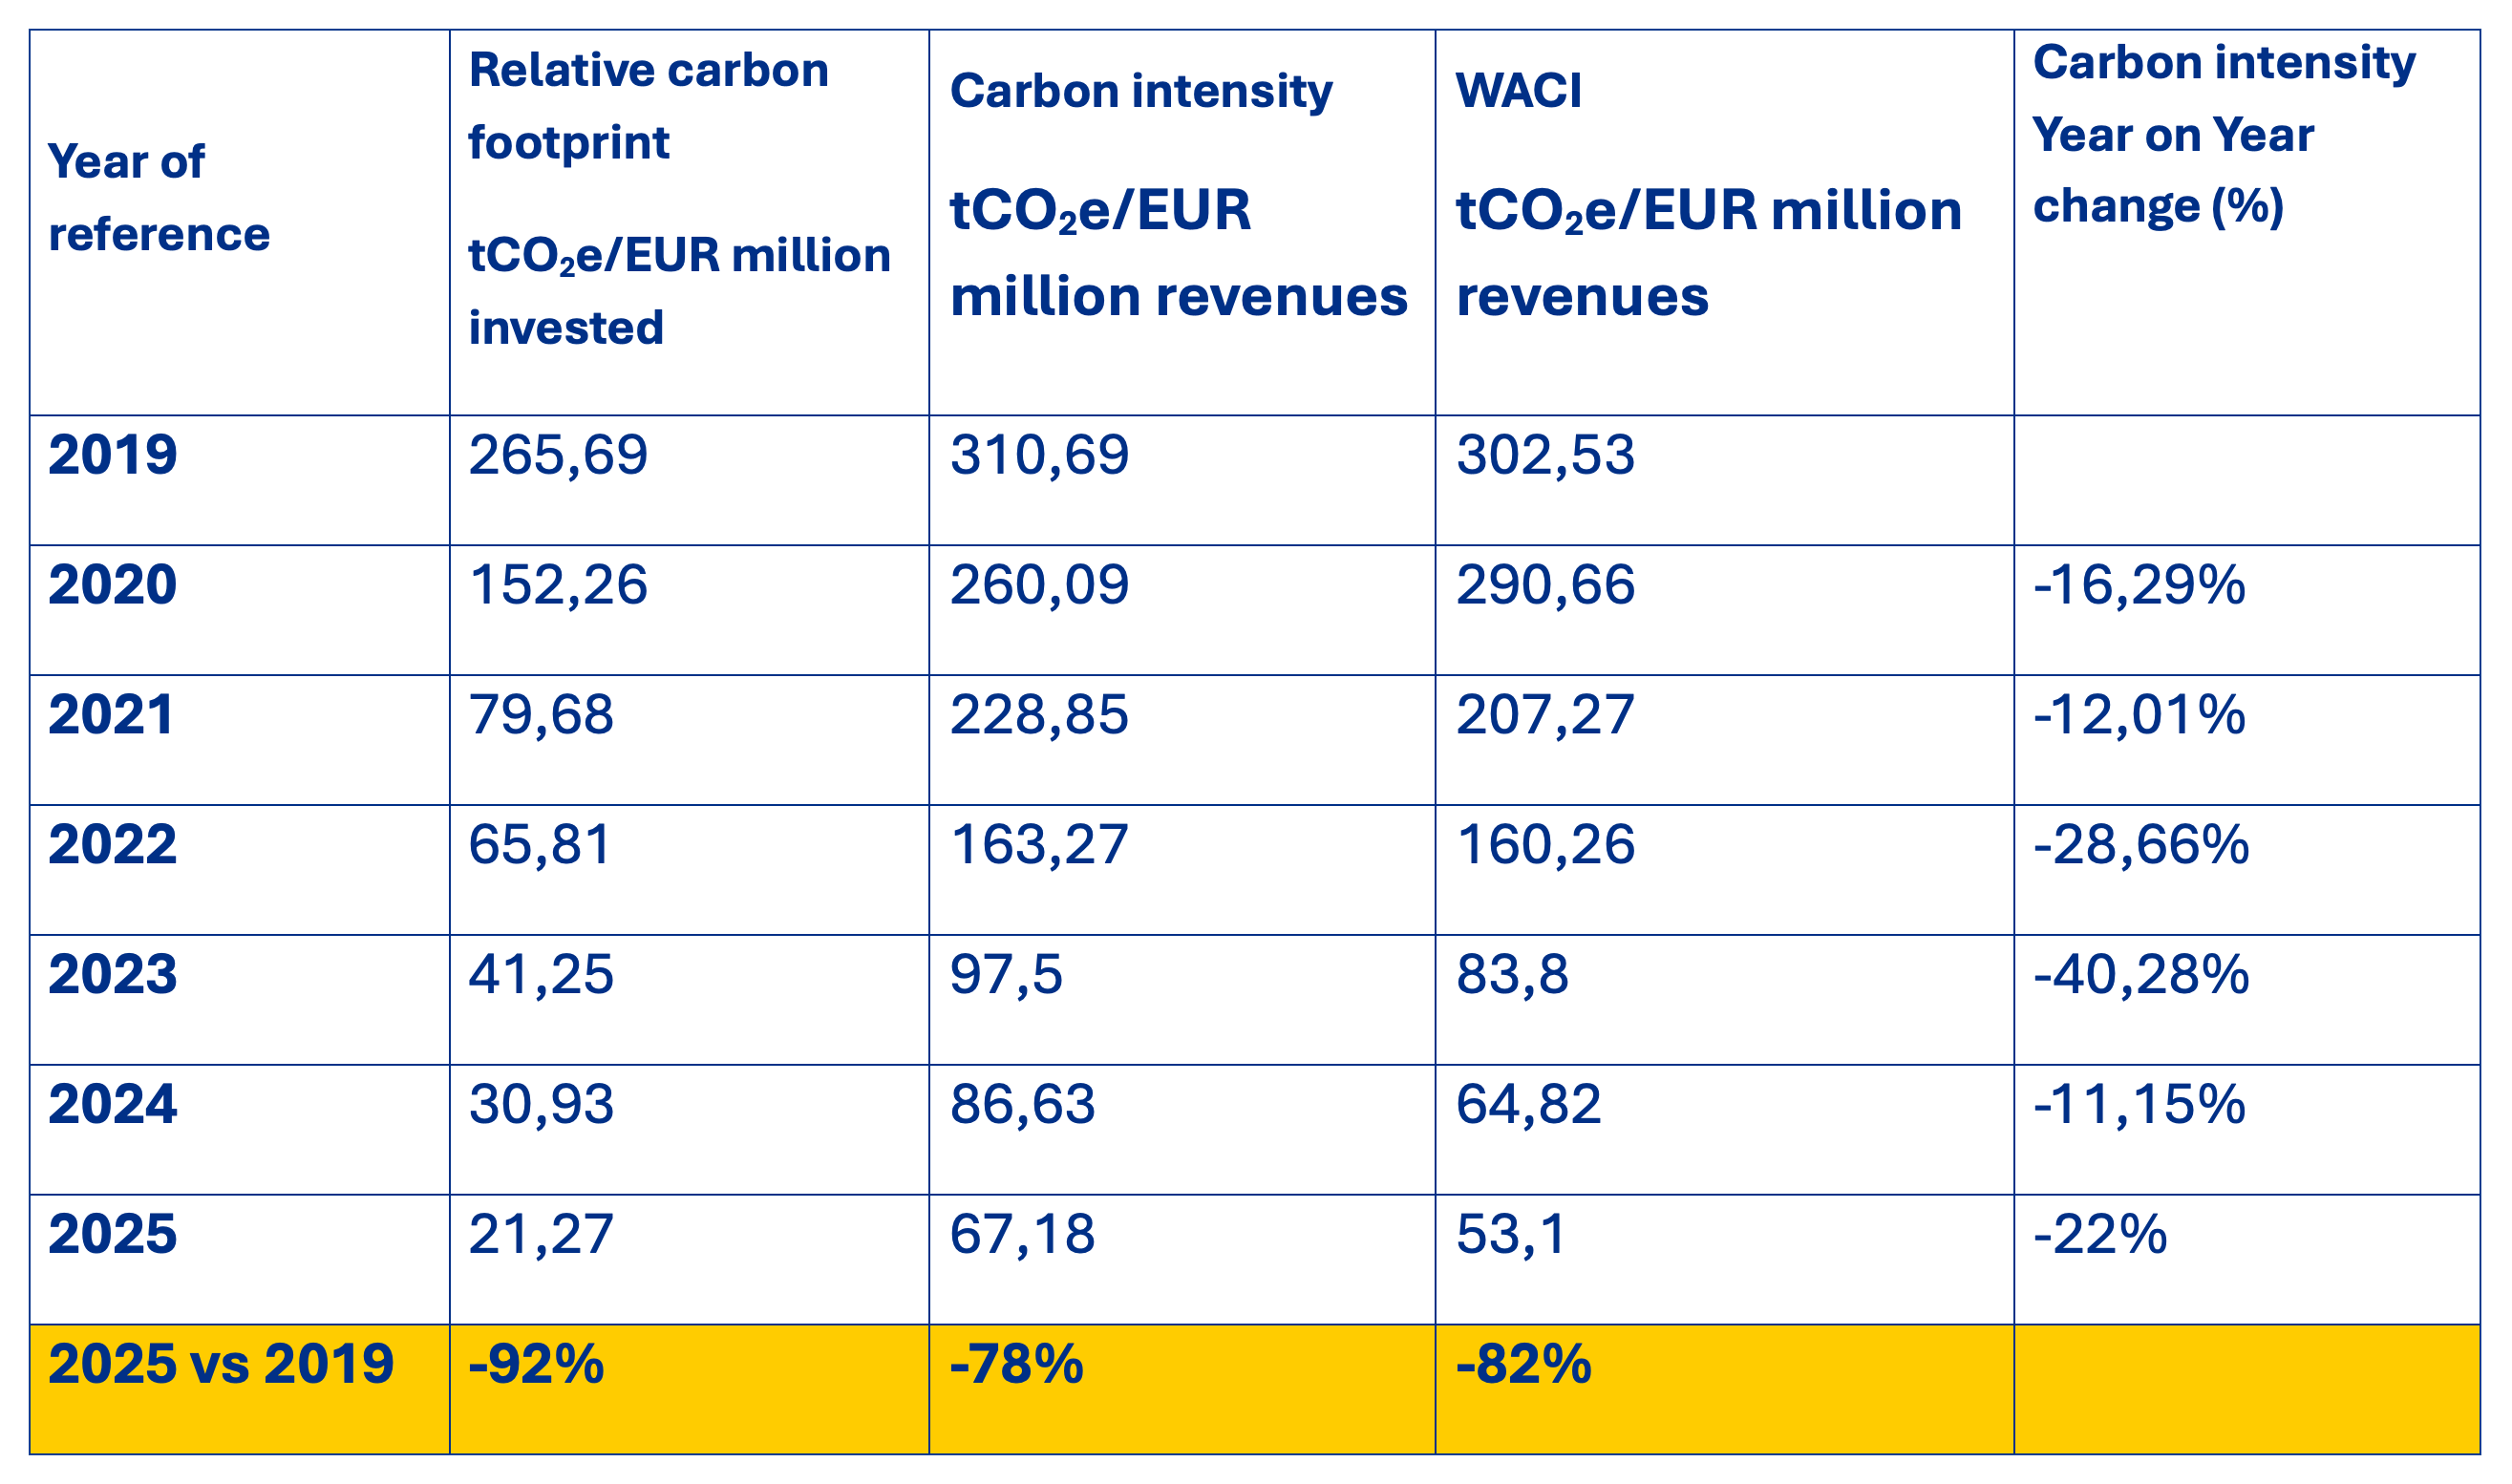
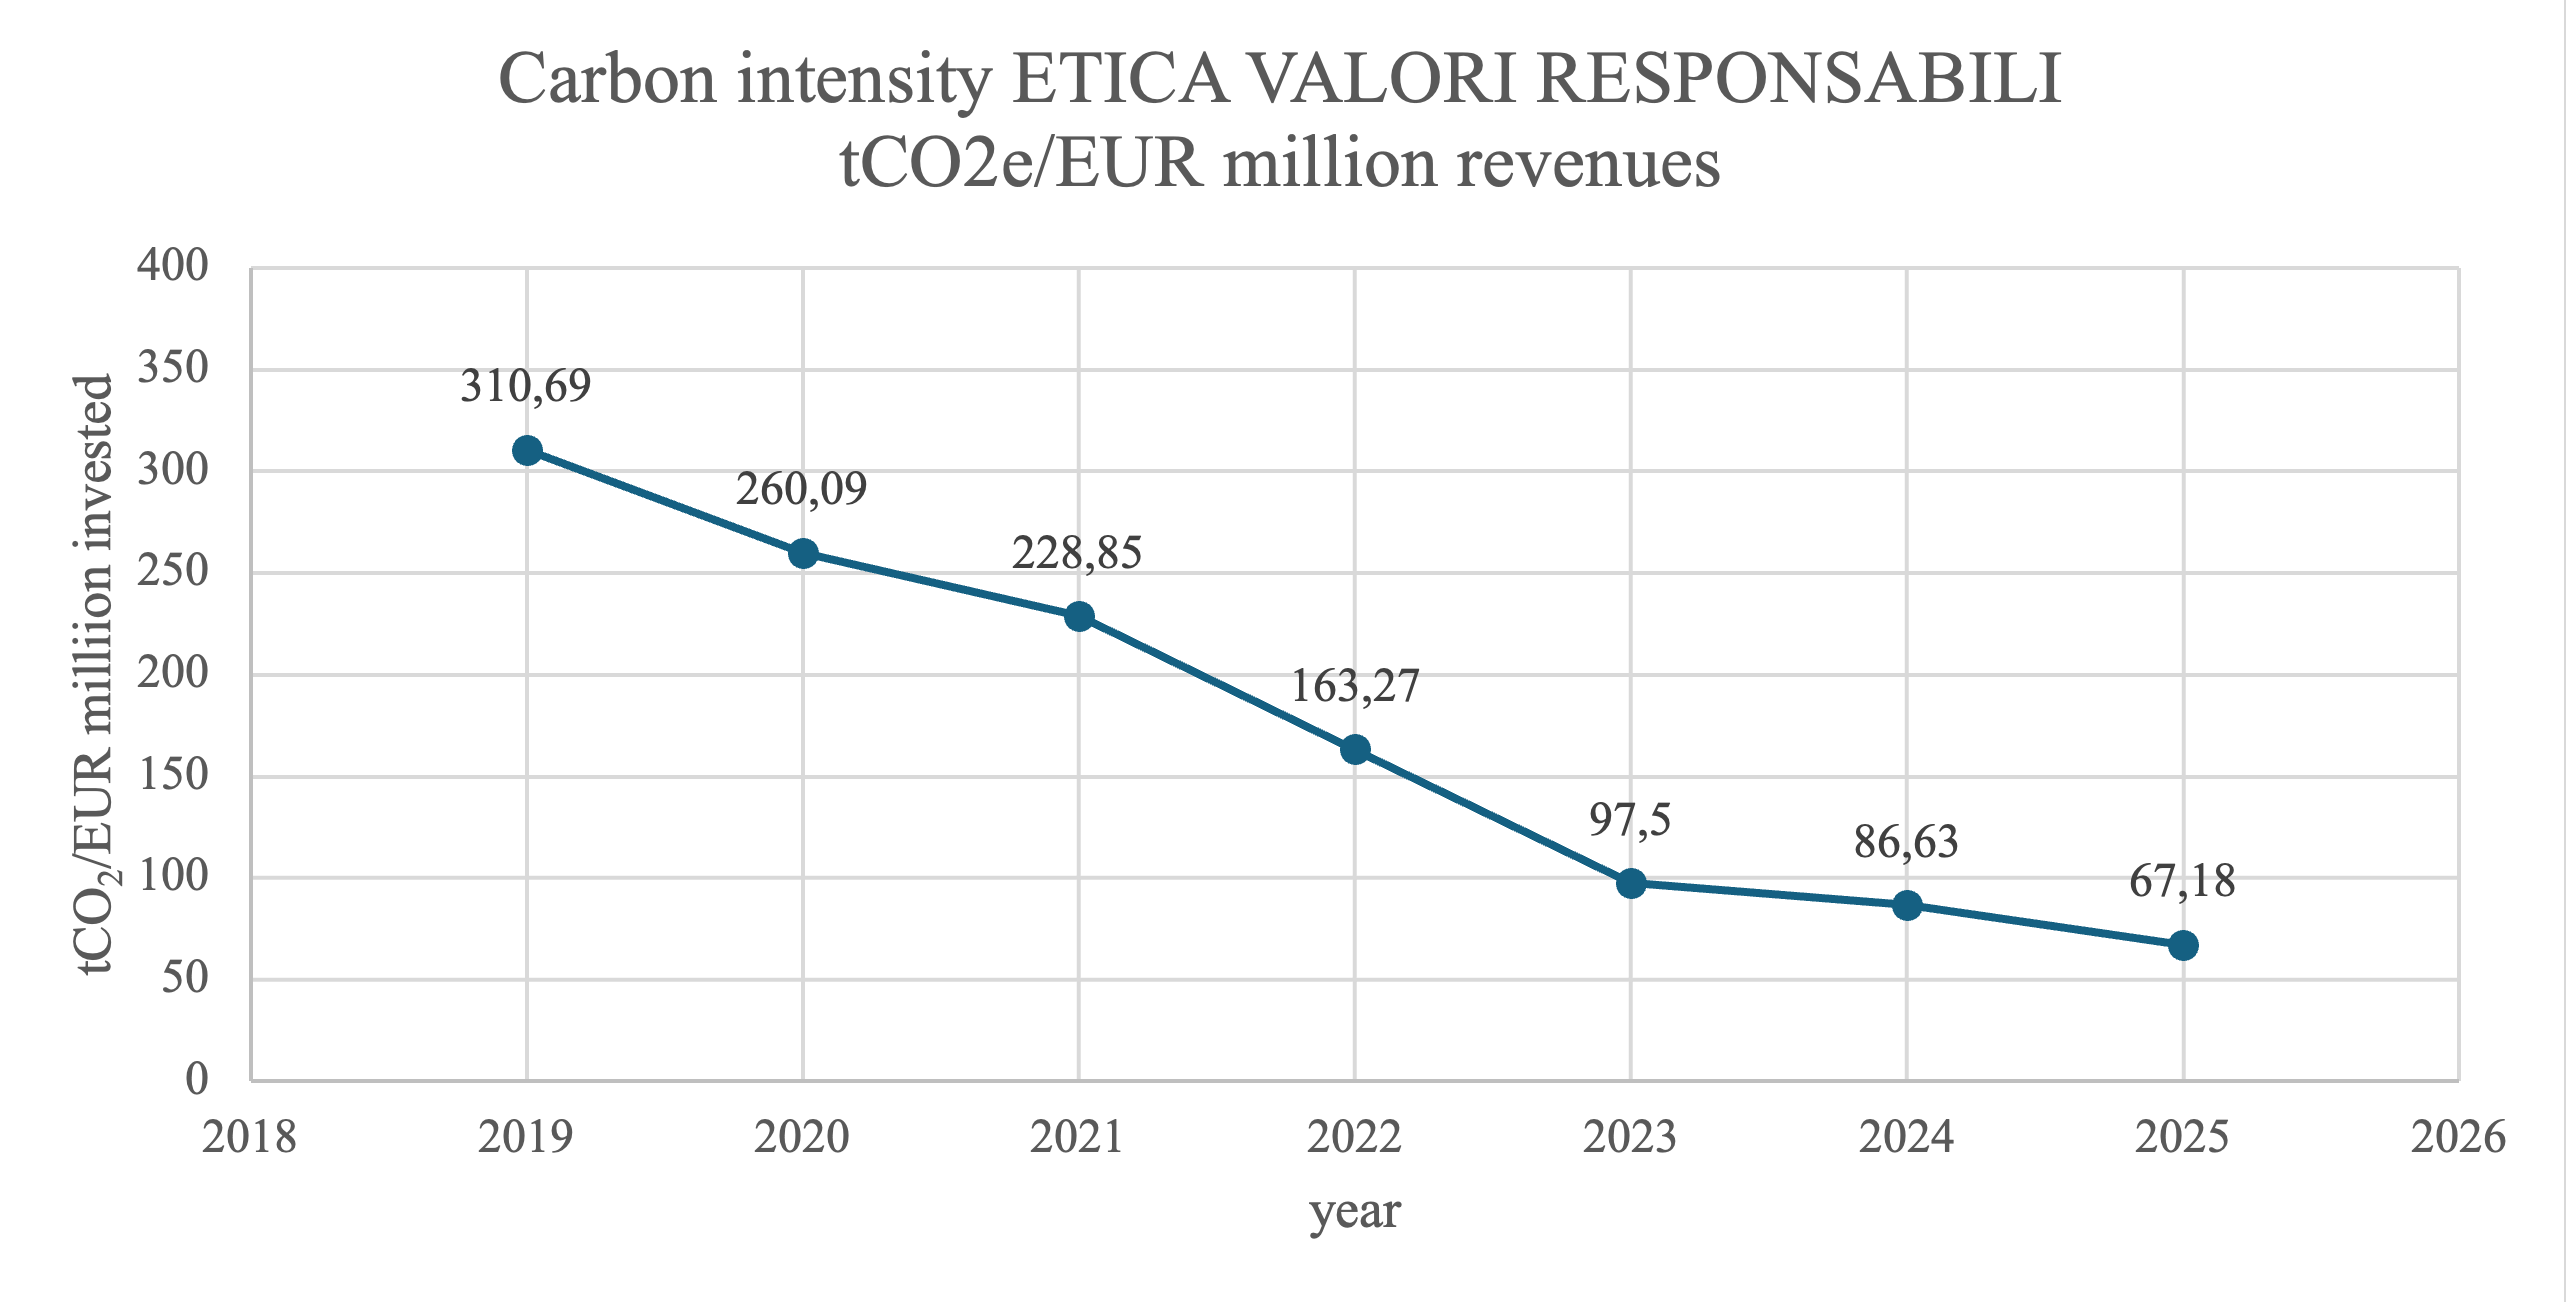
Finally, it is important to highlight the substantial decline in the portfolio’s carbon metrics since 2019.
Scenario analysis
The scenario‑alignment analysis provides a forward‑looking perspective on the portfolio’s compatibility with different climate futures, comparing the Scope 1, 2 and 3 emissions of the portfolio companies with carbon budgets derived from international climate scenarios. The methodology draws on sectoral and regional emissions pathways developed by models such as those of the IEA, NGFS and OECM. In continuity with previous years, Etica reports the results based on the IEA models. The scenarios cover a wide range of potential global‑warming trajectories, from 1.5°C to above 3°C.
The chart illustrates three emissions trajectories: the Historical Projection, which extrapolates past reported emissions into the future; the Policies Projection, which reflects the expected evolution of sectors under currently implemented climate policies; and the Target Projection, which incorporates the emissions‑reduction targets publicly committed to by the companies in the portfolio. These trajectories are then compared with the carbon budgets associated with different climate scenarios.
The alignment of the portfolio and benchmark with Net Zero scenarios is assessed using two metrics: the Implied Temperature Rise (ITR), which indicates the temperature outcome associated with the portfolio’s use of its carbon budget, and the Crosspoint Year, i.e., the year in which cumulative emissions would exceed the allocated carbon budget. Both metrics rely on comparing projected cumulative emissions with the total carbon budget consistent with a decarbonisation pathway to 2050.
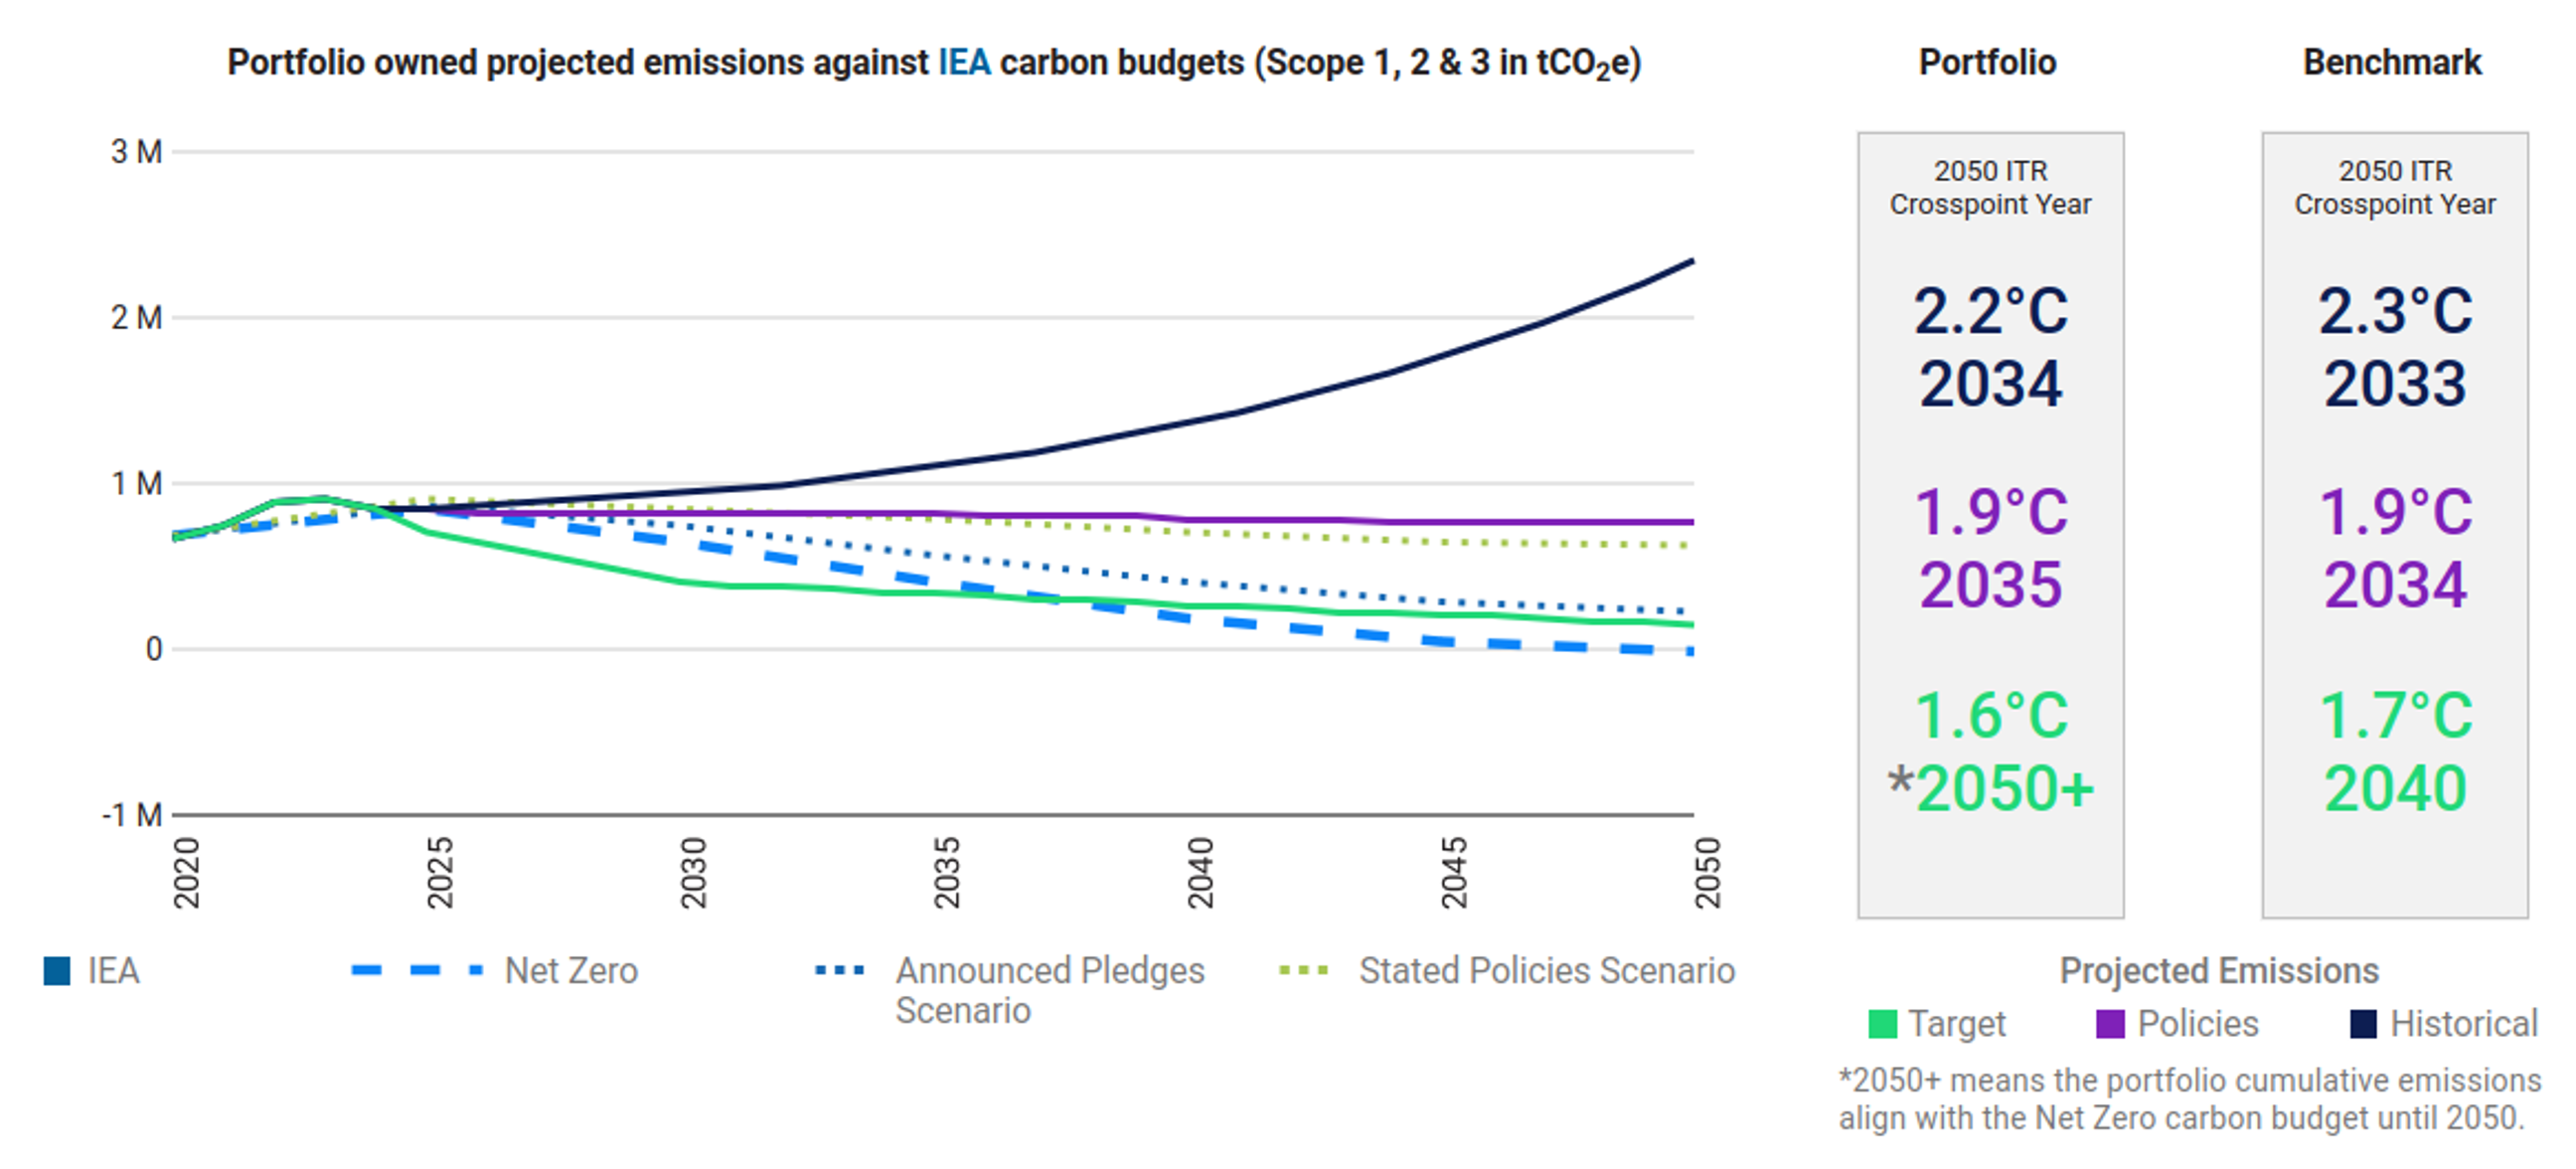
Overall, the results are positive. The portfolio outperforms the benchmark both under the target‑based trajectory and under the historical trajectory, indicating greater forward‑looking climate resilience.
The Target Projection shows that, if all companies in the portfolio were to fully achieve their stated emissions‑reduction commitments, the portfolio’s emissions pathway would be consistent with approximately 1.6°C, therefore aligned with a Net Zero trajectory.
The Historical Projection, on the other hand, indicates that the actual pace of emissions reduction achieved to date is not yet sufficient: if historical trends were maintained, the portfolio would follow a pathway of around 2°C, highlighting the need for an acceleration in decarbonisation efforts.
The Policies Projection provides an intermediate outcome (around 1.9°C). By reflecting the impact of currently implemented climate policies, it shows that regulatory and sector‑level drivers already in place would improve the trajectory relative to history, suggesting that achieving corporate targets is ambitious but feasible.
In addition, when analysing issuer targets, Etica continues to invest in a larger share of companies with climate commitments compared to the benchmark.
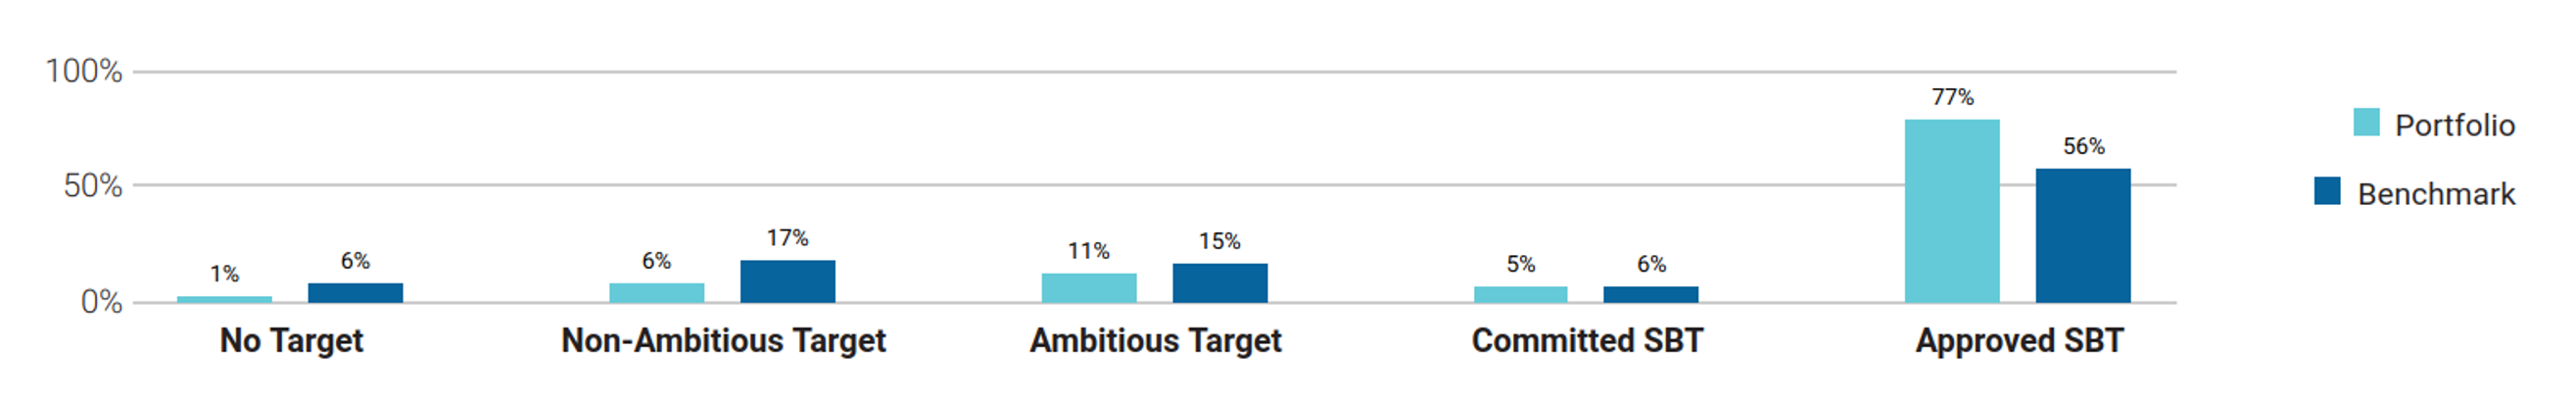
As of 31 December 2025, according to ISS, 93% of the portfolio’s value is either committed to or has already set a climate target, compared with 77% for the benchmark. Specifically, 77% of the portfolio’s value (up from 76% in the last TCFD report) has already set a greenhouse gas reduction target approved by the Science‑Based Targets initiative (SBTi), compared with 56% of the benchmark. Notably, only 7% of the portfolio companies have no target or have set a target considered unambitious in terms of greenhouse gas emissions.
Physical risk analysis
ISS uses a proprietary model to estimate the potential value losses for issuers arising from physical climate risks, calculating the Value at Risk (VaR) expected by 2050. The model assesses the financial impact of the main channels through which physical risks can affect share prices: changes in the value of fixed capital (PP&E), repair costs following extreme weather events requiring additional CAPEX, increases in operating costs linked to changes in SG&A or COGS, and revenue impacts due to production disruptions or reductions.
The analysis is based on the climate scenarios used in the IPCC Fifth Assessment Report (AR5) [4]. The primary reference scenario is RCP 4.5, which corresponds to an expected temperature increase between 1.7°C and 3.2°C by 2100.
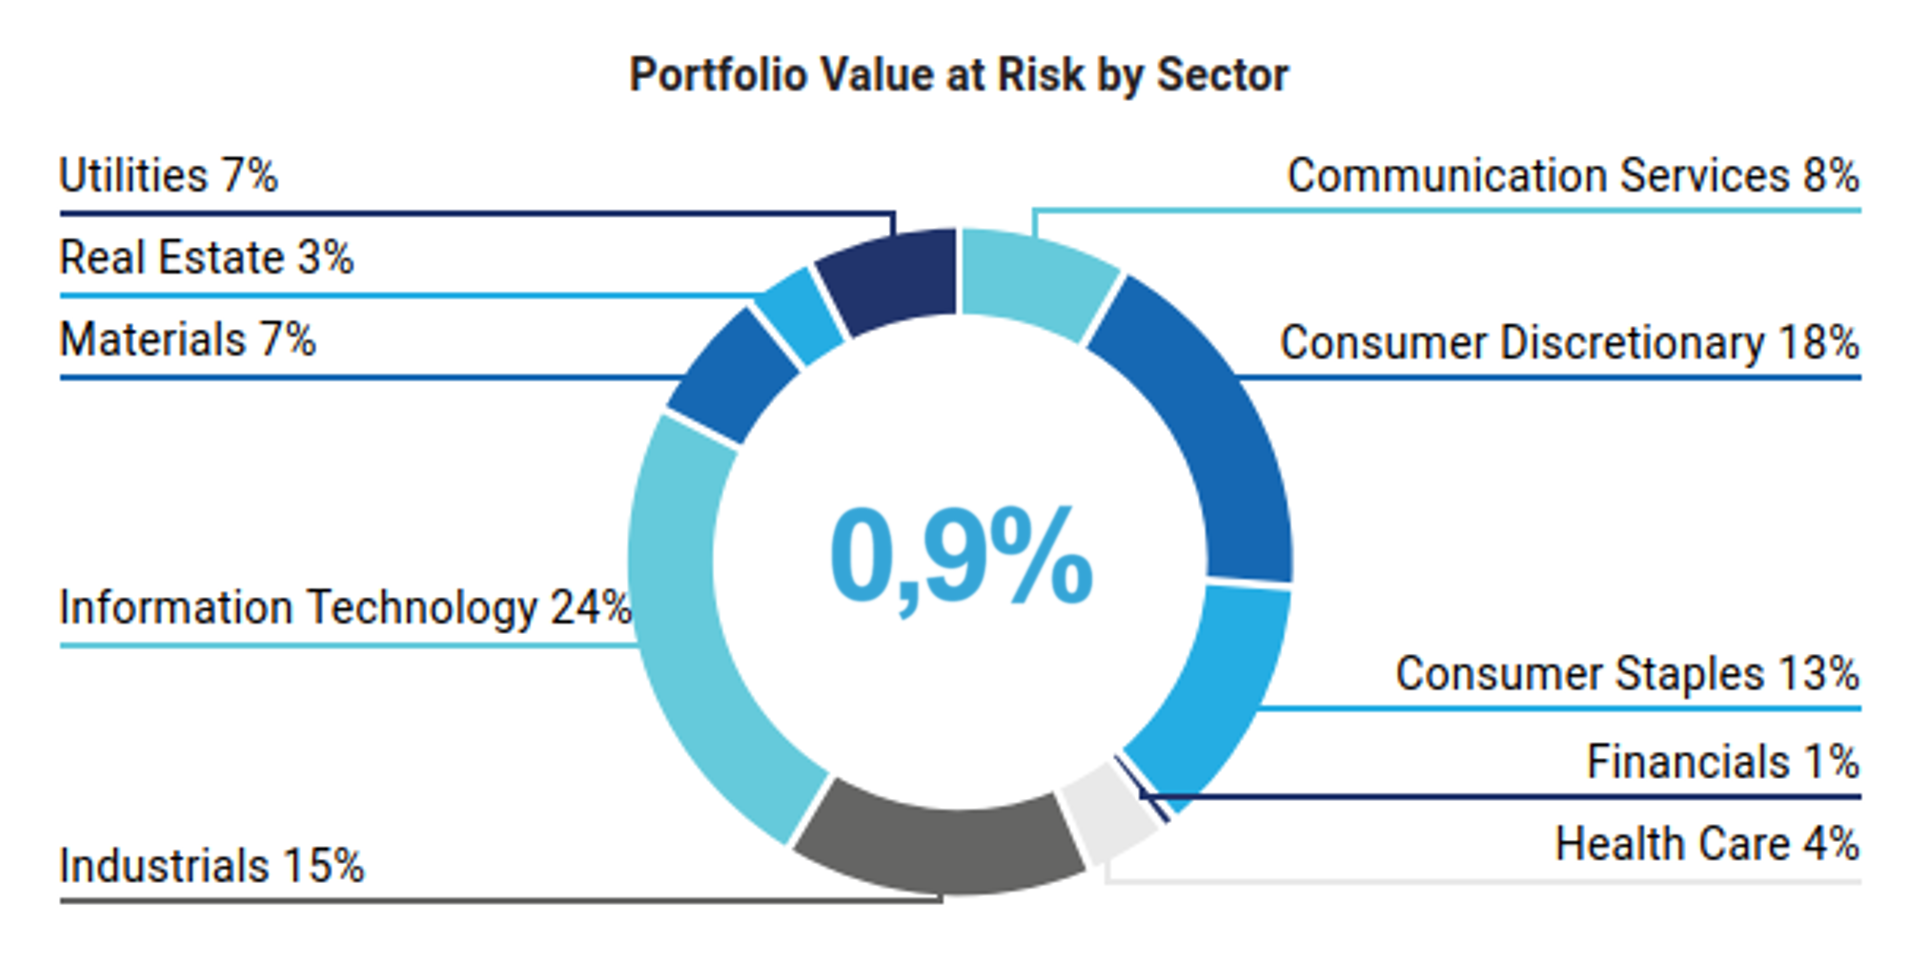
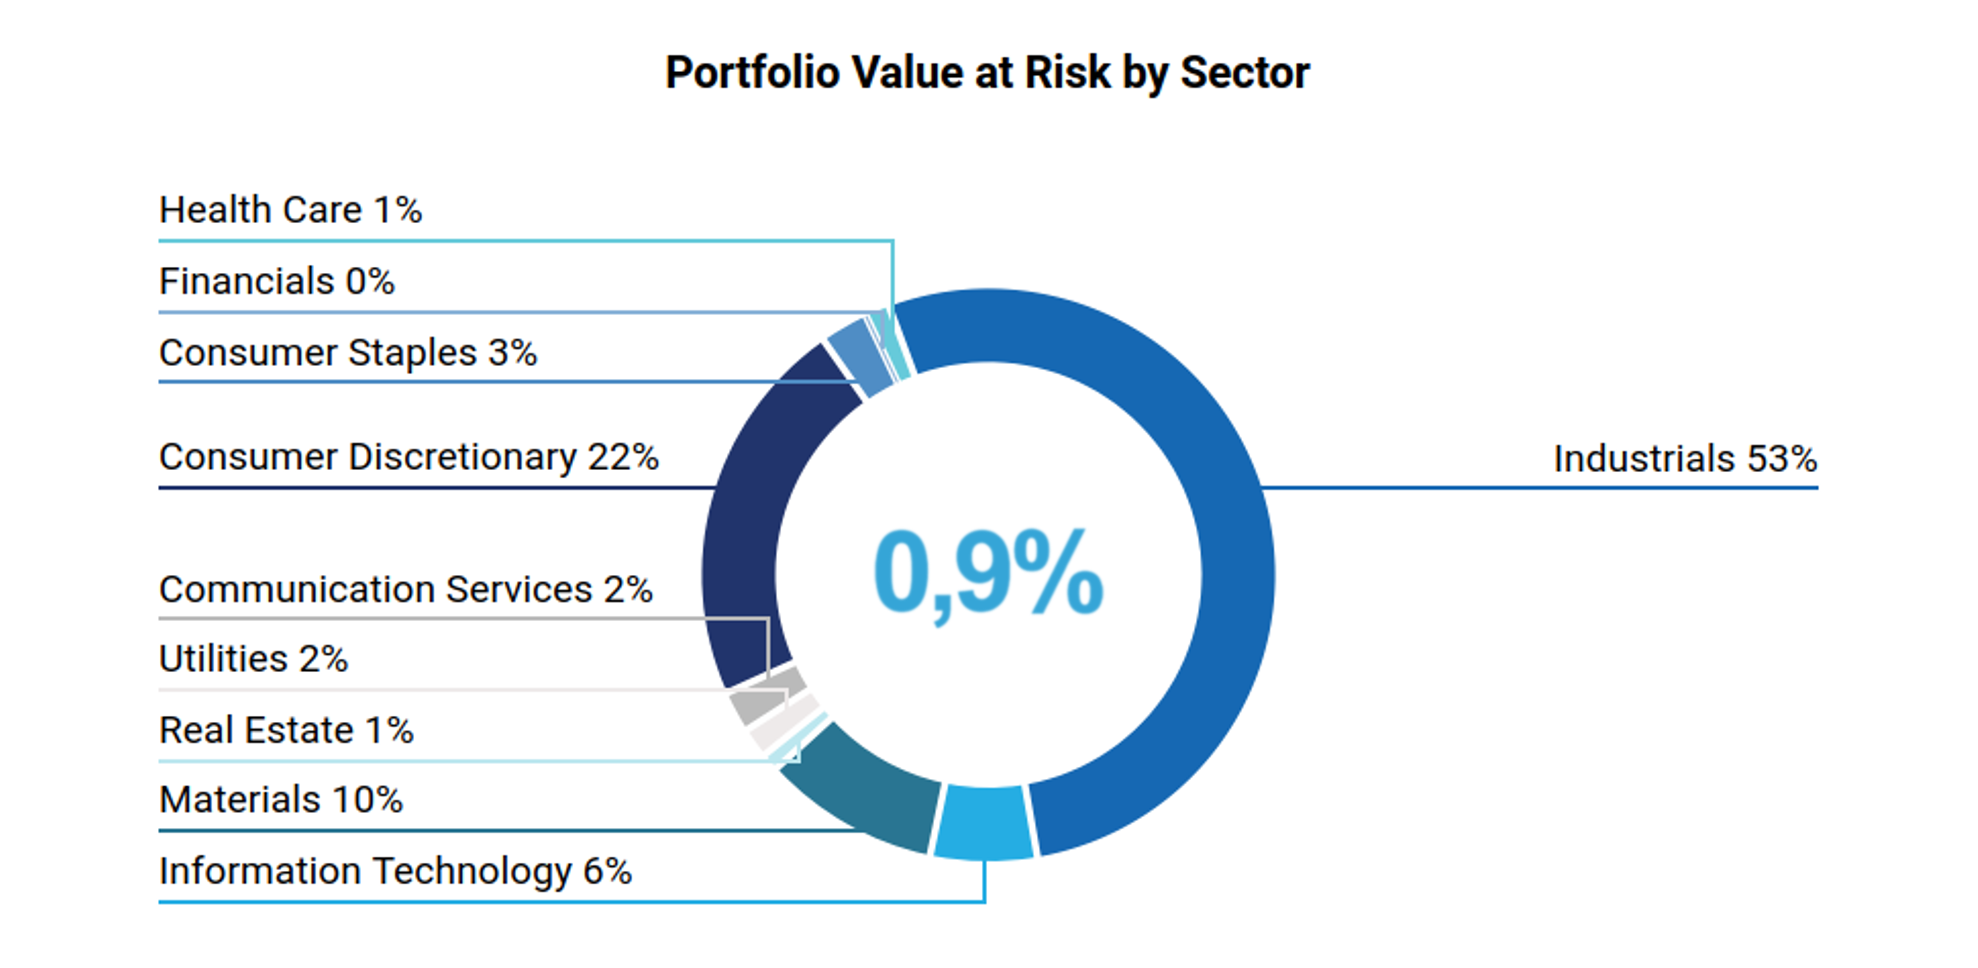
Under this scenario, the portfolio’s VaR to 2050 is estimated at approximately €18.8 million, with Consumer Discretionary, Information Technology and Industrials being the most exposed sectors. The overall impact remains below 1% of the total portfolio value, consistent with the results of the 2025 analysis.
Under a more severe scenario – corresponding to warming above 3.2°C – the VaR increases to around 1.1% of AUM. This confirms that worsening climate conditions lead to proportionally higher potential losses, while still remaining within a manageable magnitude relative to the total portfolio value.
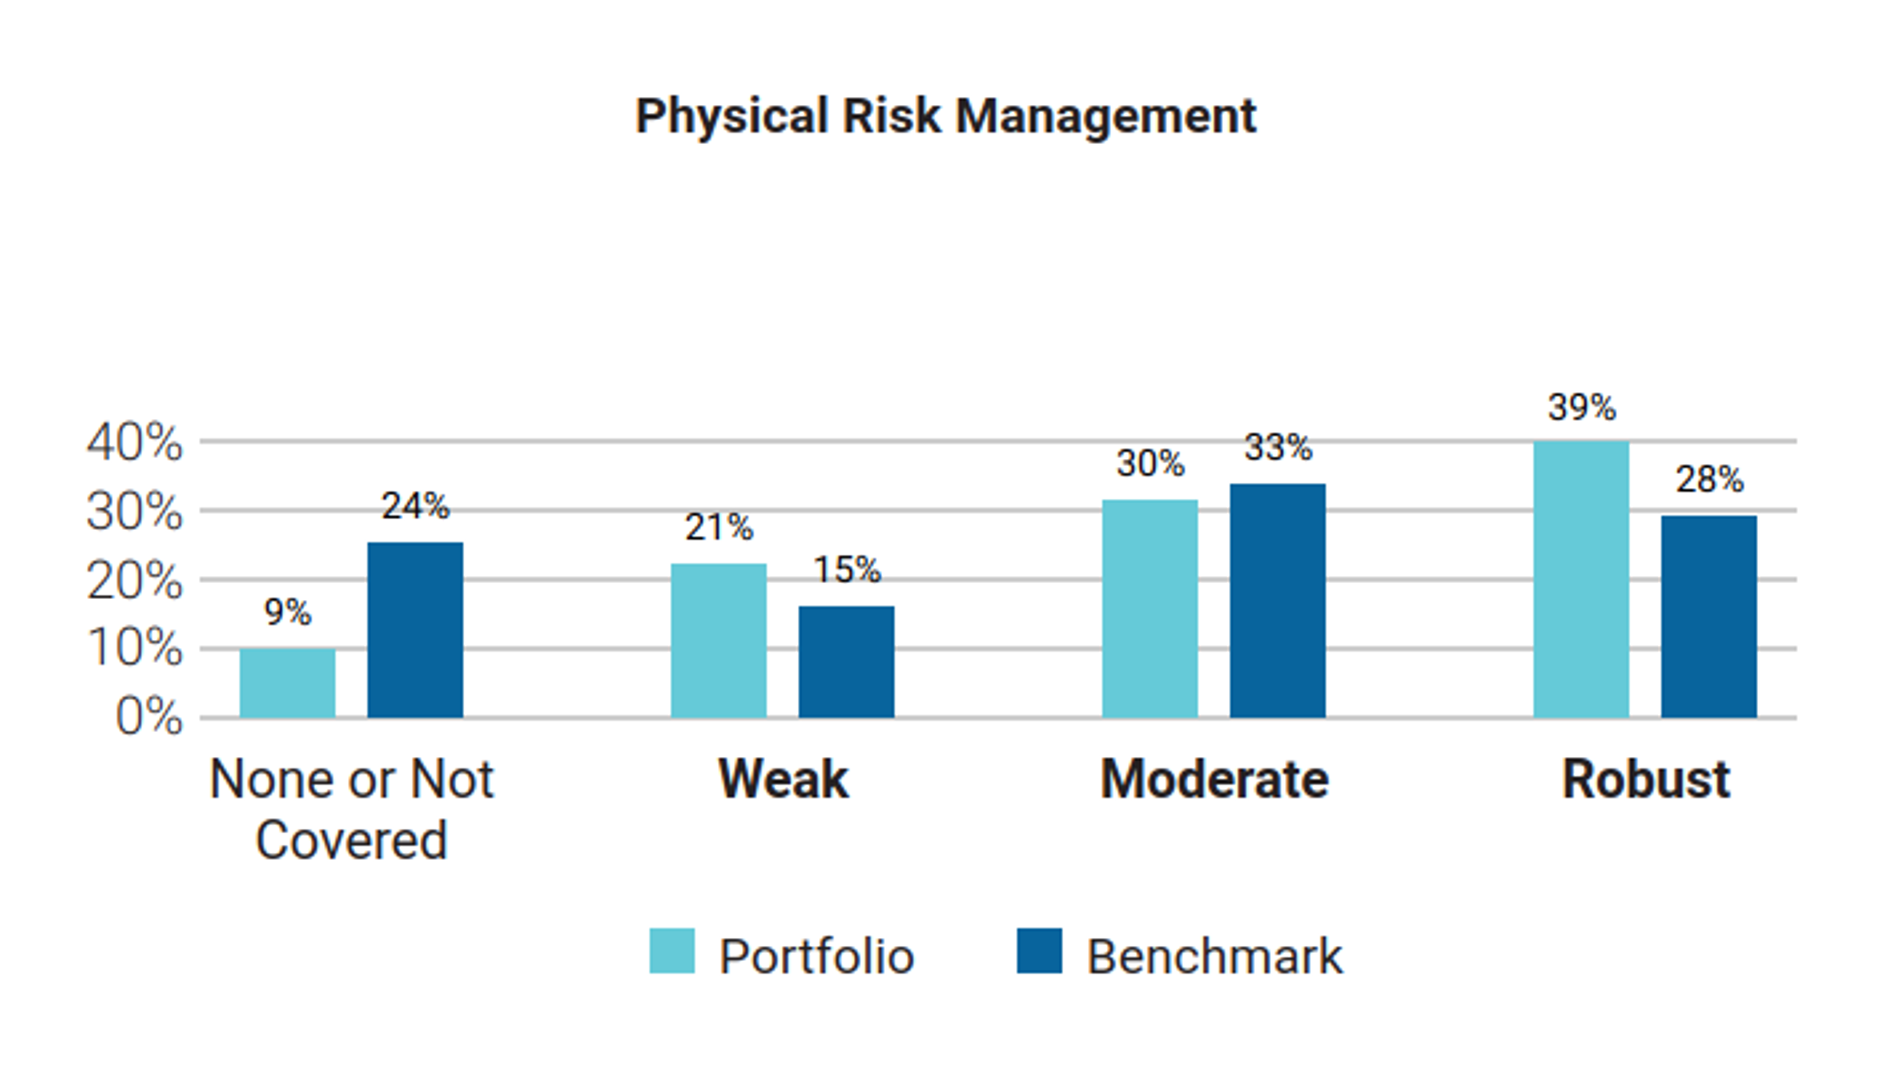
Furthermore, according to ISS’s assessment, only 21% of the issuers in the portfolio have a weak physical‑risk management strategy, while the large majority – around 69% – has a moderate or robust approach to managing physical climate risks.
The analysis also highlights better data coverage for the portfolio compared to the benchmark: only 9% of Etica’s holdings lack sufficient disclosure for a physical‑risk evaluation, versus 24% in the benchmark. This indicates higher quality and completeness of information for the portfolio companies a crucial factor for reliably assessing long‑term resilience to physical risks.
Transitional Risk Analysis
ISS has developed a model that estimates the Transition Value at Risk (TVaR) of portfolios based on the International Energy Agency’s (IEA) Net Zero by 2050 scenario [5].
For Valori Responsabili, the potential exposure is very limited: the estimated TVaR is approximately €13 million, corresponding to less than 1% of the total analysed value. This result is a decrease from 4% of the last year analysis and confirms the portfolio’s structurally low exposure to transition risk.
This year’s edition also incorporates Scope 3 emissions, which is reflected in the sector‑level results. The highest exposure to Scope 3 relates to the Industrials sector, which is also the sector with the greatest transition‑risk exposure according to ISS’s methodology.
Despite this, the share of AUM potentially exposed to transition risk remains very limited.
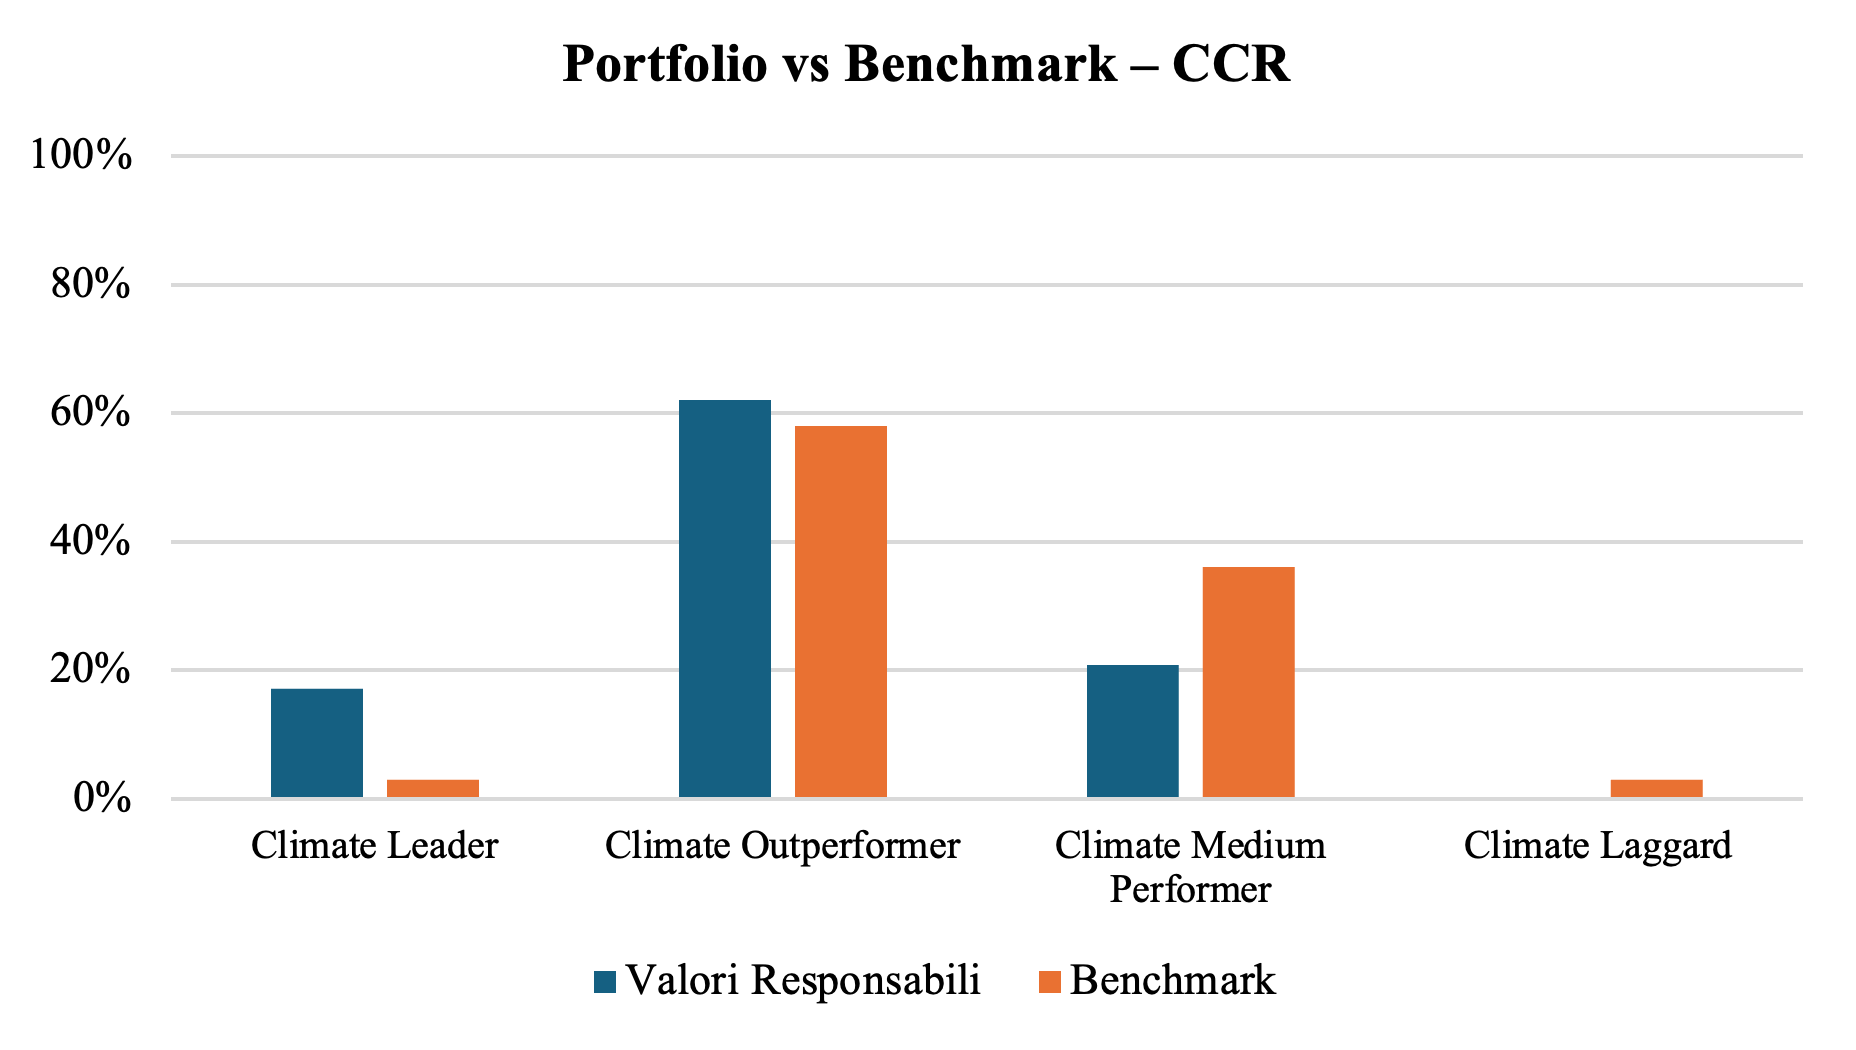
From a Carbon Risk Rating perspective – an ISS metric that summarises each issuer’s ability to manage climate-related risks and seize opportunities – companies Etica portfolio exhibit overall solid performance, with no issuers classified as Laggards.
When comparing the overall portfolio with the benchmark, the analysis shows that issuers held in the portfolio demonstrate a stronger capacity to manage transition risks and seize climate‑related opportunities.
ISS’s transition‑risk analysis also examines the power generation mix of the companies held in the portfolio. Etica Valori Responsabili includes 9 issuers involved in electricity generation. Among them, 4 belong to non‑utility sectors, but integrate renewable‑energy generation as part of their business model.
The main effect of excluding green bonds from the analysis is a reduction in the amount of renewable energy attributable to the portfolio through ownership. As a result, the share of renewable generation associated with the portfolio falls from 85% in 2024 to 41%.
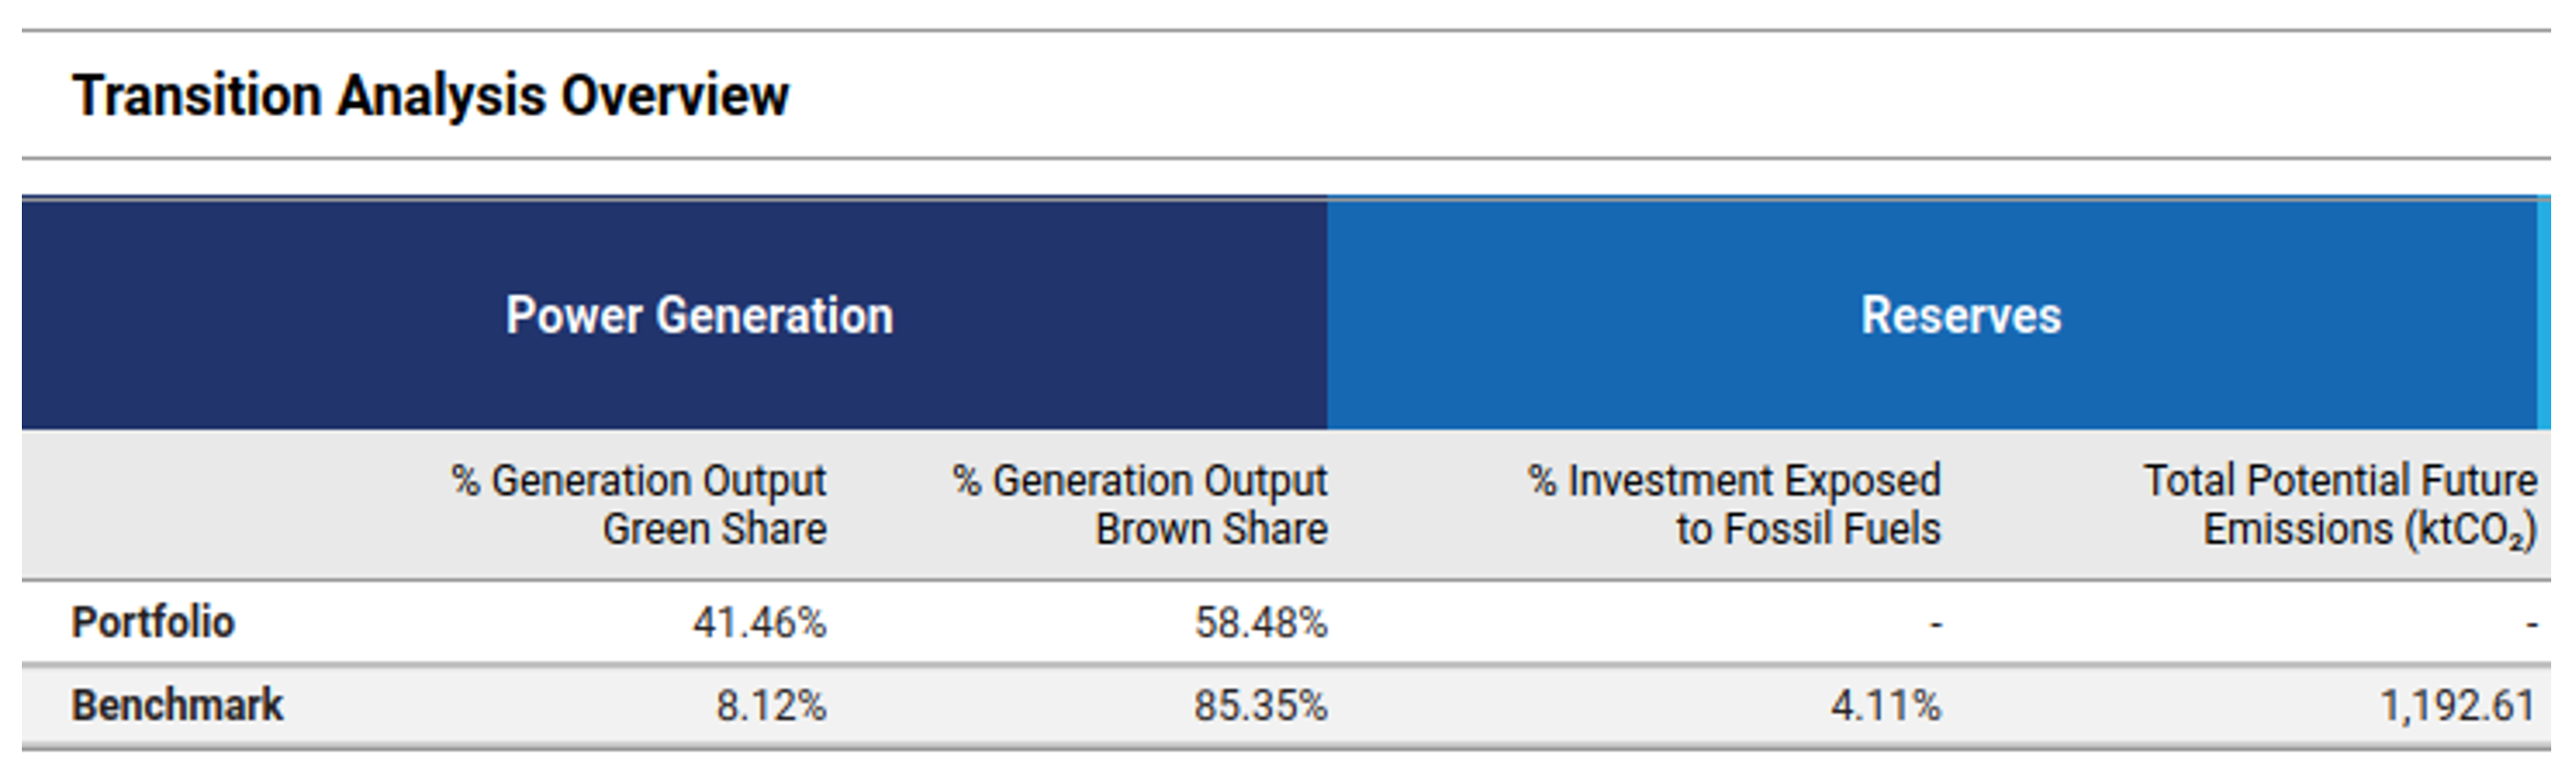
This decline is driven entirely by the change in the ownership‑based calculation methodology, since the weight of issuers’ exposure changes substantially when green bonds are removed.
It is important to note that green bonds represent around 60% of the total value invested in issuers involved in energy production. When they are excluded, the “owned” portion of renewable capacity decreases significantly. A clear example is Ørsted: because the fund holds only green bonds from Ørsted, and no equity, once these are excluded it no longer retains ownership of Ørsted’s renewable‑energy production, which mechanically reduces the renewable share.
As expected, when the analysis is performed including green bonds, the share of renewable‑energy generation rises to 78%, fully consistent with the 2025 analysis.
However, from a methodological perspective, it is more accurate to exclude green bonds from the ownership‑based power‑mix calculation – since they do not convey ownership of issuers’ emissions or energy outputs – and to complement this assessment with a separate use‑of‑proceeds analysis, which captures their actual contribution to the energy transition.
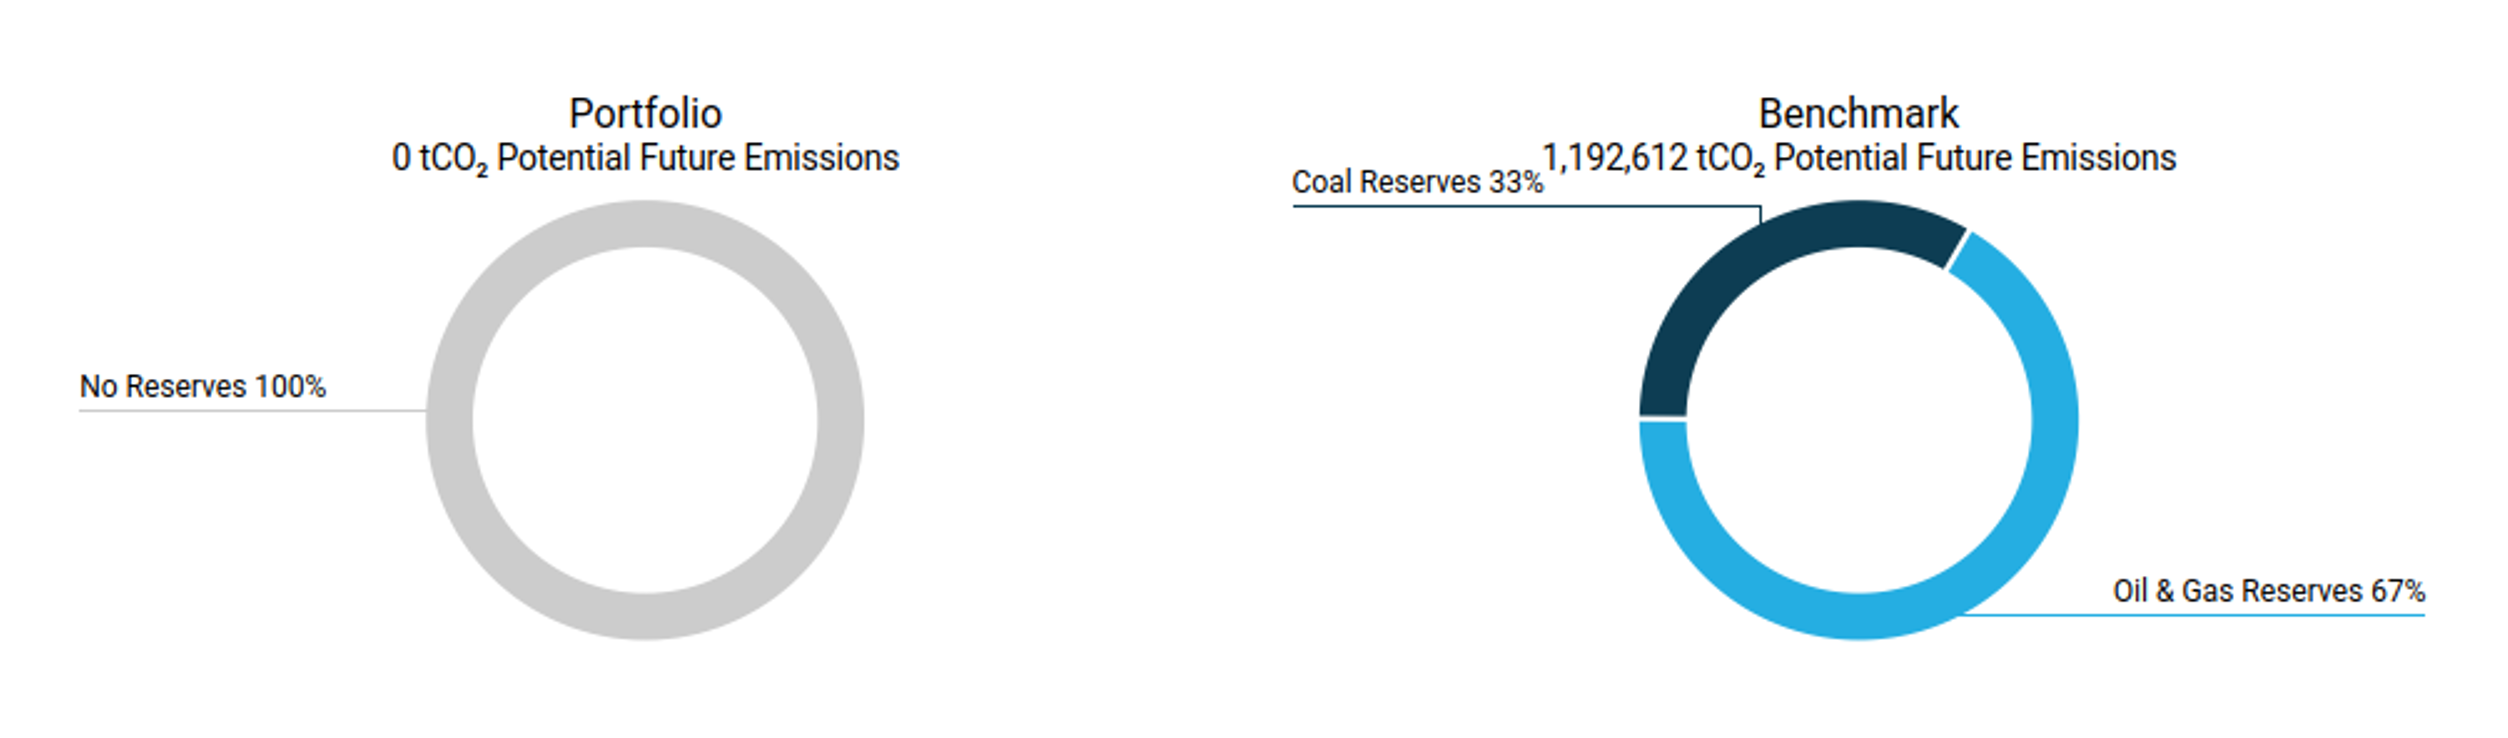
Finally, unlike the benchmark, il portafoglio has no exposure to fossil‑fuel activities, and none of the issuers in the portfolio hold fossil‑fuel reserves. This implies zero potential future emissions, whereas the benchmark shows exposure to 1,192,612 tCO₂ associated with fossil‑fuel reserves.
The portfolio also has no direct exposure to controversial or unconventional extraction activities, such as fracking or Arctic drilling.
Corporate Green Bonds: use of proceeds analysis
As of 31 December 2025, the portfolio included 41 corporate bonds, of which green bonds accounted for 65% of the total and approximately 75% of the corporate bond AUM. The majority of the corporate fixed‑income exposure therefore directly contributes to financing issuers’ green‑transition projects.
The projects financed by these bonds fall into the following use‑of‑proceeds categories [6]:
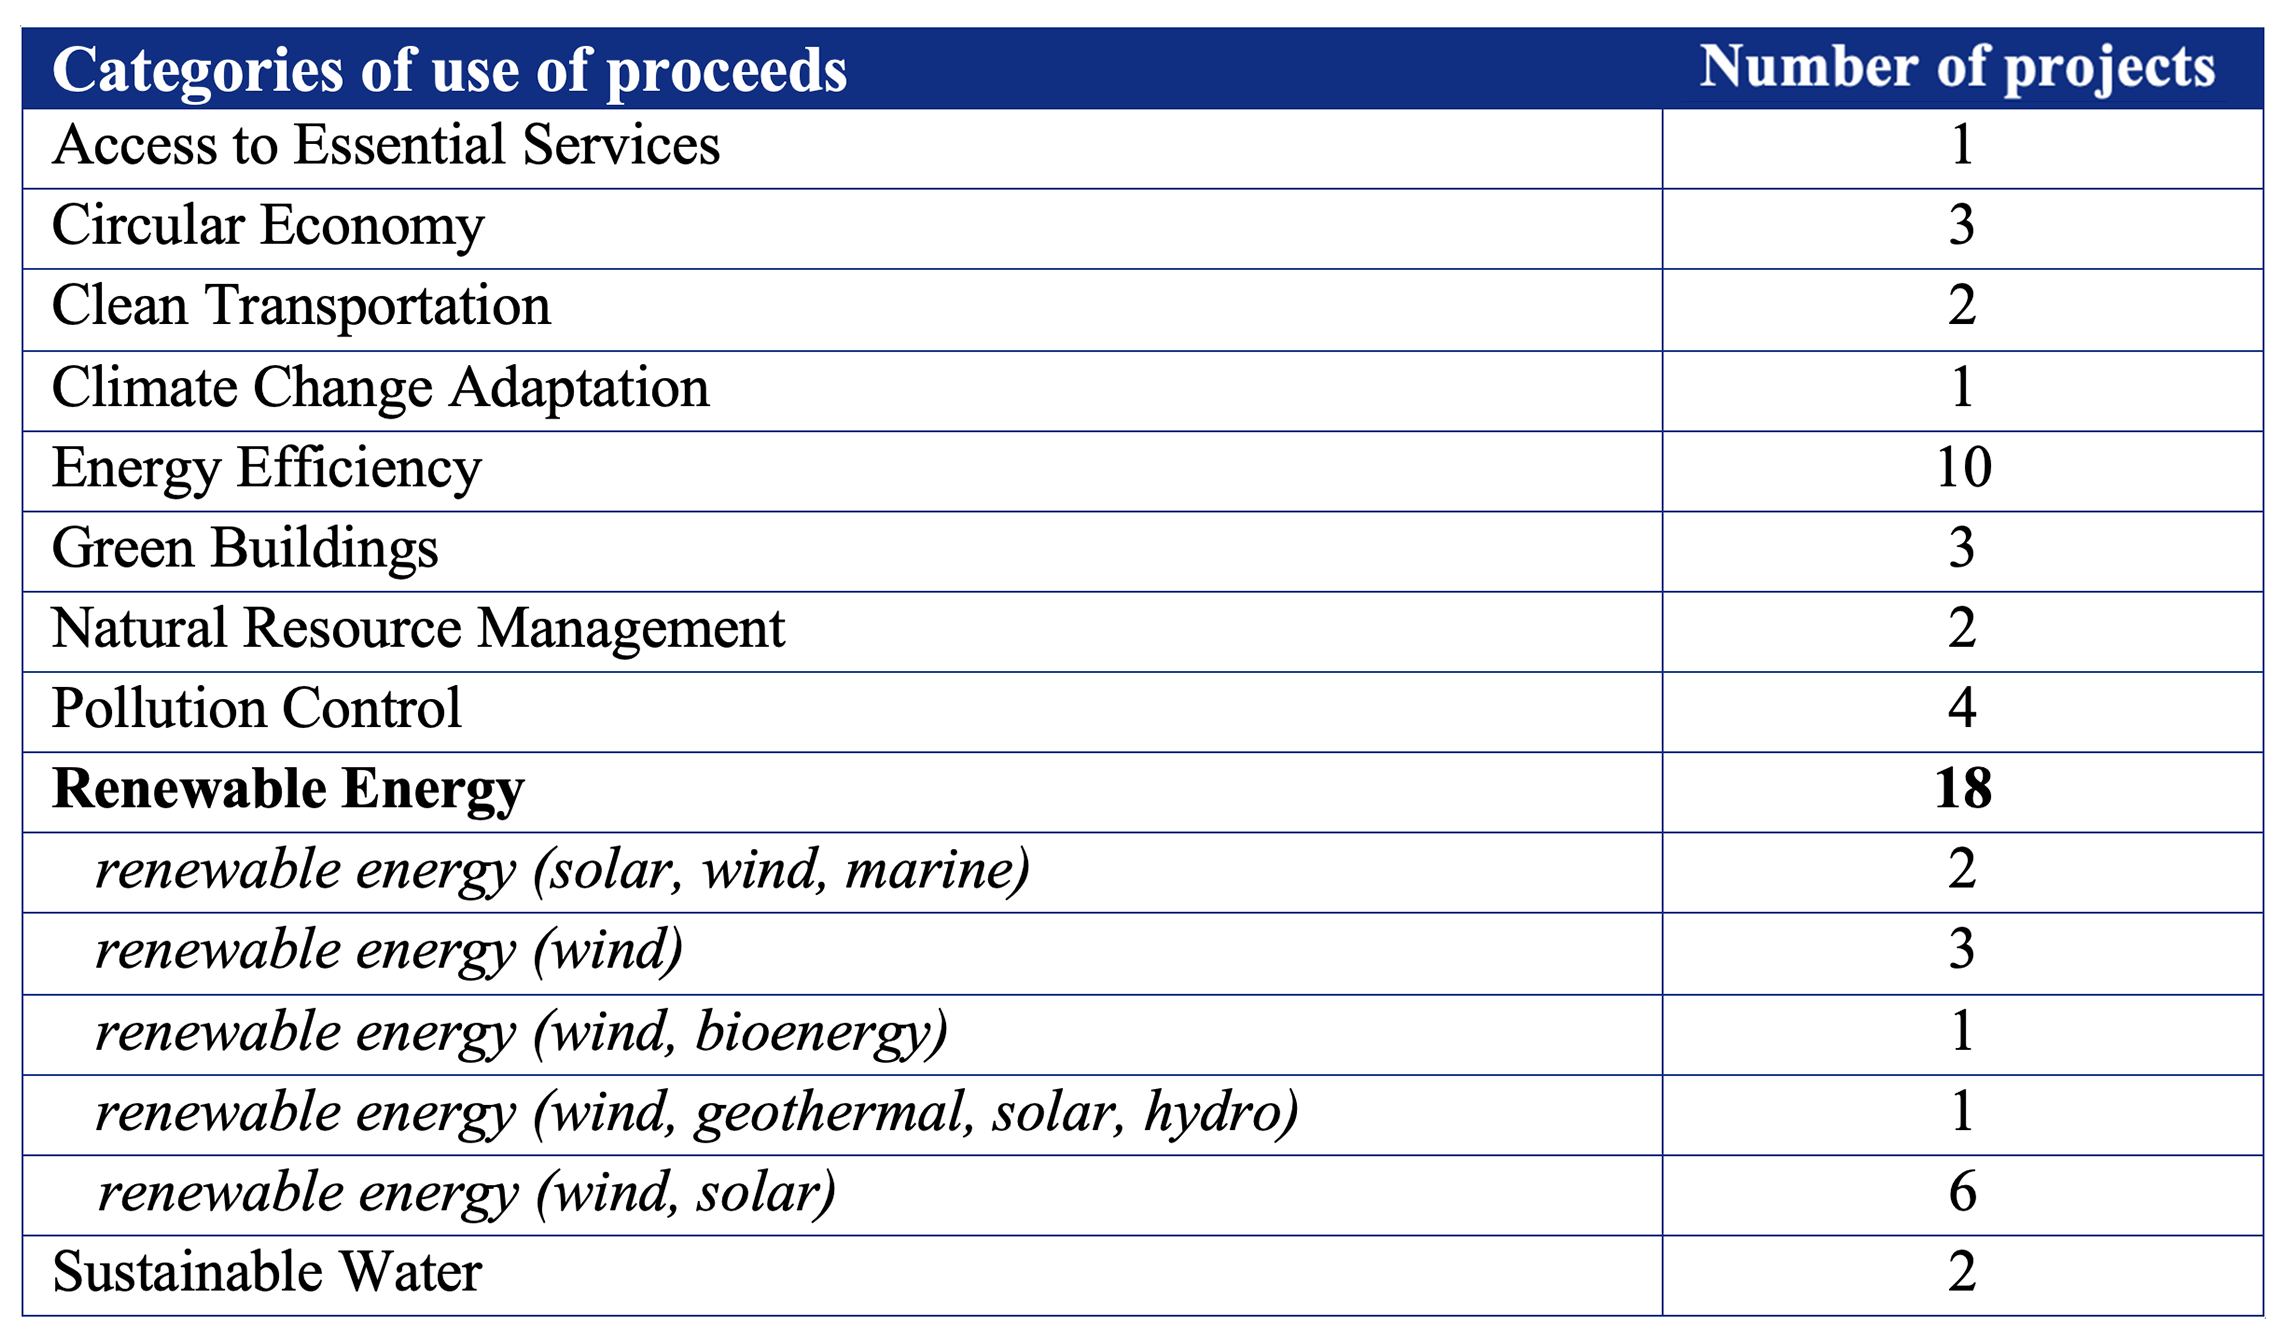
The largest category is Renewable Energy, with 18 projects related to clean‑energy generation through various technologies, including solar, wind, hydro, bioenergy and geothermal.
Projects related to Energy Efficiency (10) further complement the portfolio’s impact profile by reducing energy consumption in industrial processes and infrastructures. Minimising energy waste is one of the most effective and immediate strategies to support decarbonisation, as it reduces emissions without requiring additional energy‑generation capacity.
Overall, the distribution of project categories demonstrates a portfolio strongly oriented toward high‑impact climate‑positive investments, addressing both emissions reduction and enhanced environmental resilience.
When available, it was also possible to estimate the avoided emissions and the renewable energy produced or installed through the projects financed by the green bonds.
The aggregated results are as follows:
- Avoided GHG emissions: 186,285 million tons of CO2;
- Renewable Energy Capacity Constructed or Rehabilitated: 18.422 MW;
- Renewable Energy Generated: 480,921GWh.
These metrics are sourced from Bloomberg and reflect what is reported in the individual issuers’ allocation reports. Two types of conversions were required to calculate the final aggregated values:
- Unit conversion
In some cases, energy data were reported using different units (e.g., MWh instead of GWh).
This conversion is straightforward, as it simply involves applying a mathematical factor (1 GWh = 1,000 MWh). - Conversion of annual data into lifetime values
When issuers did not report total lifetime environmental benefits but only annual figures, total values were estimated by multiplying the annual benefit by the duration of the bond, calculated from issuance to maturity.
It is important to note that these metrics represent absolute values for the projects financed through the green bonds. They are not adjusted for the portfolio ownership share and do not follow the financed‑emissions methodology. They should therefore be interpreted as a measure of the overall contribution of the issuers’ projects.
In absolute terms, including data on green bonds, the companies in the portfolio generated the following in 2025:
- 545,44 GWh of renewable energy;
- 25,308.30 GWh of energy from fossil.
Analysis of sovereign emissions
Carbon footprinting is increasingly used to assess climate‑transition risks, but it is important to note that, for sovereign issuers, emissions accounting follows different criteria than those applied to corporates. The sovereign emissions analysis is based on ISS’s dedicated sovereign methodology, which is fully consistent with major international reporting standards – most notably the PCAF Sovereign Accounting Guidelines – and compares the greenhouse‑gas emissions and climate‑related indicators of the countries in the Valori Responsabili portfolio with those in the benchmark.
The tables report both absolute and relative emissions associated with the countries held in the portfolio, together with emissions‑intensity metrics. Production emissions (Scope 1) rely on the most recent available data: 2022 for Annex I countries (UNFCCC) and 2021 for non‑Annex I countries (CAIT). Scope 2 and 3 emissions are based on 2018 OECD data, which remains the last globally harmonised dataset.
To support the interpretation of results, a few essential definitions are provided:
- Production emissions (Scope 1): all territorial emissions generated by the production of goods and services within a country;
- LULUCF emissions: emissions or removals associated with land use, land‑use change and forestry. These are presented separately to provide a more comprehensive picture of each country’s emissions profile;
- Emission Exposure (absolute): the portfolio’s total sovereign emissions exposure, obtained by weighing each country’s emissions by its proportional exposure in the portfolio;
- Relative Emission Exposure: emissions attributed per million euros invested, expressed as Relative Carbon Footprint (RCF) and Weighted Average Carbon Intensity (WACI).
Consistent with the approach applied in the corporate section, sovereign green bonds were excluded from the calculation of financed emissions; the related use‑of‑proceeds analysis is presented separately in the following pages.
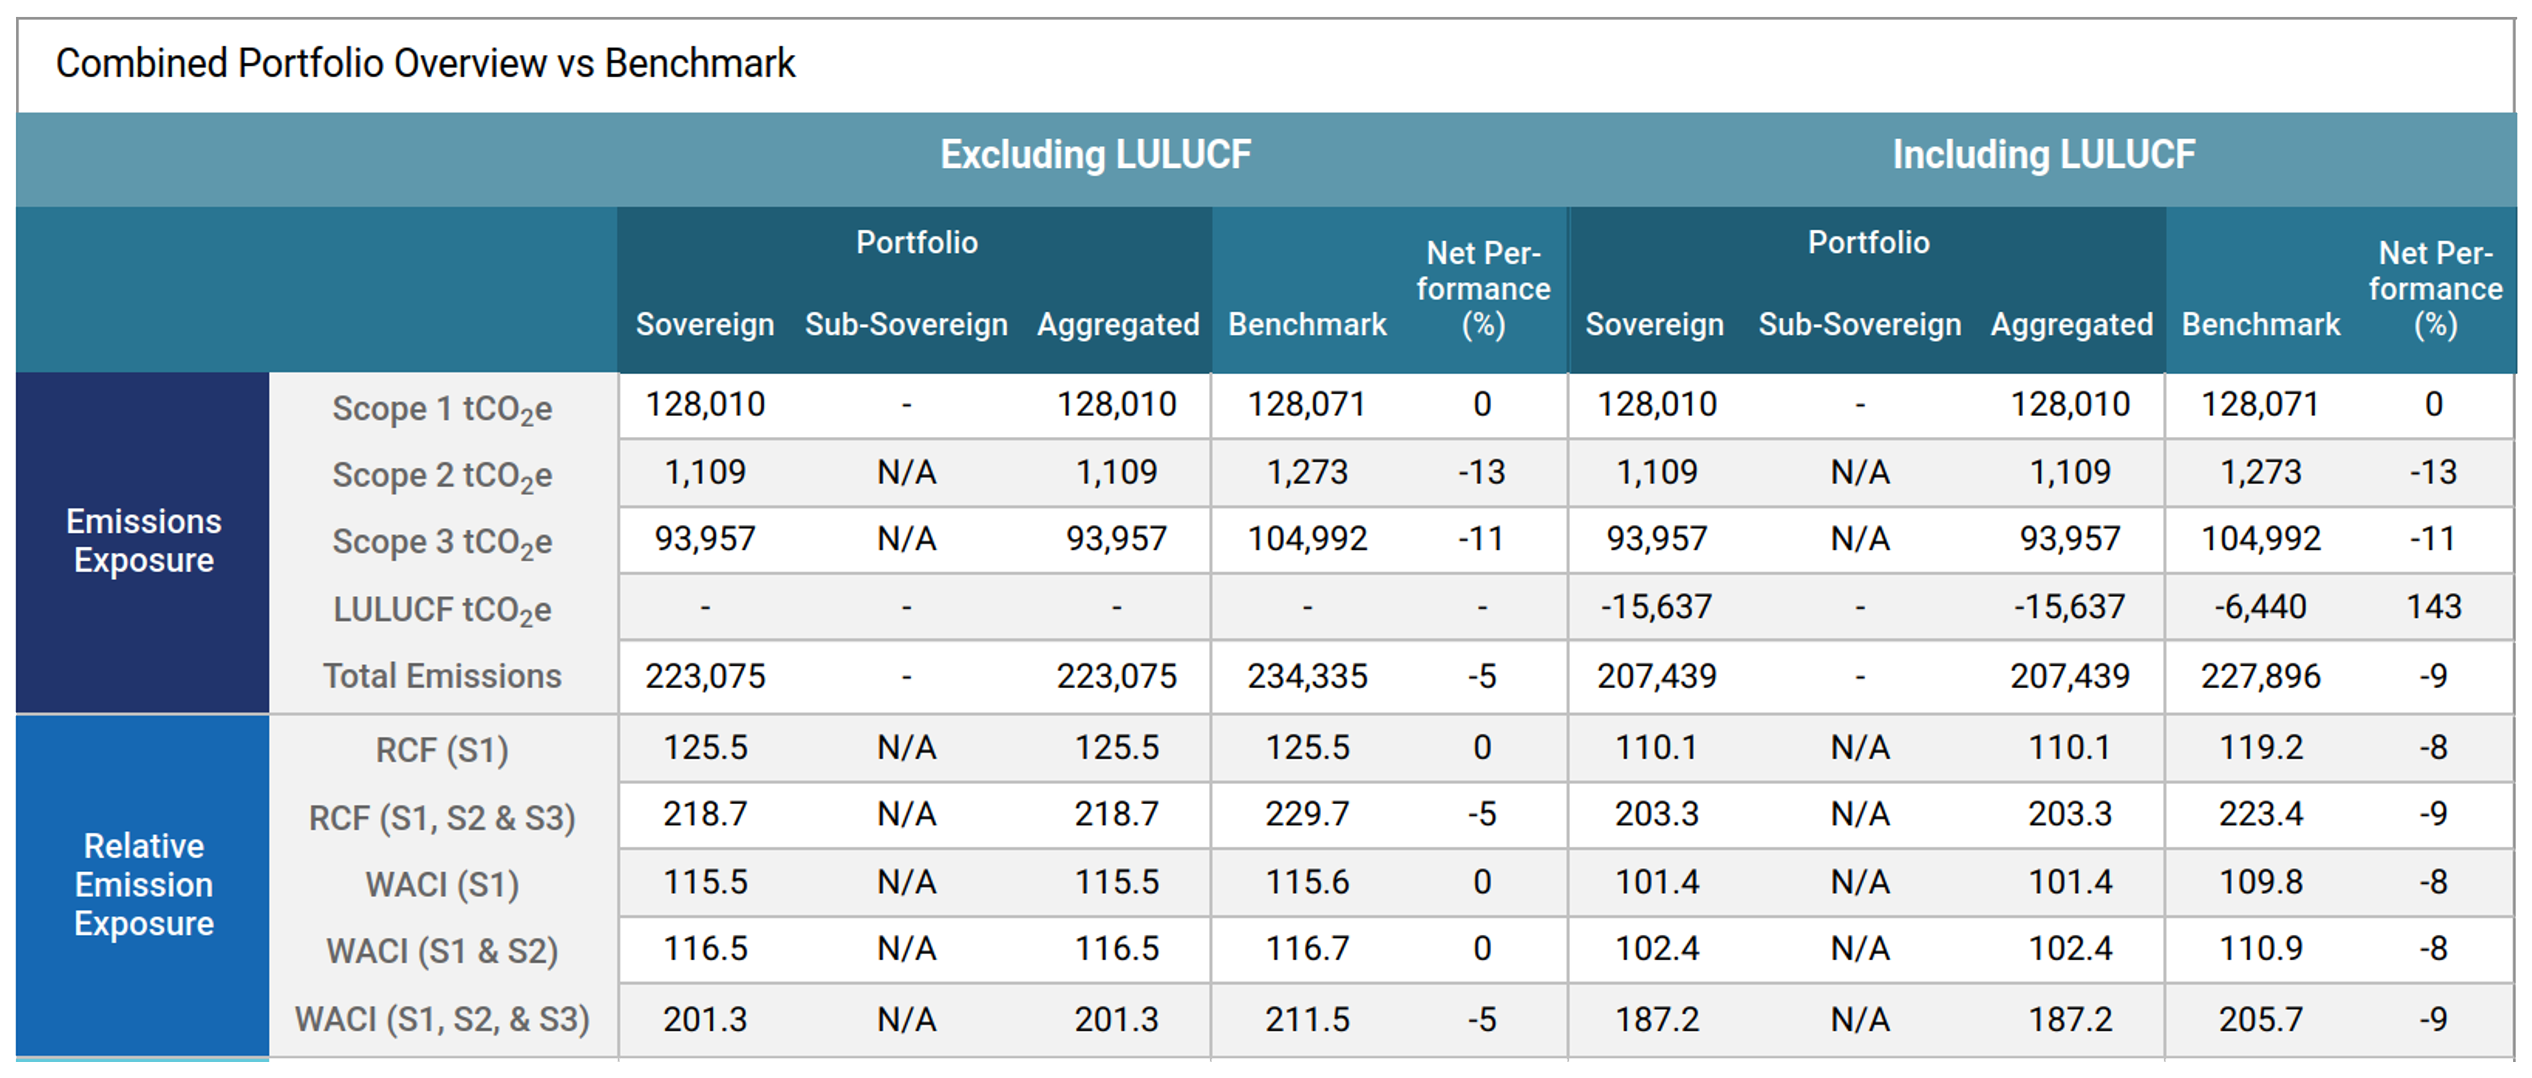
The portfolio’s Scope 1 (production) emissions exposure is aligned with the benchmark. Adding LULUCF improves the portfolio’s position, indicating a larger net sink than the benchmark.
Differences become more pronounced in Scopes 2 and 3: the portfolio shows lower exposure in Scope 2 (-13%) – i.e., imported electricity/heat – and lower exposure in Scope 3 (-11%), i.e., embedded emissions in non‑energy imports.
On a financed‑emissions basis, the RCF is equal to the benchmark for Scope 1 and better for Scopes 2 and 3. The more favourable LULUCF further reduces the footprint per € million invested. The WACI (emissions intensity vs. GDP) is in line for Scopes 1–2, and 5% lower when Scope 3 is included – again reflecting lower exposure to trade – and network‑related emissions and a more favourable LULUCF profile.
In short, the portfolio is on par with the benchmark for domestic production (Scope 1), while being less exposed to imported/embedded emissions. With LULUCF, countries in the portfolio exhibit higher net absorption.
It is important to note that the sovereign selection methodology [7] of the fund includes only limited climate‑specific criteria. Therefore, the differences observed relative to the benchmark are mainly attributable to different country weightings within the portfolio.
Sovereign green bonds: use of proceeds analysis
At the end of 2025, the included 82 sovereign bonds, 21 of which were classified as green bonds. Although they represent 53% of the total sovereign allocation. This means that the majority of the portfolio’s sovereign exposure contributes directly to the financing of environmental projects with measurable impacts.
The analysis of use‑of‑proceeds, based on allocation data disclosed by sovereign issuers and categorised according to the Sustainable Development Goals (SDGs) [8], shows a strong concentration of investments in key areas for the ecological transition.
It is worth noting that the percentages shown refer to 100% of the green bonds held in the portfolio.
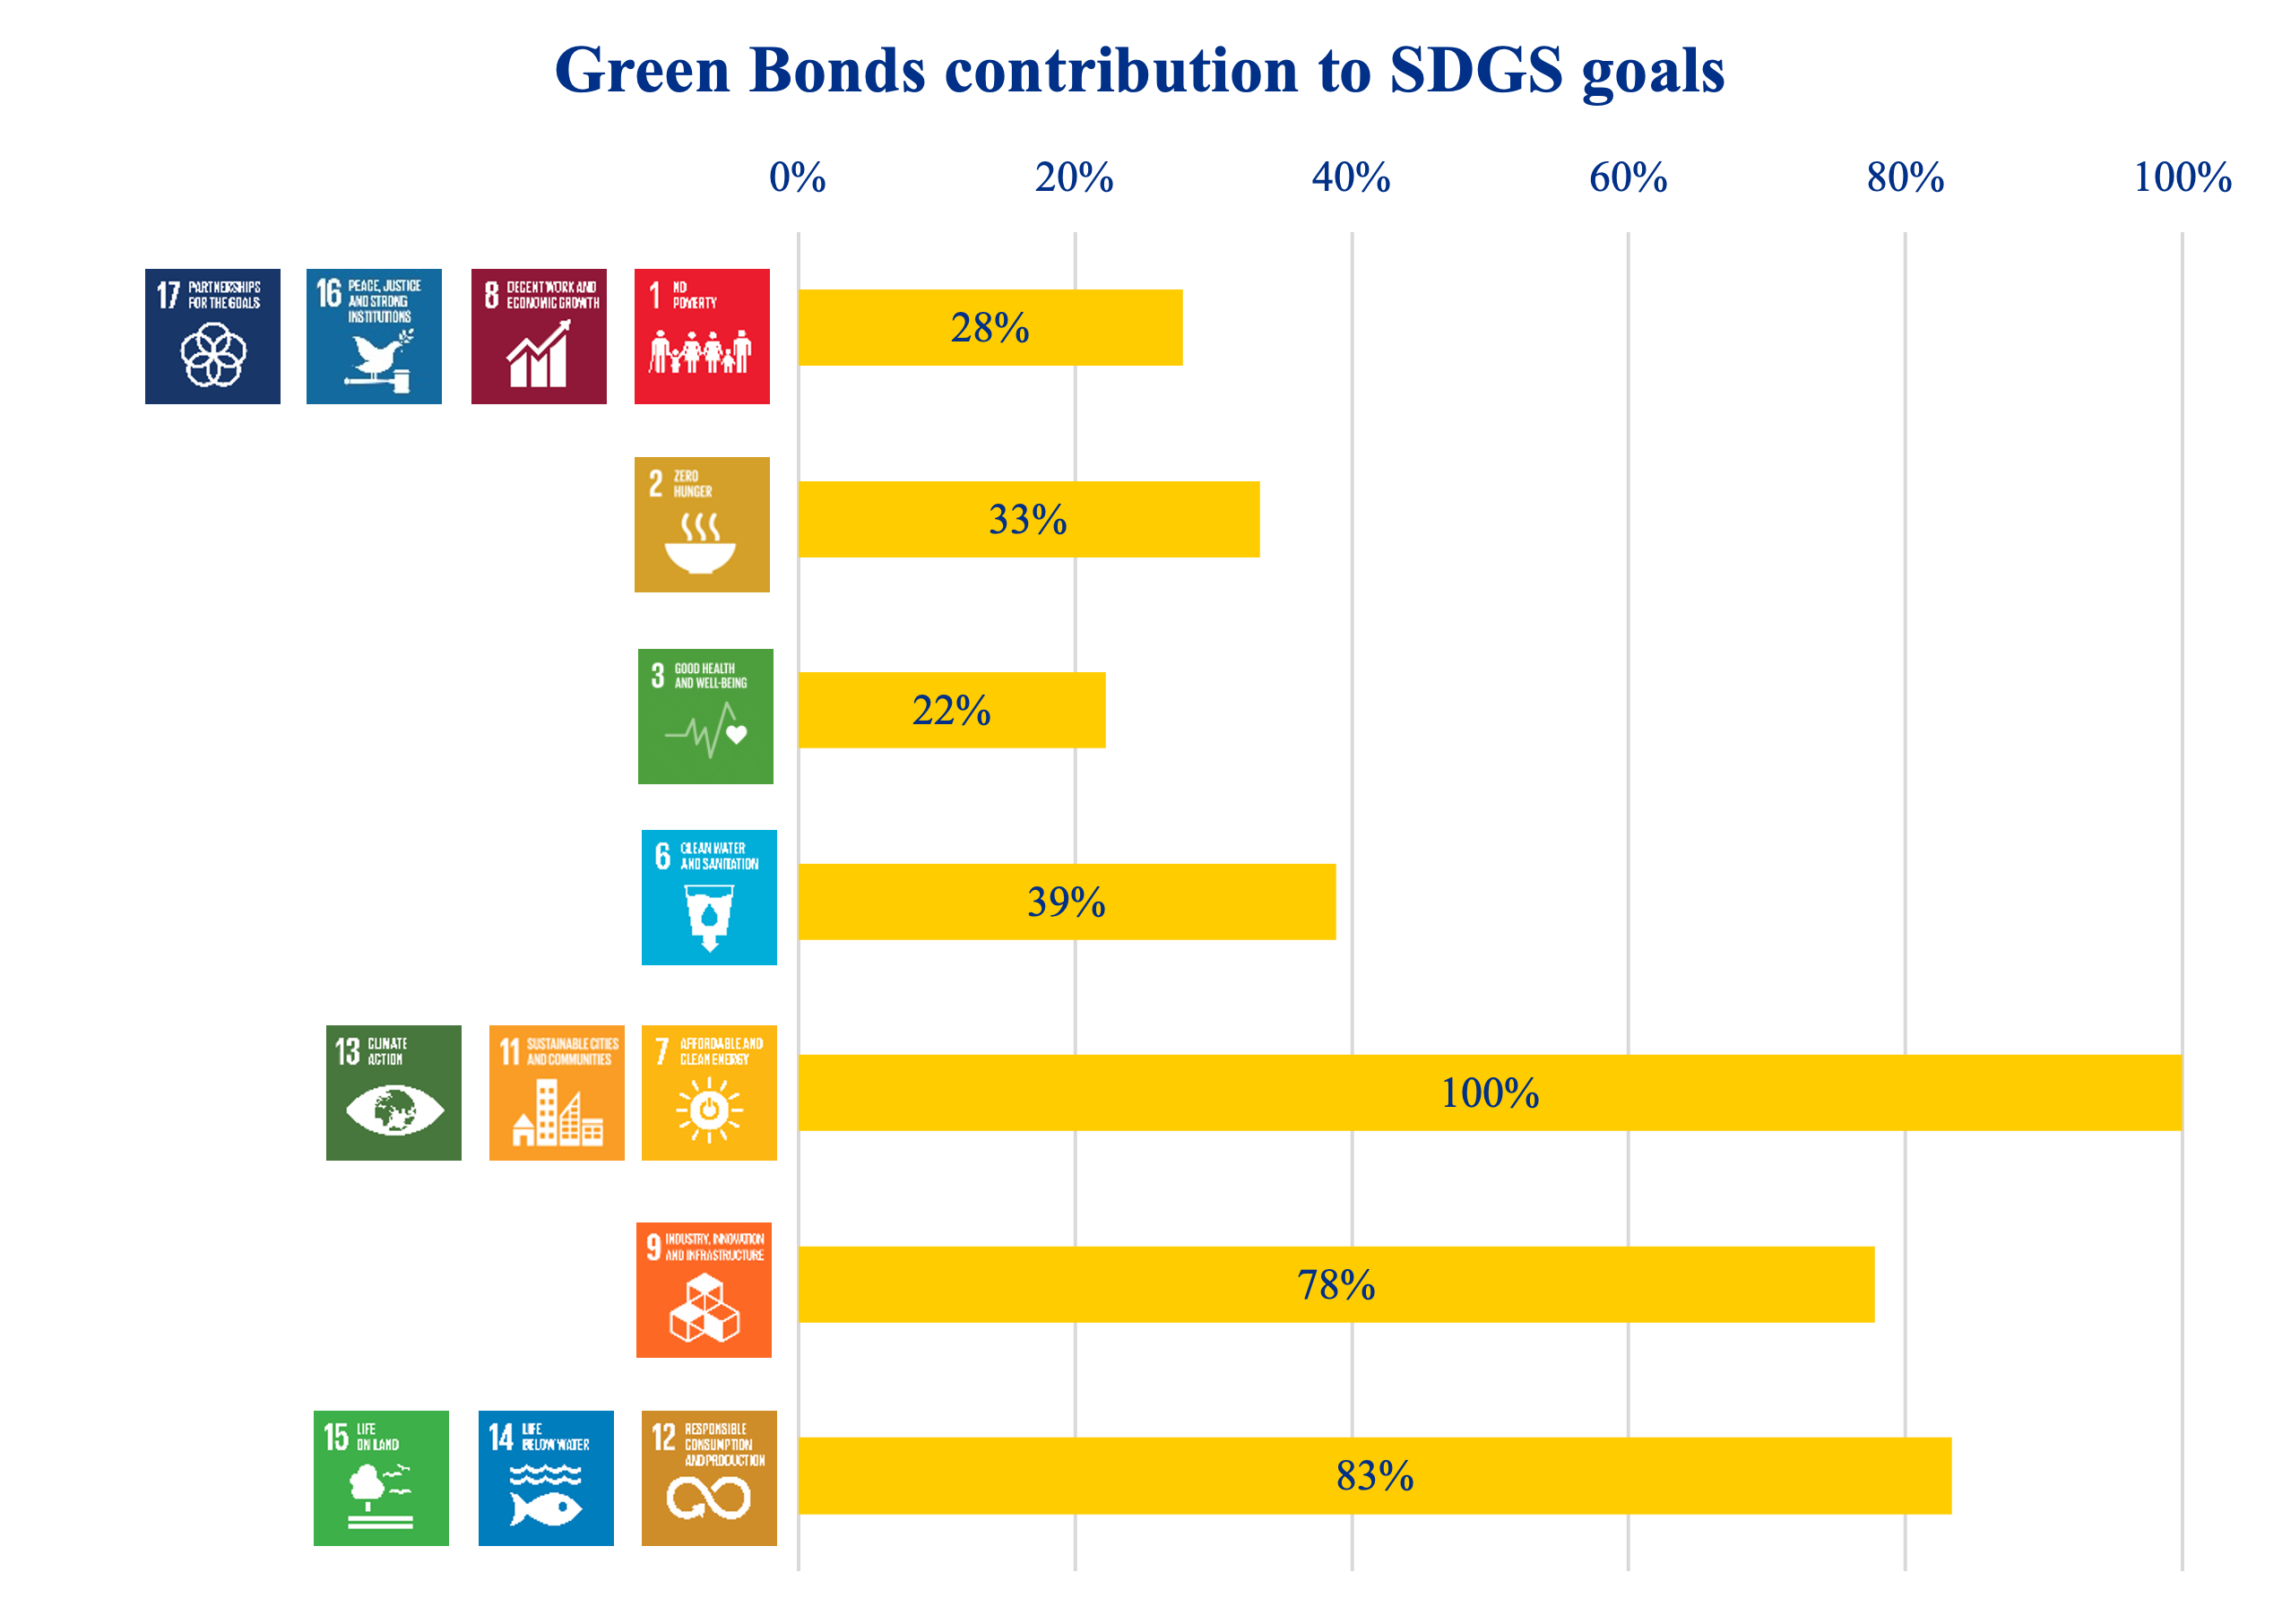
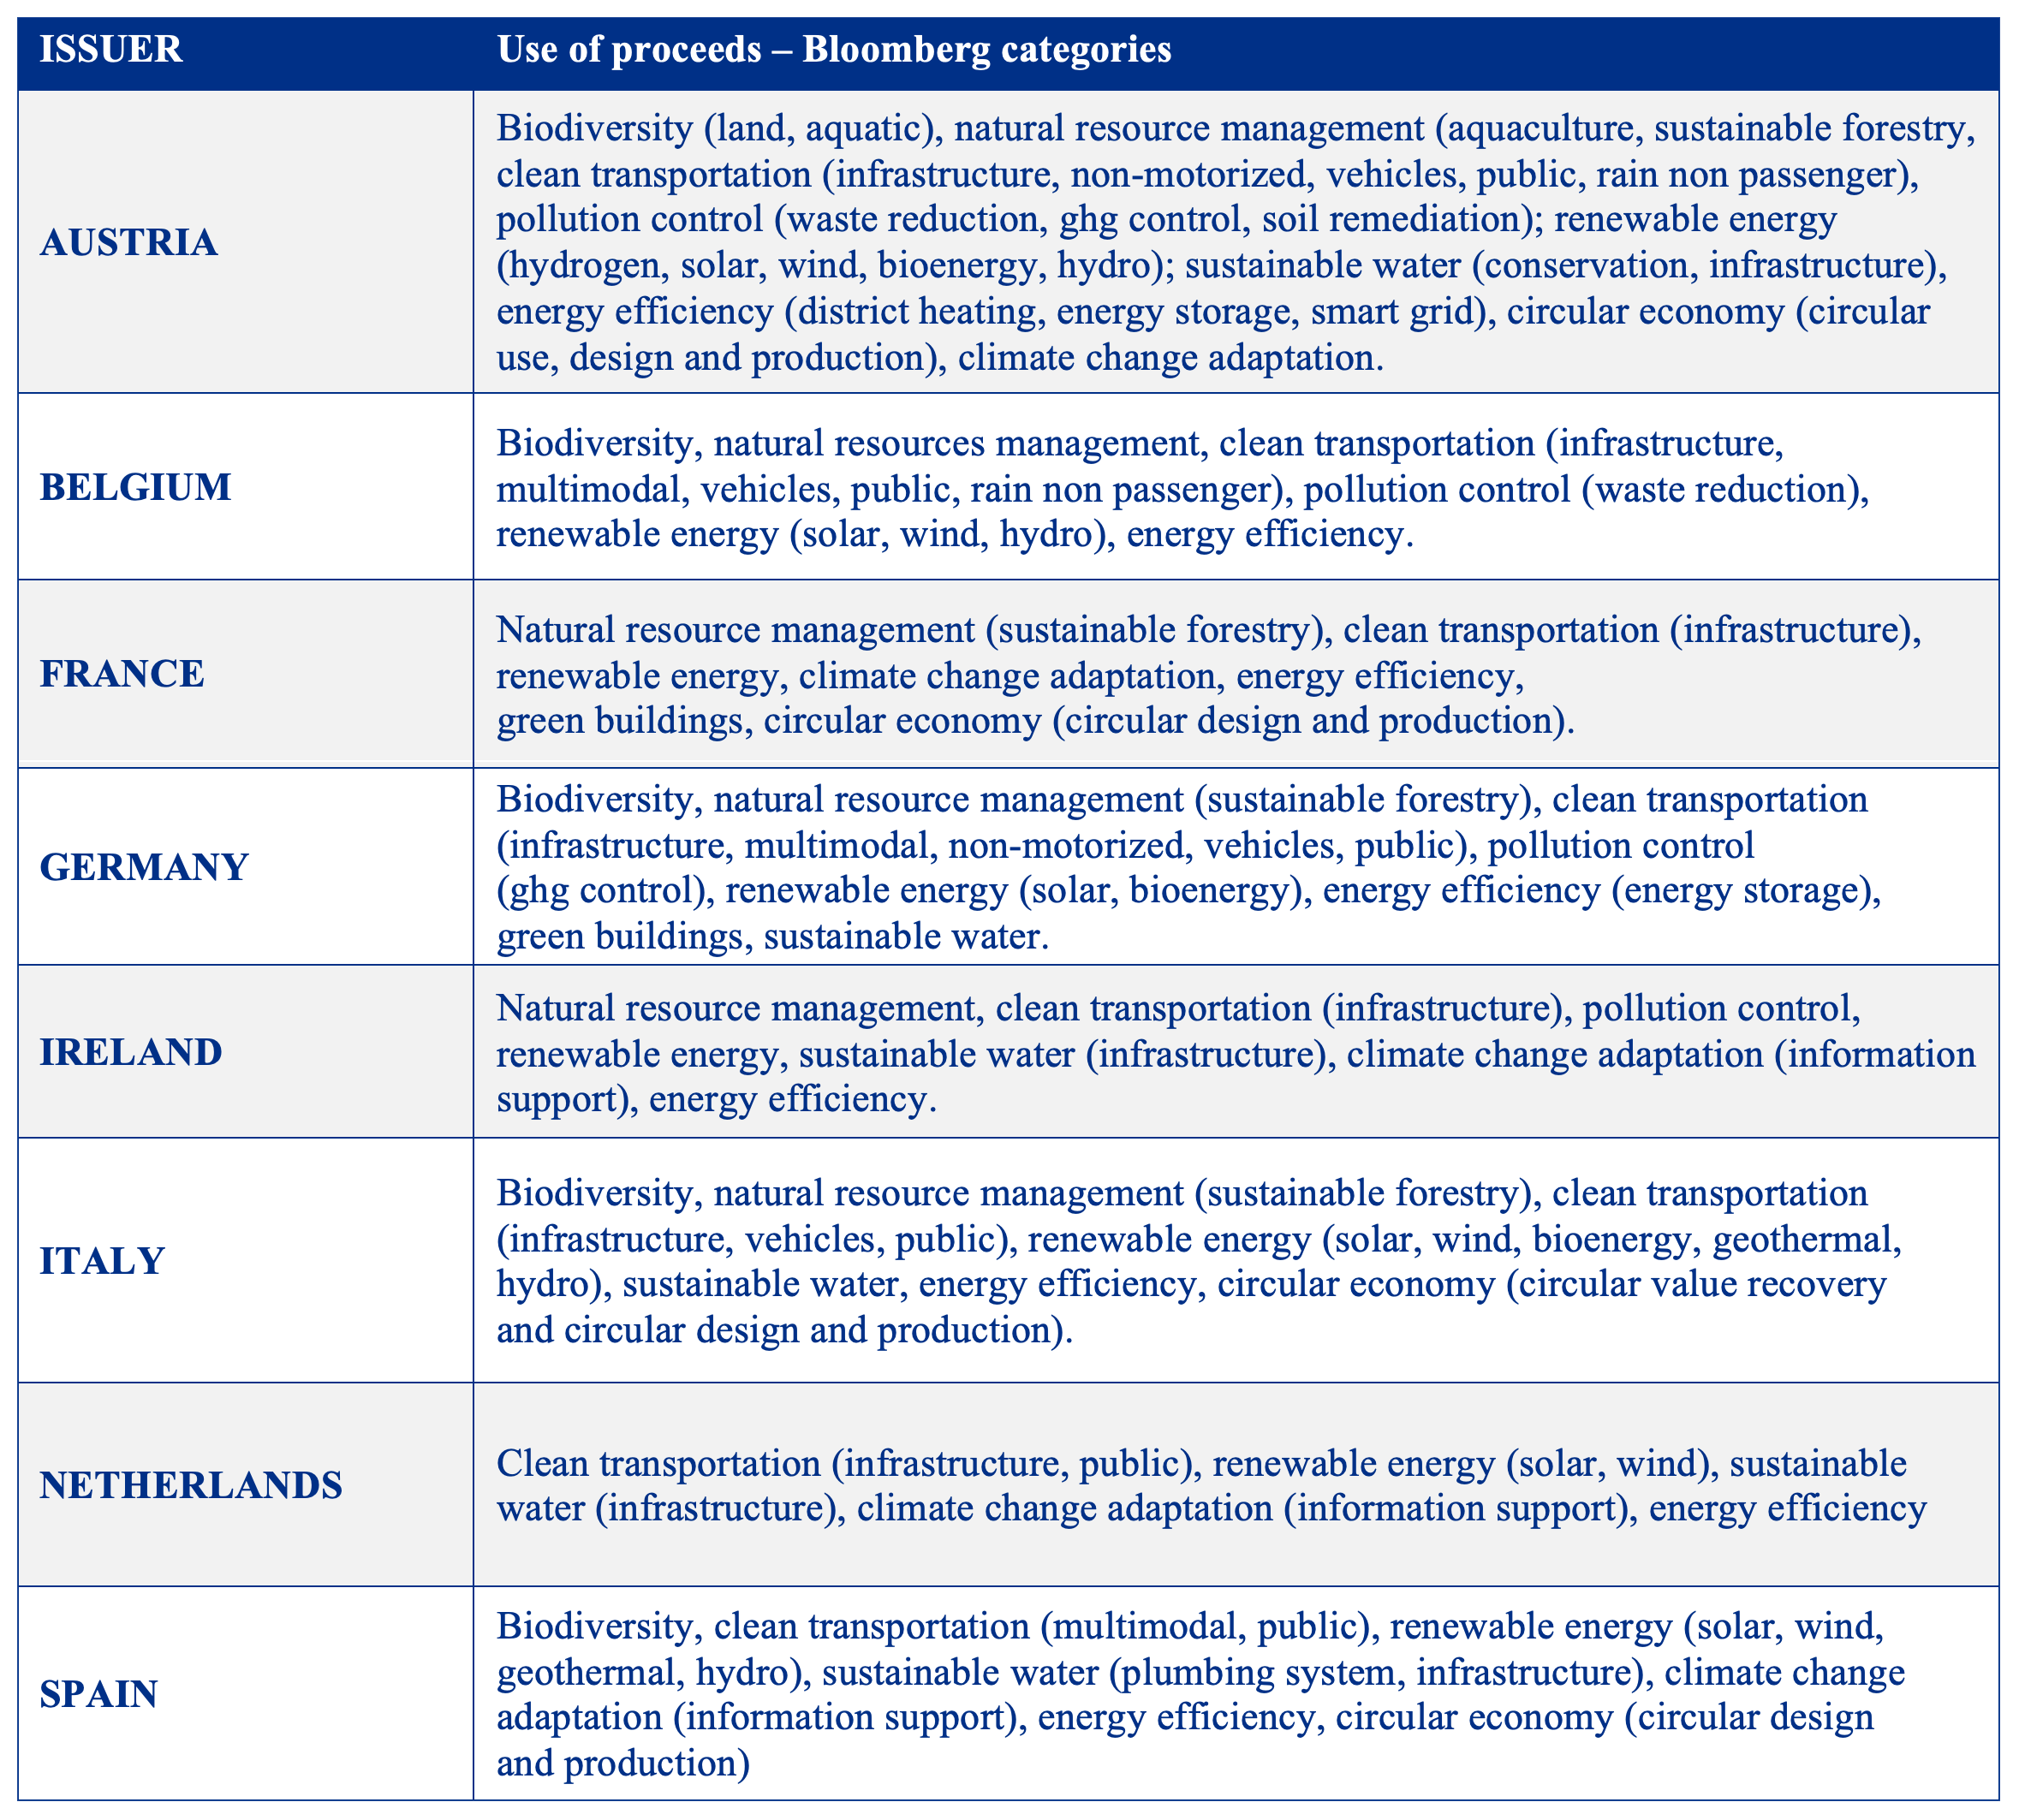
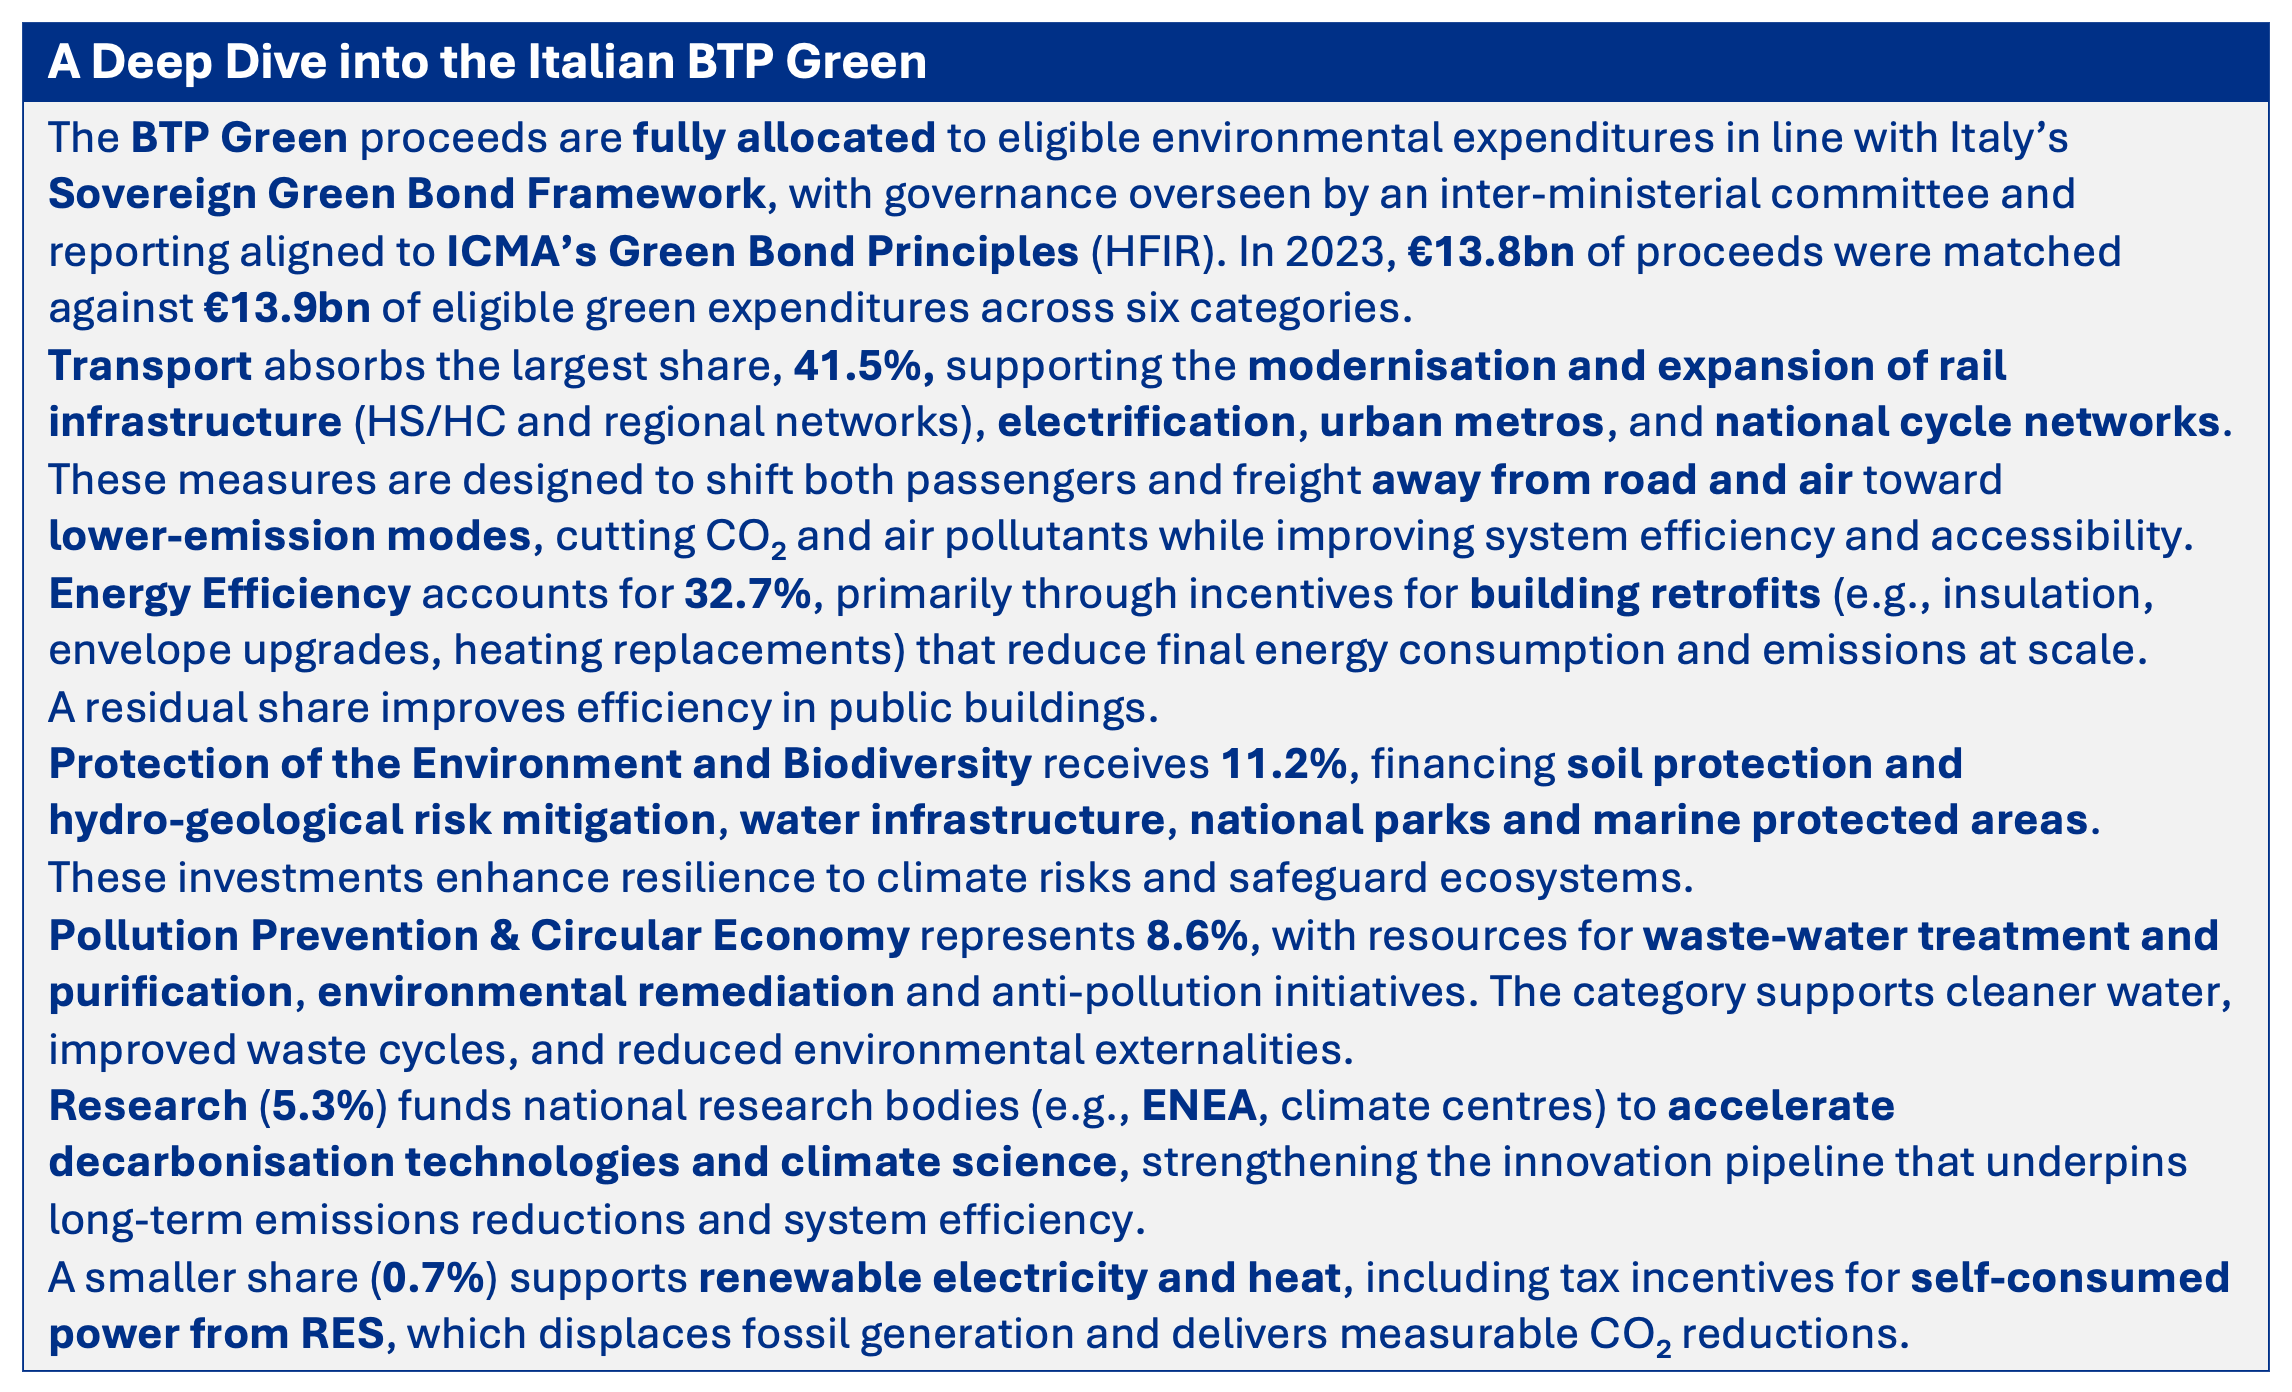
The table below shows the project financing category [9] for each Sovereign green bond issuer.
Conclusion
Etica’s proprietary methodology for selecting issuers, particularly related to climate assessment, remain robust, and the enhancements introduced over the years have resulted in substantial emission reductions. Compared with 2019, the portfolio has achieved:
- 92% reduction in carbon footprint;
- 78% reduction in carbon intensity;
- 82% reduction in WACI.
The scenario analysis presents encouraging outcomes but underscores the growing relevance of Scope 3 emissions, which remain the most challenging dimension of corporate decarbonisation.
The portfolio also demonstrates strong management of transition and physical risks, supported by a high share of renewable‑energy generation from portfolio issuers.
Even though climate considerations play a more limited role in sovereign selection, the sovereign portfolio nonetheless performs better than the benchmark across multiple emissions metrics.
Moreover, analysing the use of proceeds of both corporate and sovereign green bonds provides clearer visibility into the real‑economy impact of financed projects, highlighting the positive contribution of the portfolio beyond financed‑emissions metrics alone.
Climate Impact in Brief
References
[1] https://www.issgovernance.com/esg/
[2] Launched after the 2015 Paris Agreement by the Financial Stability Board (FSB), the Task Force on Climate-related Financial Disclosure (TCFD – https://www.fsb-tcfd.org/) considers climate transparency as a crucial factor for the stability of financial markets. The objective of the TCFD is therefore to improve climate transparency in financial markets through recommendations on disclosure. These recommendations provide a “consistent framework that improves the ease of both producing and using climate-related financial disclosures”. The TCFD aims to create a unique standard for both corporate and investment disclosure, understanding that local regulatory frameworks may require different compliance levels. By October 12, 2023, the TCFD had fulfilled its mission and disbanded, although it remains a valid guideline for assessing and reporting on climate-related risks.
[3] It is important to note that the percentages shown for each effect do not represent a proportion of the total difference, but rather a proportion of the benchmark’s total emissions.
[4] AR5 (2013/2014) – IPCC – Focal Point Italia
[5] Net Zero Emissions by 2050 – World Energy Outlook 2025 – Analysis – IEA
[6] Note that 1 bond could finance 1 or more project categories. The categories are defined according to Bloomberg analysis of the Allocation Report and Bond framework published by the issuers.
[7] Selection of securities: ESG and financial analysis | Etica Funds
[8] The 17 UN SDGs referenced by the issuer in the bond framework. Data was collected by Bloomberg.
This document is a marketing communication issued by Etica Sgr S.p.A. (“Etica”). The economic and financial data, as well as the numerical, percentage or aggregated figures referred to in the material contained in this communication, reflect market conditions and the information available at the time of drafting and may therefore be subject to change in relation to developments in financial markets or newly available information. Etica is under no obligation to amend, supplement and/or update the data contained in this material. Any information contained in the material included in this communication relating to past performance, forecasts or assumptions regarding future prospects should not be considered indicative of future results; likewise, any opinion, strategy or assessment contained therein or derived therefrom is provided solely for illustrative purposes and may not be construed as a solicitation, an investment recommendation or investment advice. This communication does not in any way take into account the characteristics of any person who may become aware of it, including the applicable tax regime, investment objectives, knowledge and experience in investment matters, risk tolerance and financial situation. Investment in funds is subject to the risks associated with the underlying assets, which affect the performance of the value of the related units or shares. Etica SGR does not provide any guarantee of returns and does not guarantee the repayment of the invested capital. Etica makes no representation or warranty and assumes no liability with respect to the achievability, suitability, reasonableness or reliability of any forecast or assessment contained in, or derived from, the material provided. Investors should enter into an investment transaction only after fully understanding its overall characteristics and the degree of exposure to the related risks, through careful reading of the KID and the prospectus of the individual funds, which — together with information on sustainability-related aspects pursuant to Regulation (EU) 2019/2088 — are made available at https://www.eticasgr.com/en/

 – Valori Responsabili")
 – Valori Responsabili")
 – Valori Responsabili")