
This document is a commented summary of the Climate Impact Report released by the company ISS ESG[1] based on its proprietary methodology, concerning the holdings of Etica Funds’ multilabel SICAV (also referred to as “the portfolio”). The report includes metrics aligned with the guidelines of the Task Force on Climate-related Financial Disclosures (TCFD[2]).
All asset classes have been analysed according to the TCFD recommendations, grouped as follows: Equity Portfolio and Corporate Bonds Portfolio together and, Sovereign Bonds Portfolio.
The analysis outlines the climate performance calculated on the portfolio at the year-end of 2024. It is divided into the following sections: carbon metrics, scenario analysis, transitional climate risks analysis, physical risks, additional insights, and conclusions.
- Carbon metrics
- Y-o-Y SICAV Comparison
- Scenario Analysis
- Transitional climate risks analysis
- Physical risks
- Conclusions
- Sovereign emissions
Carbon metrics
The carbon metrics recommended by the TCFD used in the Equity and Corporate Bonds analysis are the following ones:
The carbon metrics used in the Equity and Corporate Bonds analysis are the following ones and are explicitly recommended by the TCFD:
- Relative Carbon Footprint: defined as the total scope 1 and scope 2 GHG emissions of the portfolio, directly attributable to the investor through its ownership share in companies’ total market value (also defined as “Emissions Exposure”), per million EUR invested. It is measured in tCO2e/EUR million invested.
- Carbon intensity: defined as the total scope 1 and 2 GHG emission intensity of the portfolio (based on issuers’ revenues), directly attributable to the investor through its ownership share in the companies’ total market value. It is measured in tCO2e/EUR million revenue.
- The Weighted Average Carbon Intensity (WACI): expresses scope 1 and 2 GHG emission intensity (based on issuers’ revenues), proportional to the issuers’ weight in the portfolio. Hence, this does not take the ownership share into account. It is measured in tCO2e/EUR million revenue.
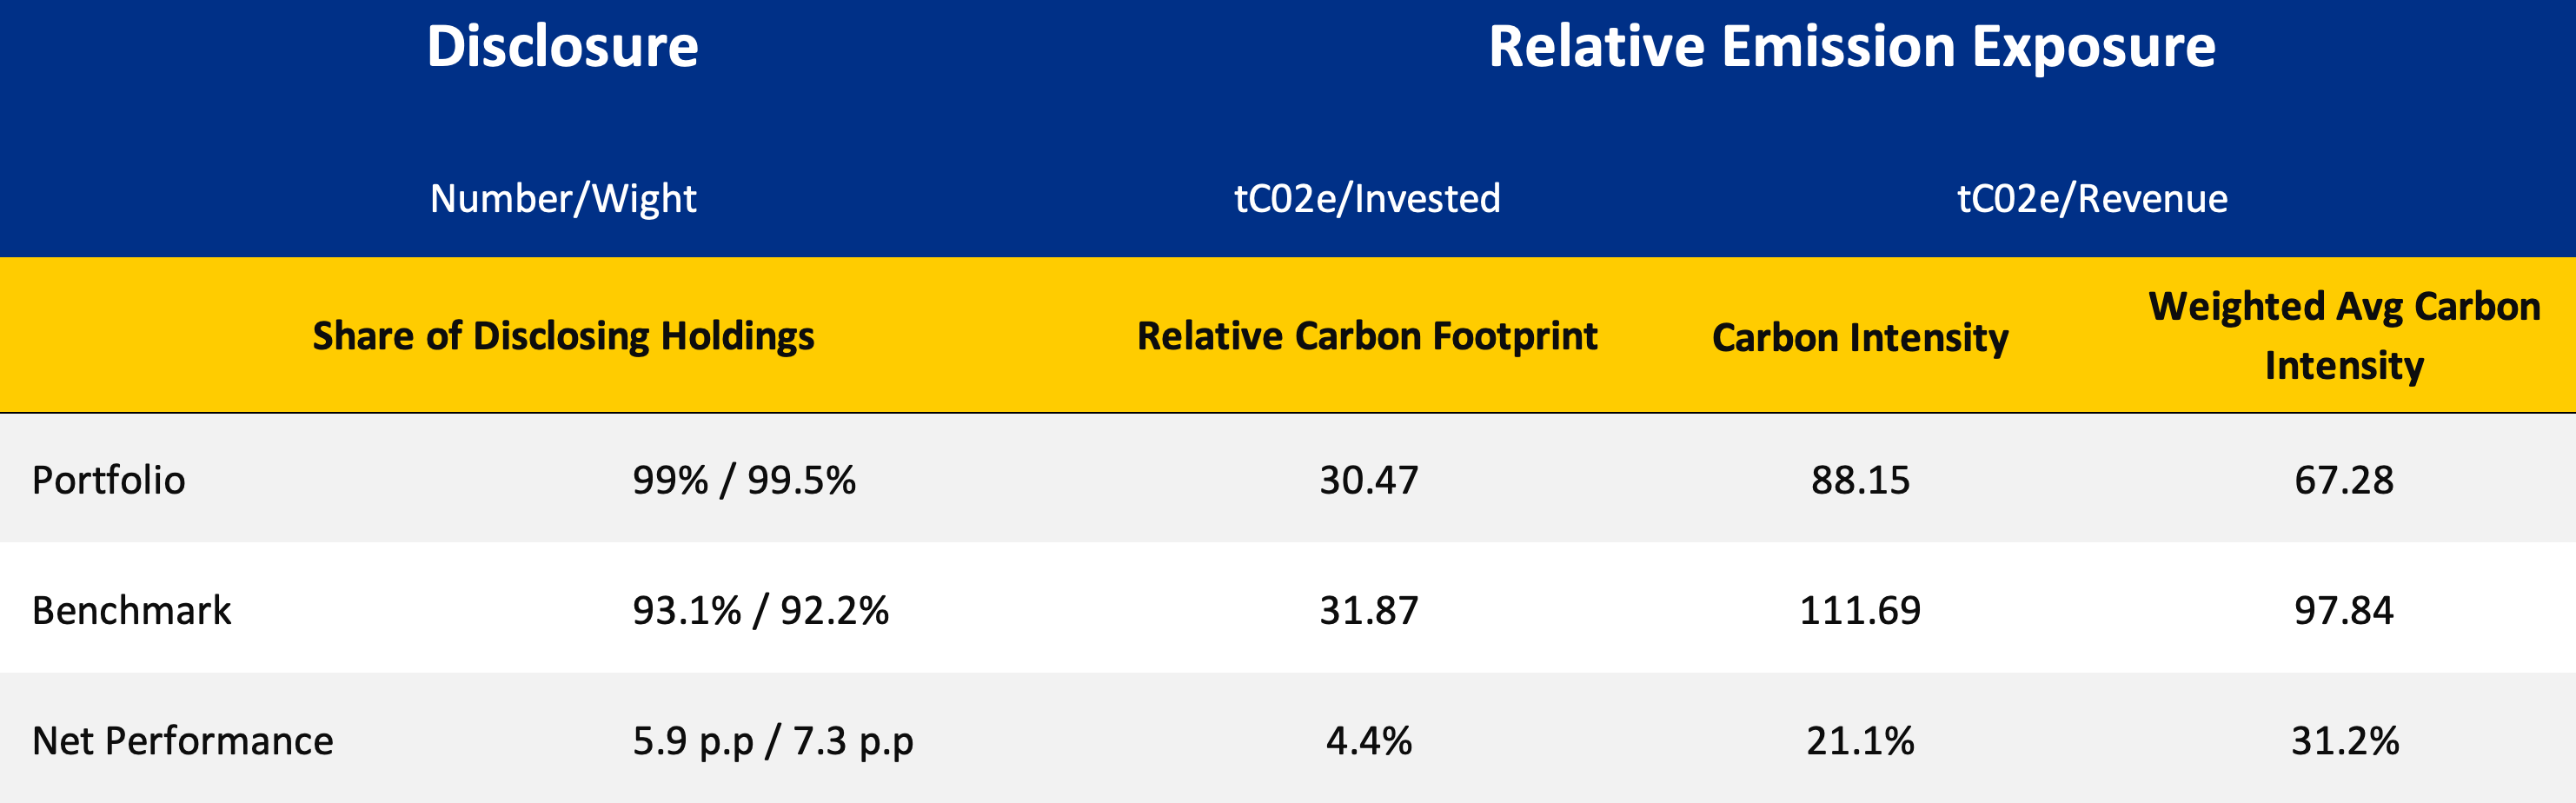
Figure 1 – Portfolio Overview, Climate Impact Assesment, SICAV end 2024.
The portfolio outperforms the benchmark on all three carbon metrics.
The relative carbon footprint of the portfolio amounts to 30,47 tCO2e/EUR million. The carbon intensity is 88.15 tCO2e/EUR million. The weighted average carbon intensity is 67.28 tCO2e/EUR million.
Note that the sector composition of the portfolio differs significantly from the benchmark due to certain methodological choices. For example, Etica’s portfolio includes a much smaller number of issuers in the low-emission financial sector[3], which accounts for around 17% of the benchmark but only 7% of the portfolio. Ultimately, a portfolio with a higher proportion of assets allocated to an emissions-intensive sector will have a higher GHG exposure. However, this can be offset by selecting less emission-intensive issuers from that sector.
When analysing how emissions are allocated, the impact of Etica’s decision becomes even clearer.
The table below shows the sectors with the highest emissions in the analysis, the comparative weight of each issuer in each sector between the portfolio and the benchmark, and the effects of sector allocation and issuer selection. A positive (green) figure of 4% indicates that the issuer has less GHG exposure in the portfolio than in the benchmark. A portfolio with a larger proportion of assets allocated to an emissions-intensive sector will ultimately have a higher exposure to GHG emissions. However, this can be offset by selecting less emissions-intensive issuers from that sector.
In particular, the methodological choice not to invest in the energy sector and to apply rigorous climate evaluations to companies involved in fossil fuels (mainly from the utilities sector) addresses these results.
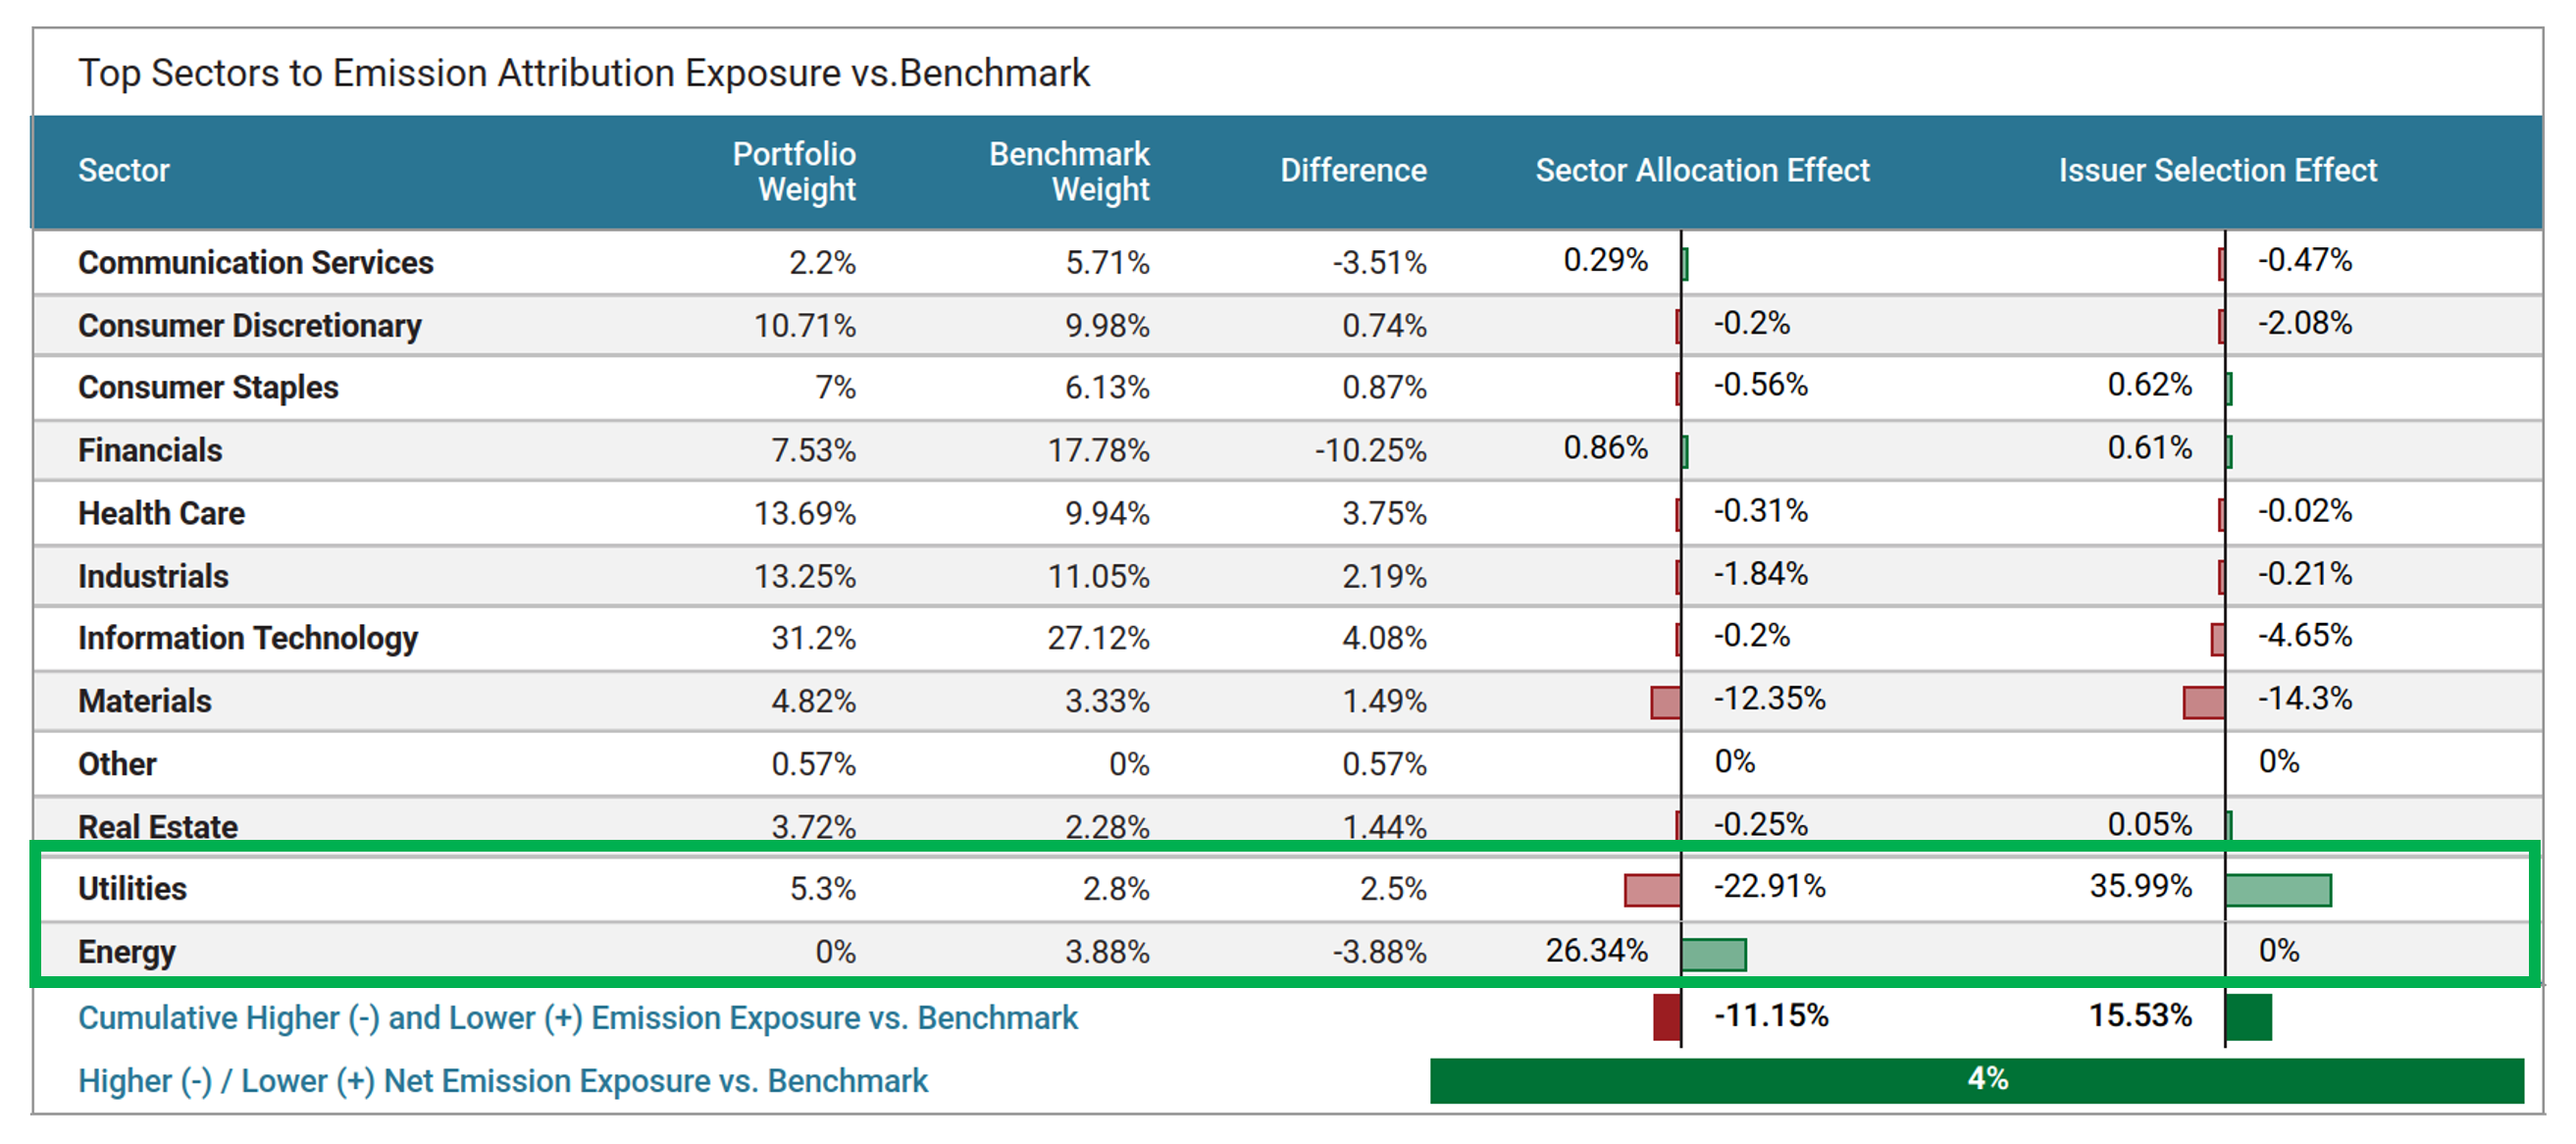
Figure 2 – Emission Attribution Analysis, top sector emission attribution exposure portfolio vs benchmark.
Y-o-Y SICAV Comparison
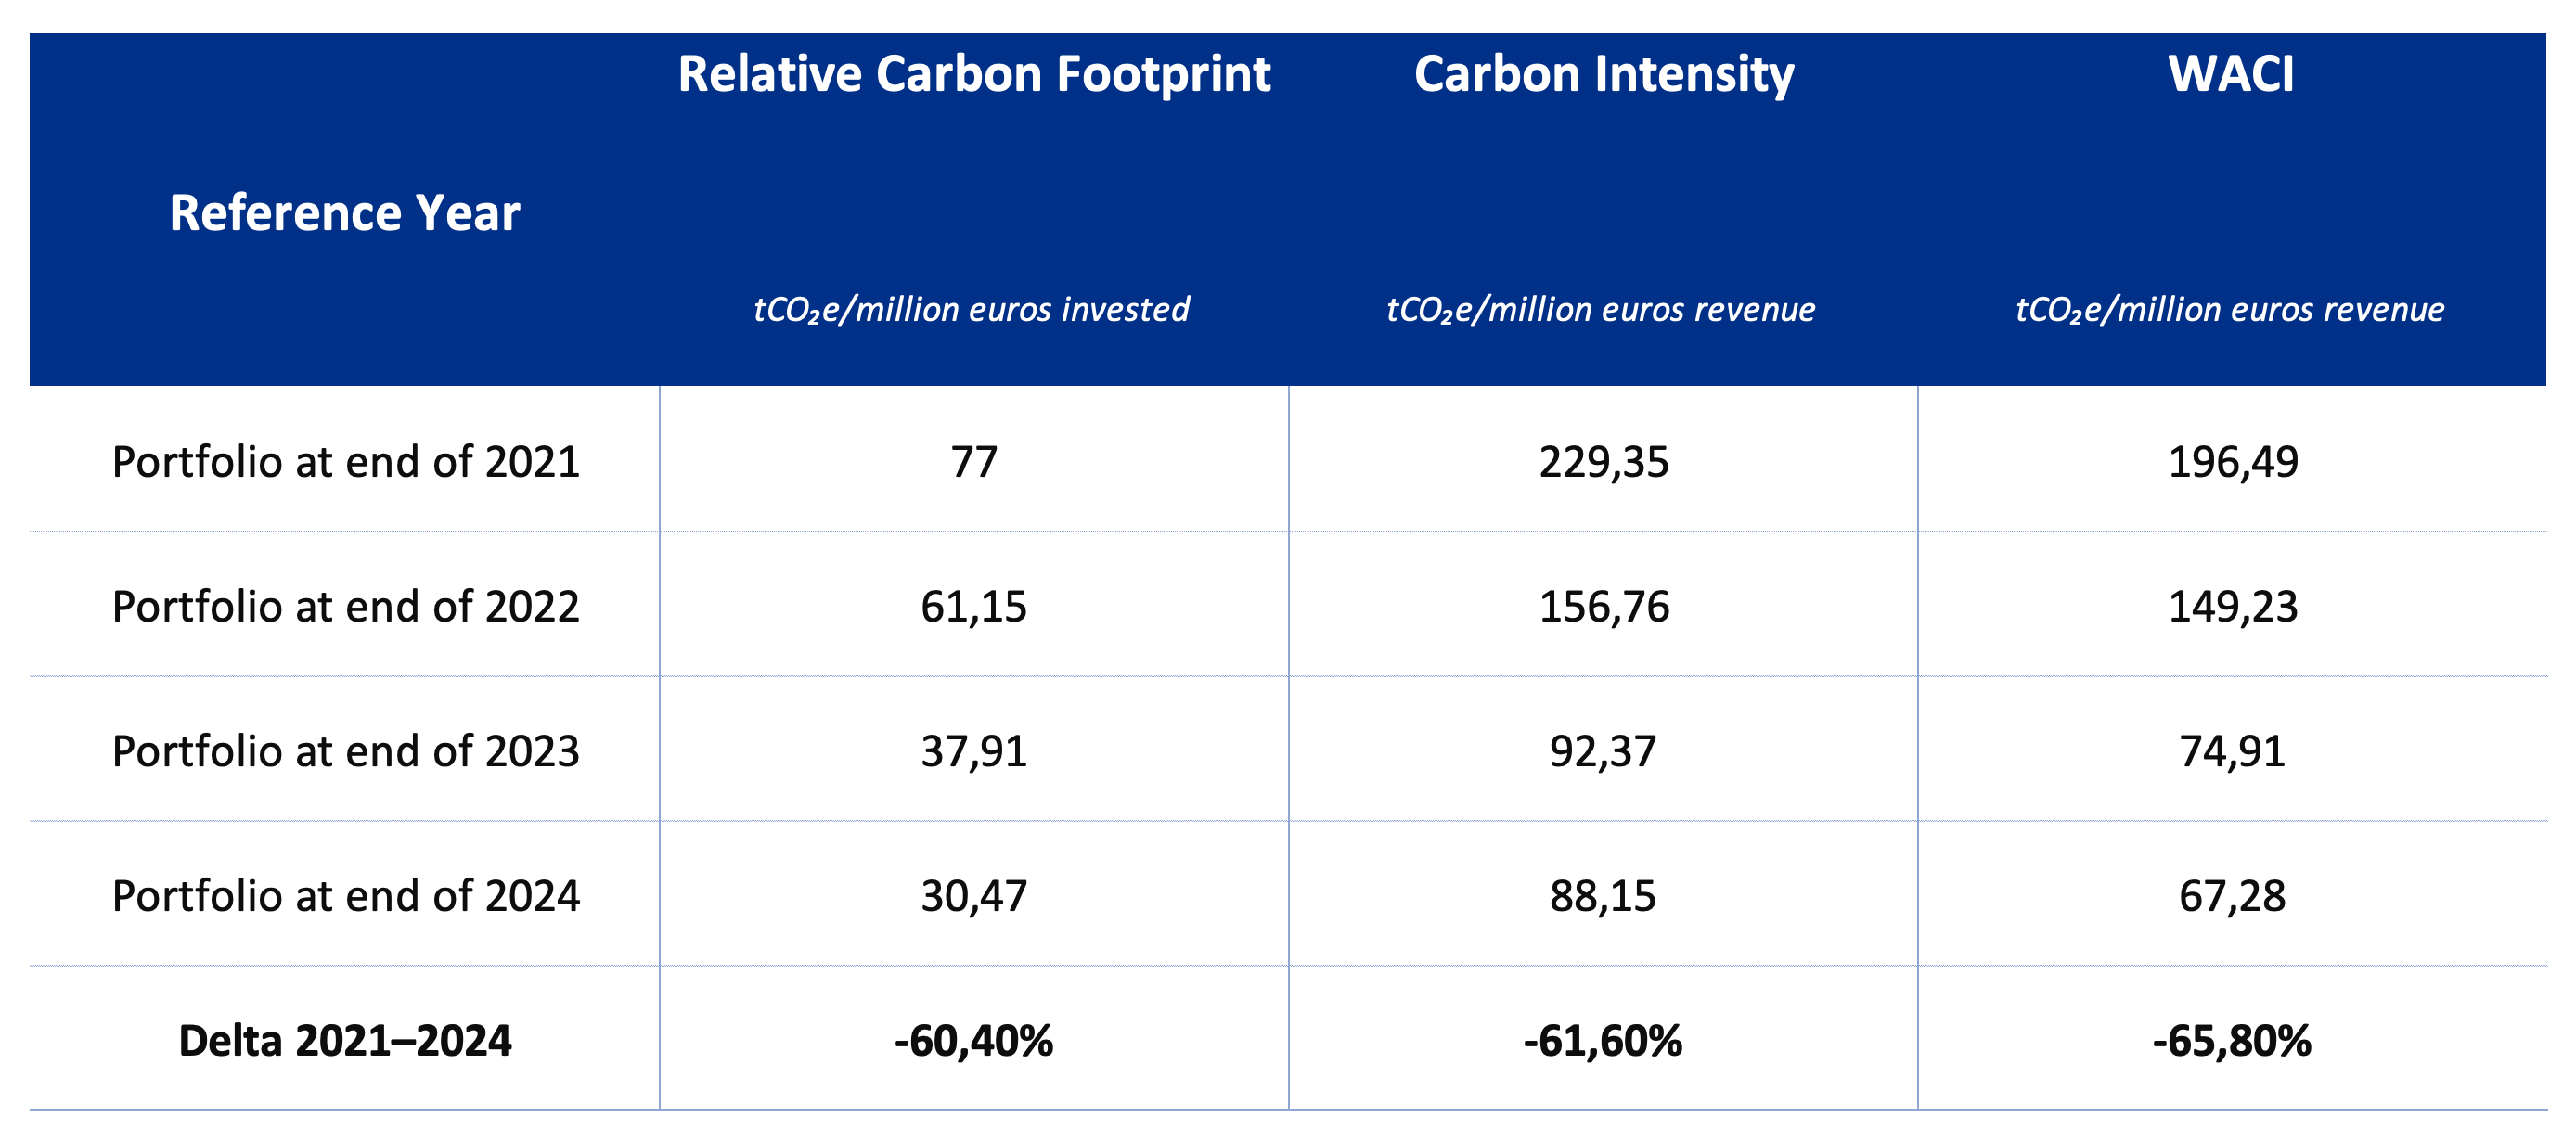
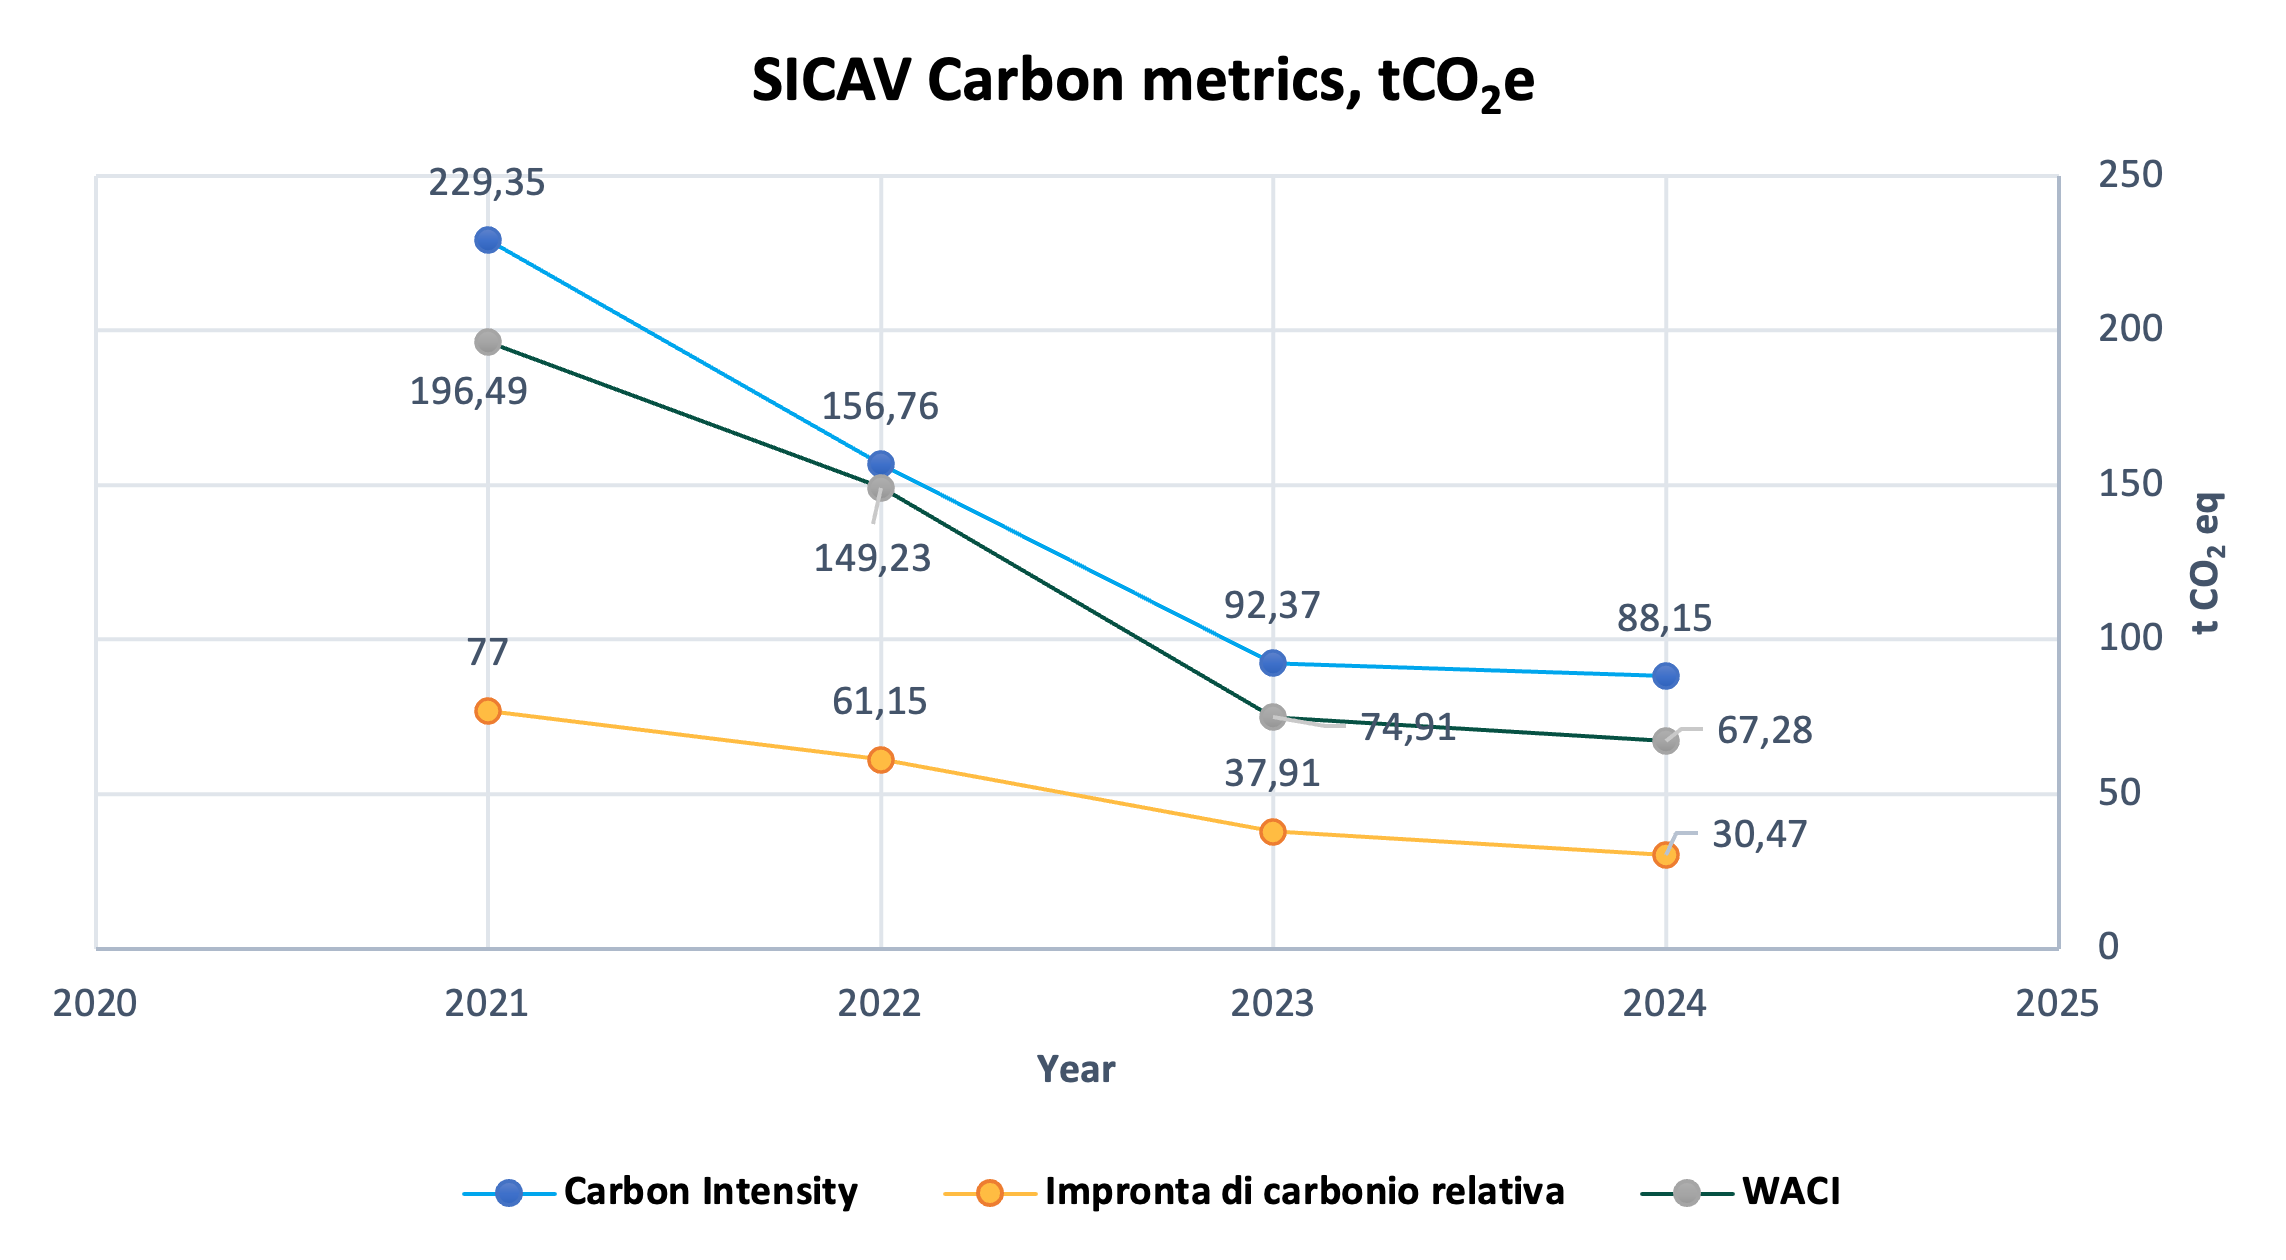
All metrics substantially decreased from 2021 to 2024, with carbon intensity falling by 61%.
In 2021 and 2022 Etica Funds endeavored to reduce the climate impact of funds by the systematic inclusion of a specific climate impact valuation model in its selection methodology. As of June 2023, the climate assessment has been fully applied.
As no updates have been implemented since 2024, we have experienced a stable but lower decrease in all metrics.
- The relative carbon footprint decreased by 60.4%;
- The decrease in carbon intensity of 61.6%;
- The WACI decreased by 65.8%.
Scenario Analysis
The purpose of the scenario analysis is to examine the current and future emission intensity from the direct and indirect emissions of a company (GHG scope 1&2) to see which climate scenario it is aligned with, until 2050. Each company’s carbon budget is defined based on its current and estimated future market share.
The scenario analysis compares the current and future portfolio’s GHG emissions with the carbon budget estimated in different IEA scenarios: Sustainable Development Scenario (SDS)[4], Announced Pledges Scenario (APS) and Stated Policies Scenario (STEPS)[5]. Each scenario is tied to a carbon budget, i.e. a limited amount of carbon fossils that can be combusted worldwide to remain within a certain temperature. The carbon budget changes depending on the scenario, with the Sustainable Development Scenario being the most ambitious one, consistent with a global temperature increase well below 2°C by 2100, compared to pre-industrial levels.
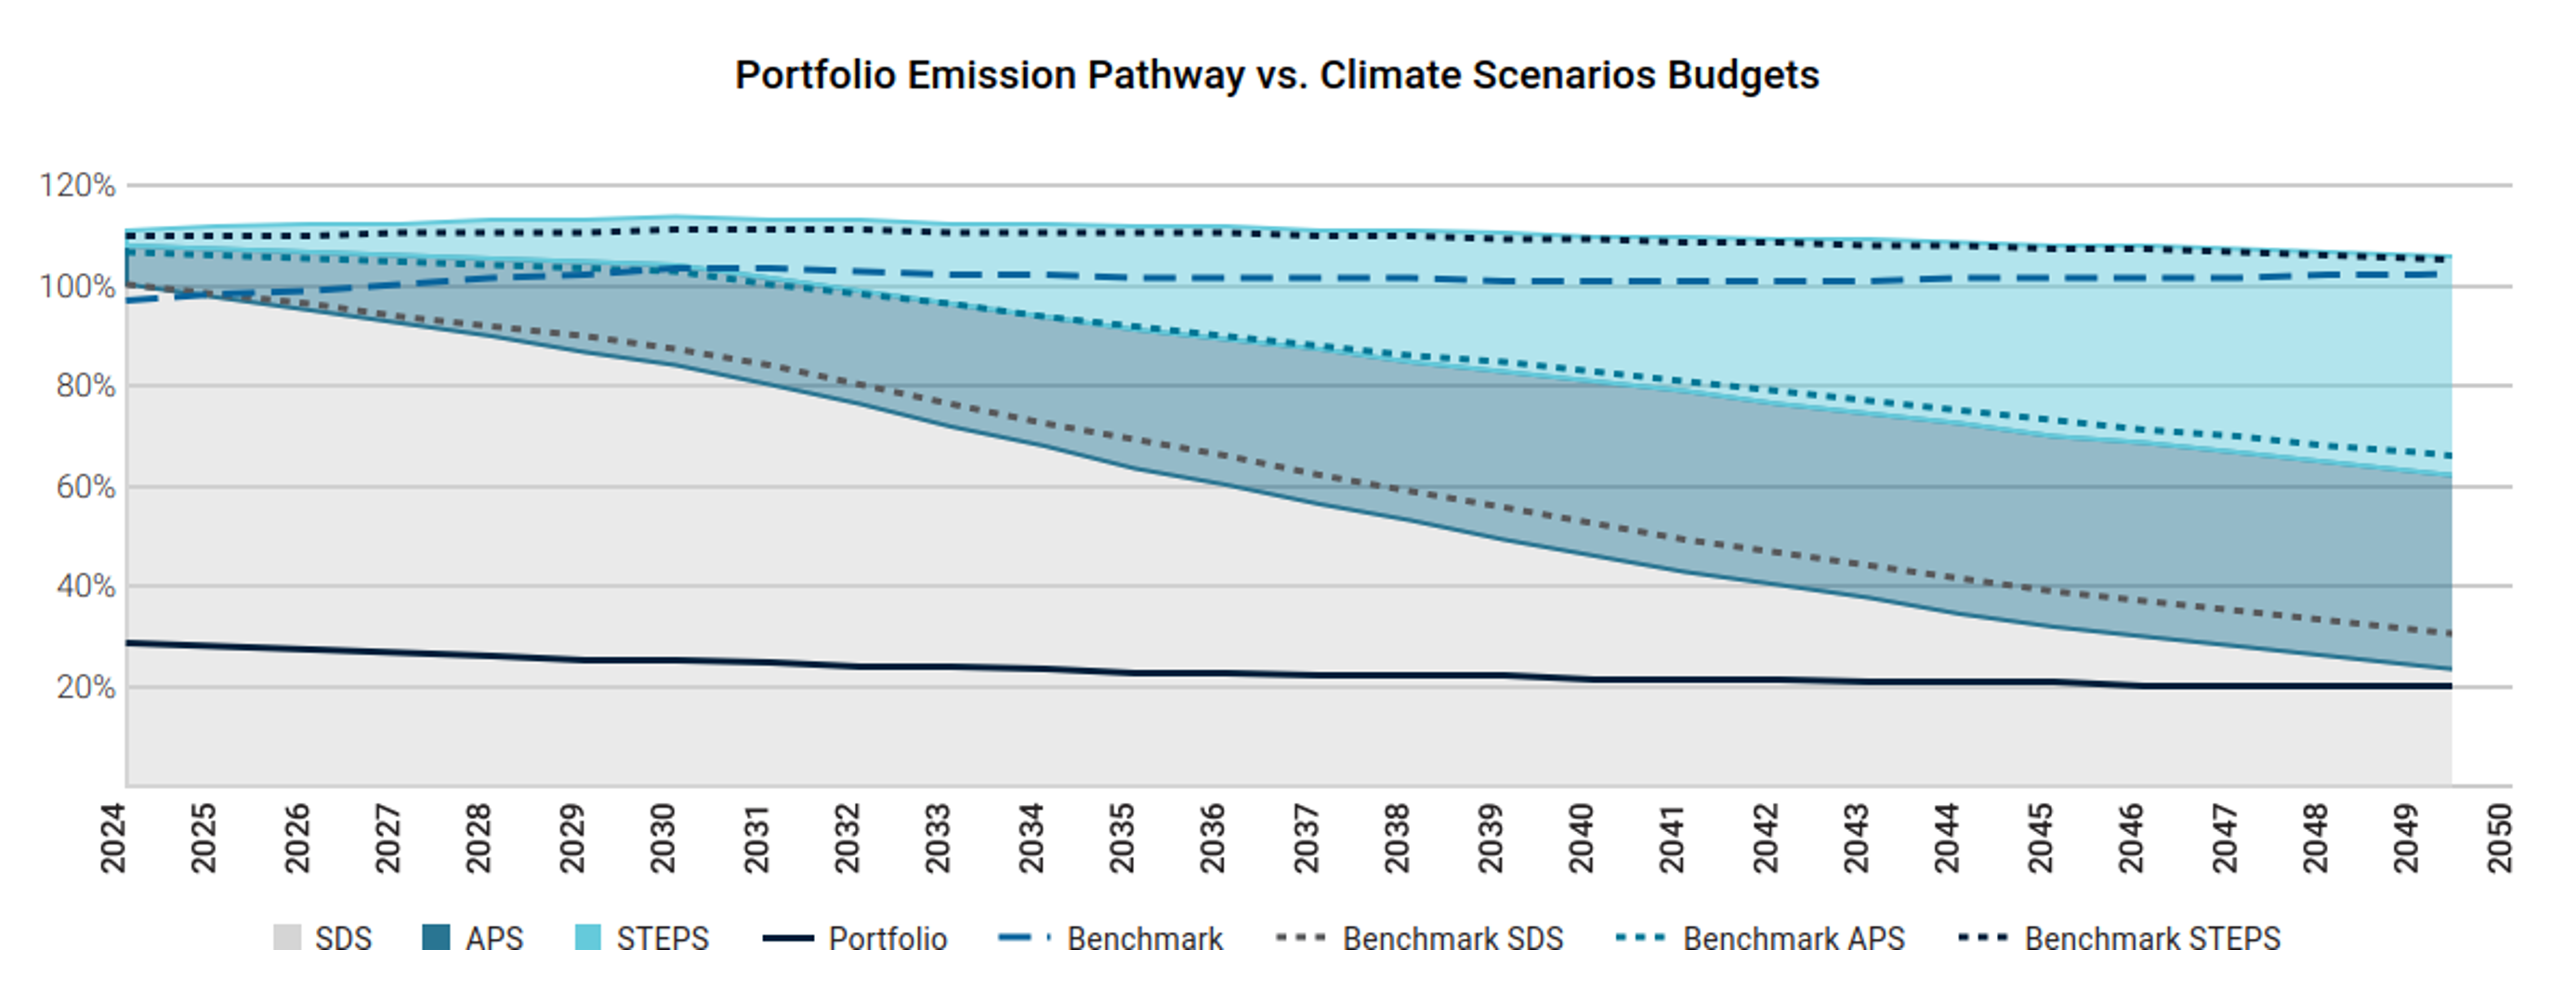
Figure 3 – Aligment Analysis for SICAV Funds, ISS Climate Impact Report 2025.
The analysis shows that the current state of the portfolio is consistent with a 2050 SDS scenario.
This means that, also this year, the SICAV has a potential temperature increase of 1.5°C.
In the analysis performed in 2022, Etica’s portfolio was associated to a temperature increase of 1.7°C by 2050, and an overshoot of the carbon budget associated with the SDS scenario in 2043.
This result shows a continues improvement in the funds’ carbon footprint.
To make a comparison, the graph above also shows the scenario analysis for the index MSCI World ESG Universal Net Total Return (referred to as “Benchmark”) as a proxy for the equity market. The index exceeds the budget of the SDS scenario in 2026 and is associated with a temperature increase of 2.7°C by 2050.
The better performance of the portfolio compared to the benchmark is explained by two factors, linked to the sectorial allocation and the single stock selection:
- The exclusion of most fossil activities from the portfolio
According to Etica’s investment policy, there are no investments in companies operating in the Energy sector[6]. - A higher number of companies with a commitment to reducing emissions
As of 31.12.2024, according to ISS, 87% of portfolio’s value is committed to international climate goals and demonstrate future progress, against the 73% of the benchmark. Specifically, 70% of portfolio’s value is covered by a GHG reduction target approved by the Science-Based Targets initiative (SBTi), against 52% of the benchmark. Compared to last year’s analysis of the portfolio at the end of 2022, there’s a 7% increase in the number of companies covered by an SBTi approved target.
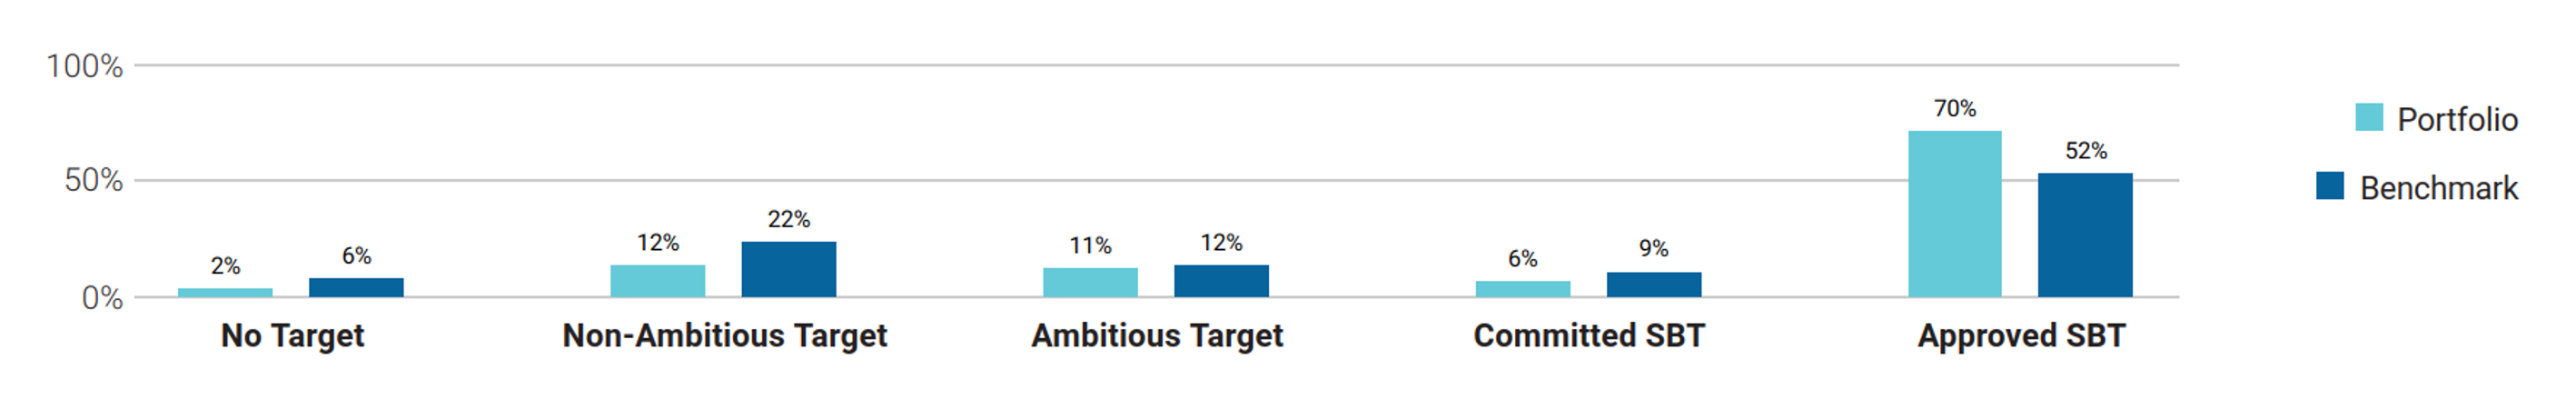
Figure 4 – Climate Target Assessment, portfolio vs benchmark.
Transitional climate risks analysis
ISS has developed a model that estimates the transition value at risk for portfolios based on the International Energy Agency’s (IEA) net zero scenario.
For Etica Valori Responsabili, this value is very low at only 2.2 million: about 4% of the total analysed value is potentially exposed to transition risk.
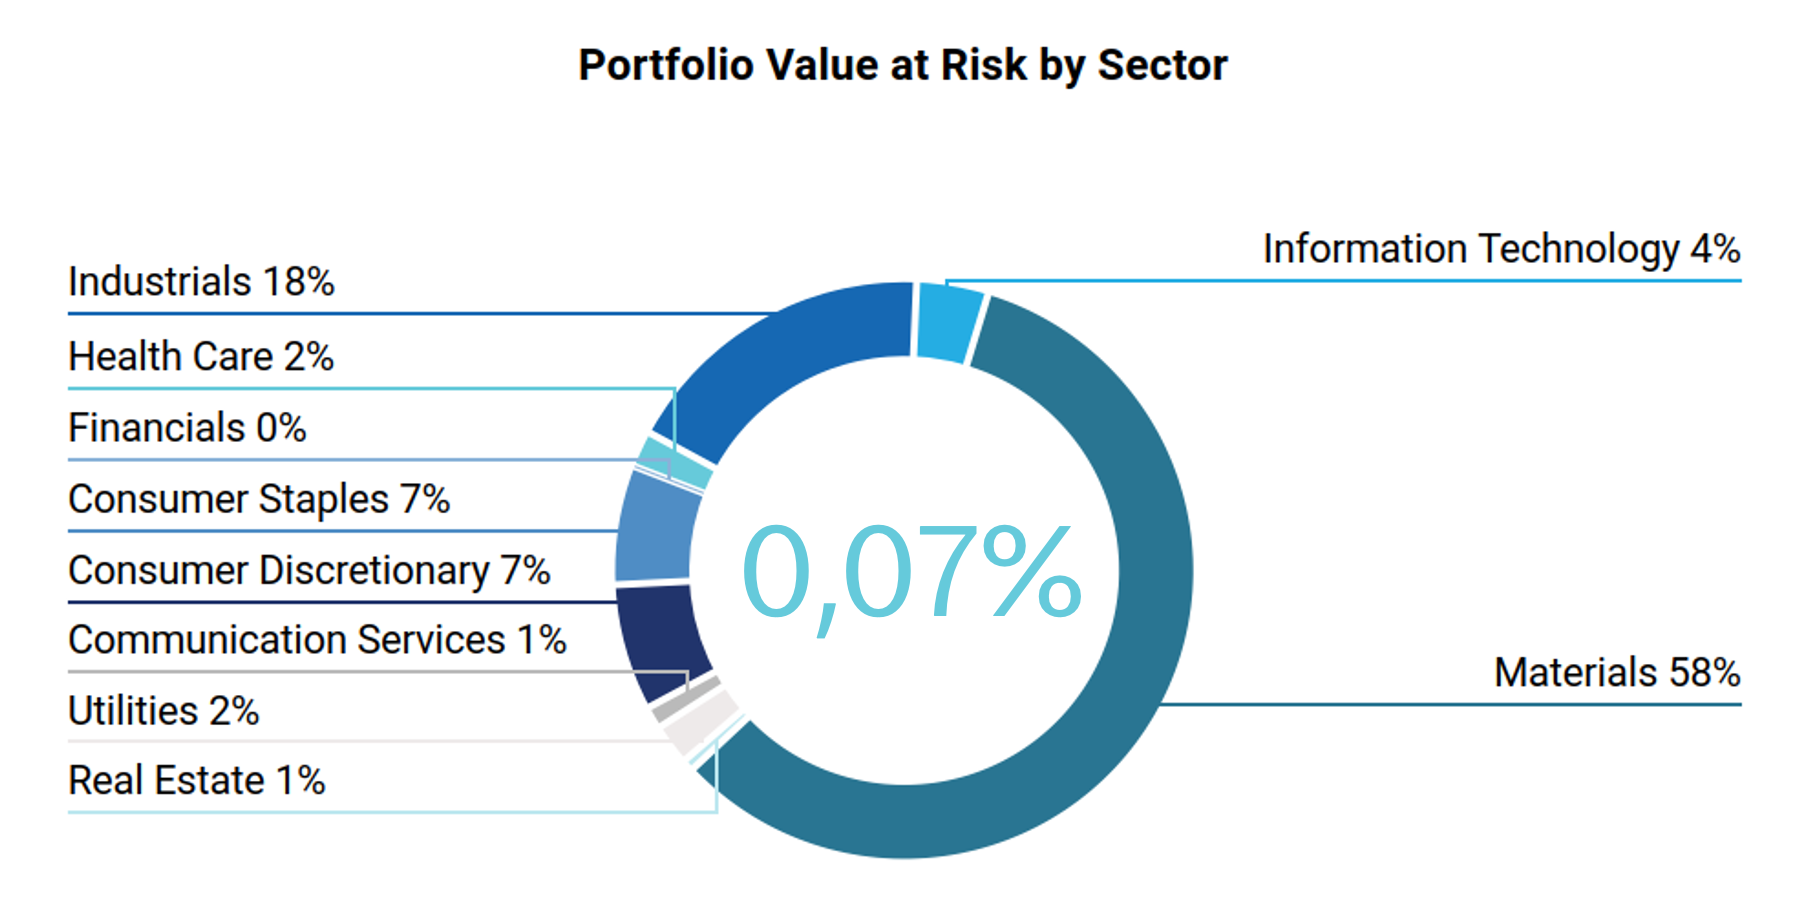
Figure 5 – Portfolio Transition Value at Risk by Sector Based on NZE2050 scenario.
As expected, the main issuers most exposed to this risk are in the materials sector. Despite this, these issuers are associated with a positive carbon risk rating: this synthetic measure evaluates an issuer’s capacity to manage climate risk and seize opportunities. Moreover, there is no direct exposure to unconventional and controversial energy extraction activities, such as fracking and arctic drilling.
The transitional climate risks analysis dives also into the power generation mix of the portfolio.
Of the overall power generation installed capacity by companies in the portfolio, 79.5% comes from renewables. An improvement on 72% of the 2024 TCFD.
In the benchmark index, the share of renewable energy capacity is around 25,8%.
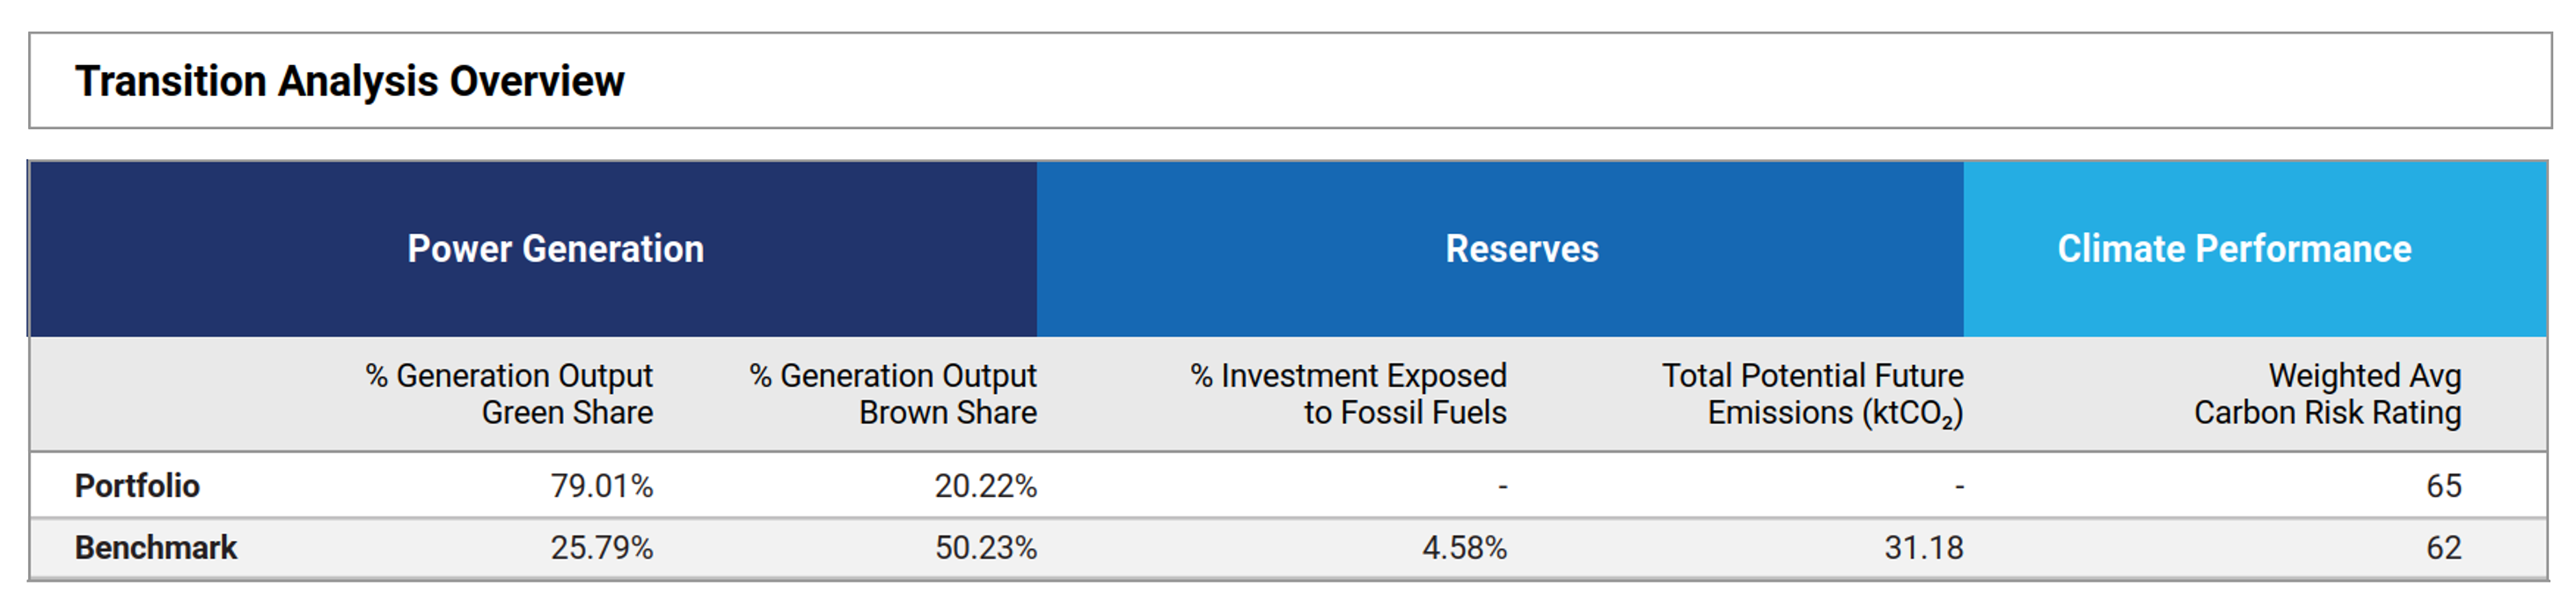
Figure 6 – Transitional climate risk analysis on SICAV portfolio as of 31.12.2024.
There is no exposure to fossil fuels, nor do any of the companies have fossil fuel reserves. This means that Valori Responsabili has no potential future emissions, whereas the benchmark is associated with 31,176 tCO₂ of future emissions.
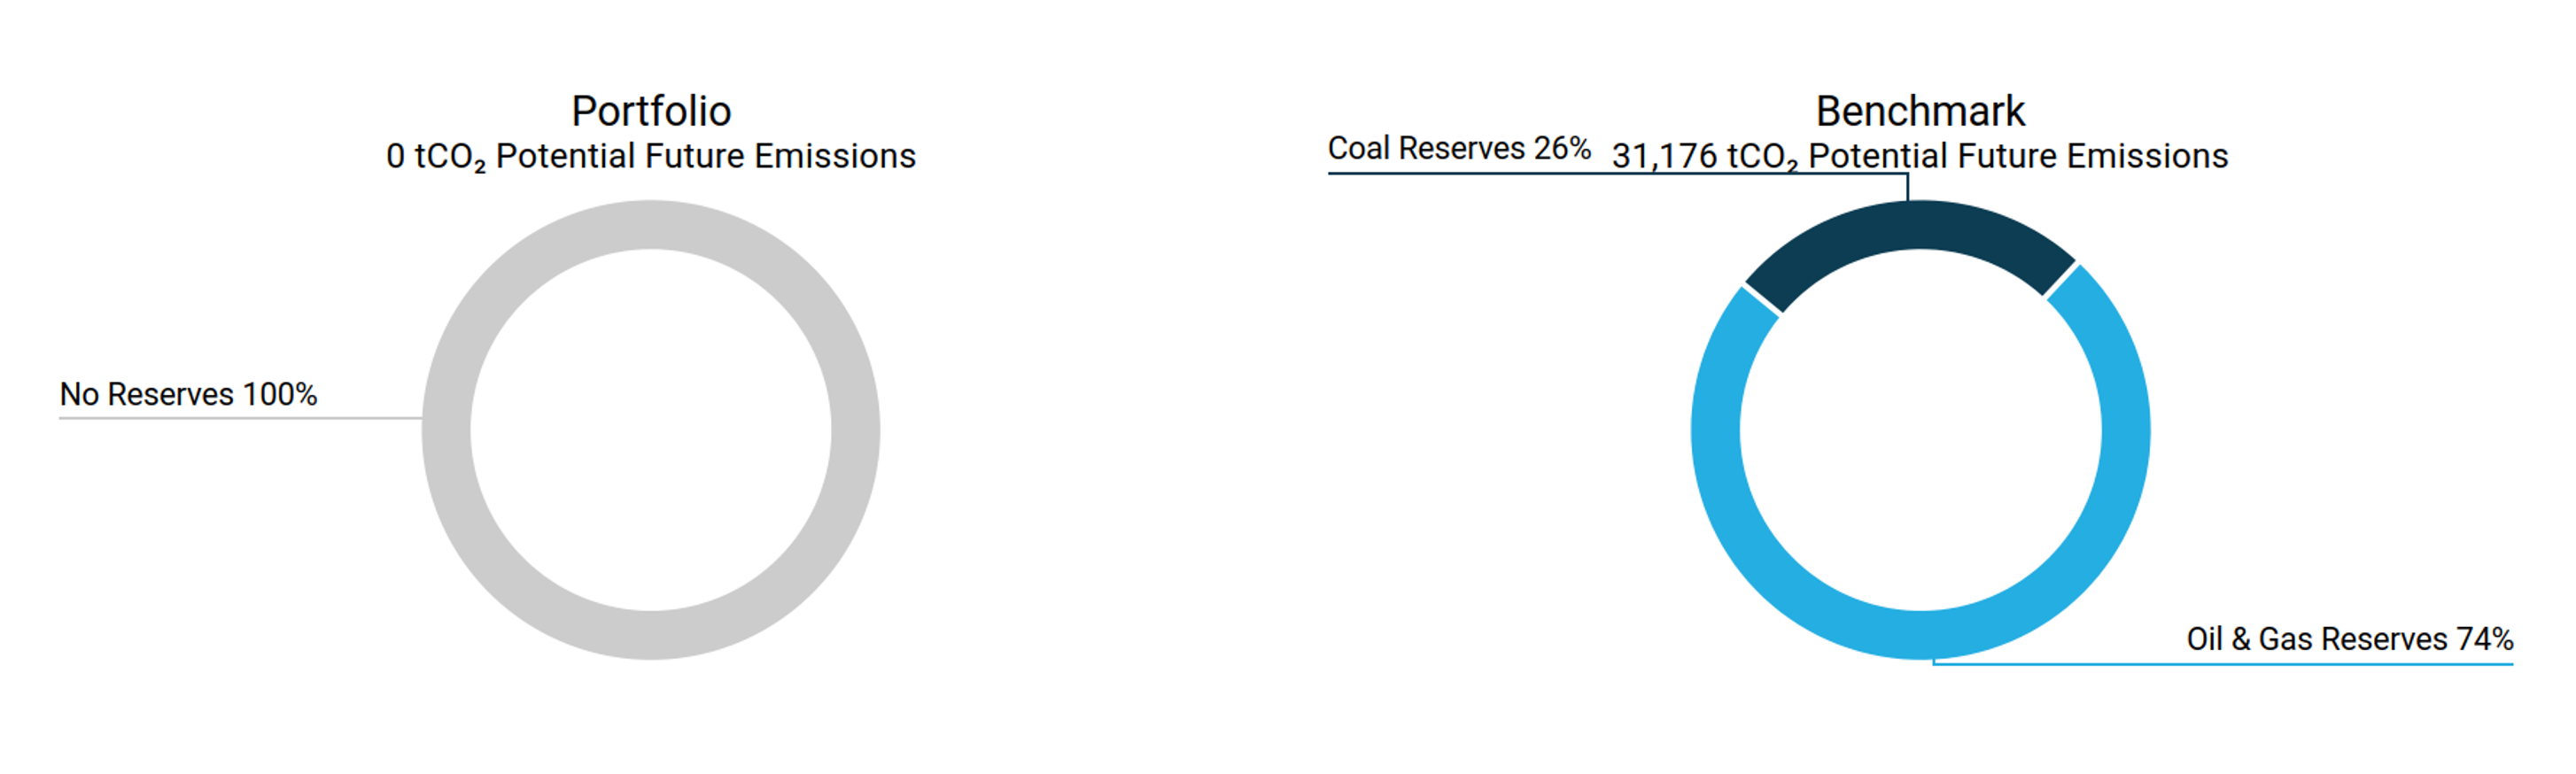
Figure 7 – Potential future GHG emissions associated with companies with fossil reserves.
Finally the current energy generation mix of the portfolio exhibits a higher share of renewables than in the Sustainable Development Scenario of the International Energy Agency in 2030, which envisages 84% of renewables in 2050 and 53% in 2030.
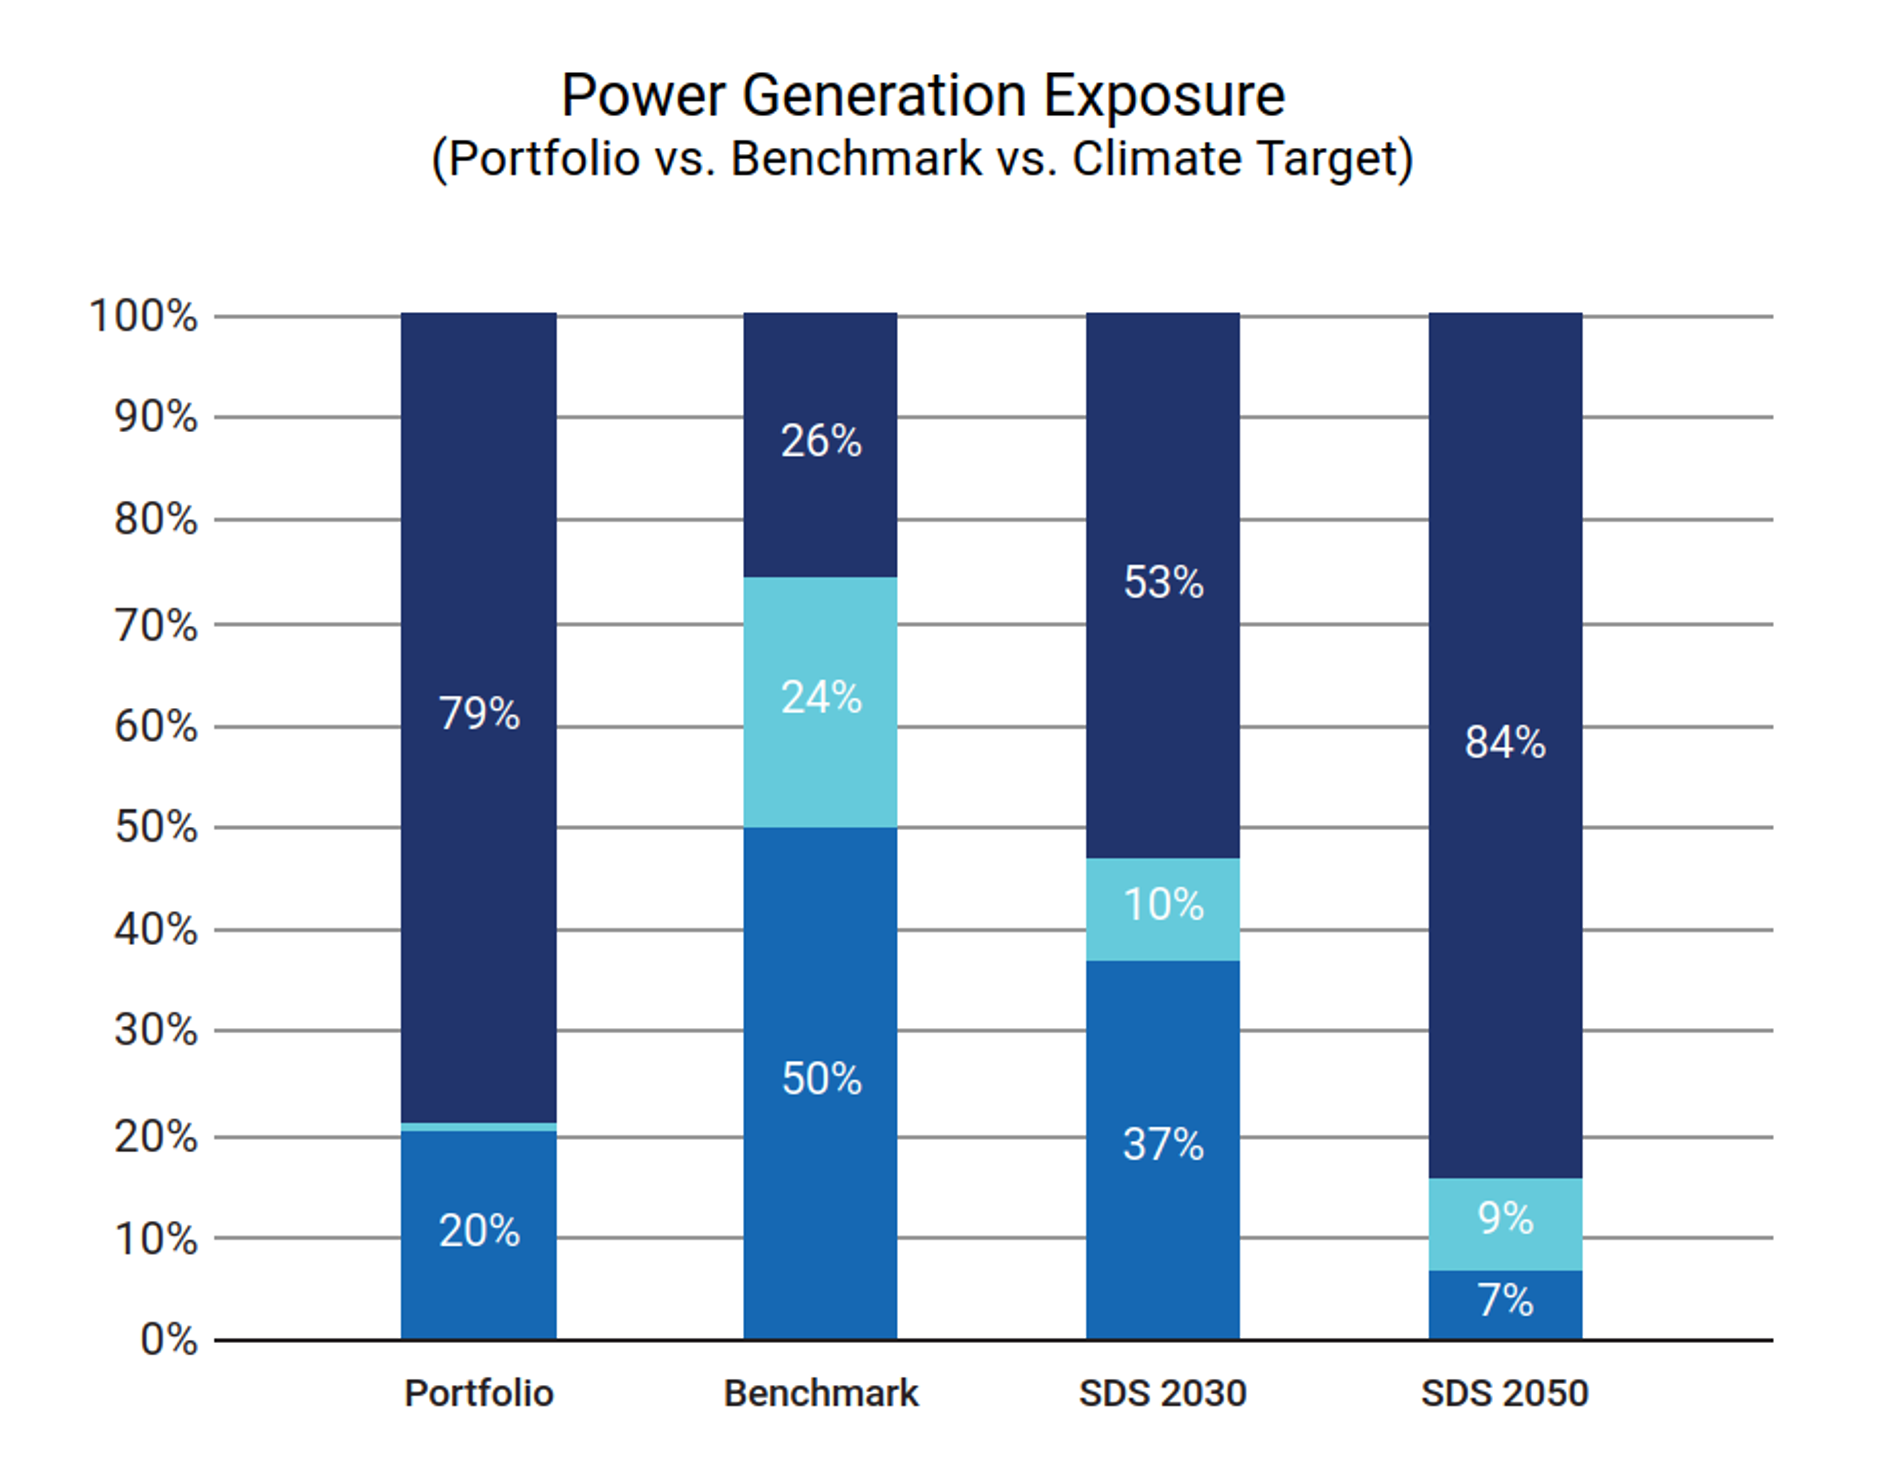
Figure 8 – Power Generation Exposure. Renewable energy is indicated by dark blue, while sky blue represents nuclear power and mid blue is for fossil fuels.
Physical risks
Even if the temperature increase is limited to 2°C, the climate system will change. This will include an increase in physical risks, such as floods, droughts and storms. This analysis evaluates the climate hazards that will have the greatest financial impact, considering how they might affect portfolio value[7].
In this scenario, the portfolio value at risk by 2050 is estimated to be 259.600 EUR, with Industrials, Information technology and Consumer Discretionary being the most exposed ones. This represents a 0,56% loss in the overall portfolio value. The value at risk rises to 431.219 EUR if a worst-case scenario is employed, assuming a temperature increase over 3.2°C.
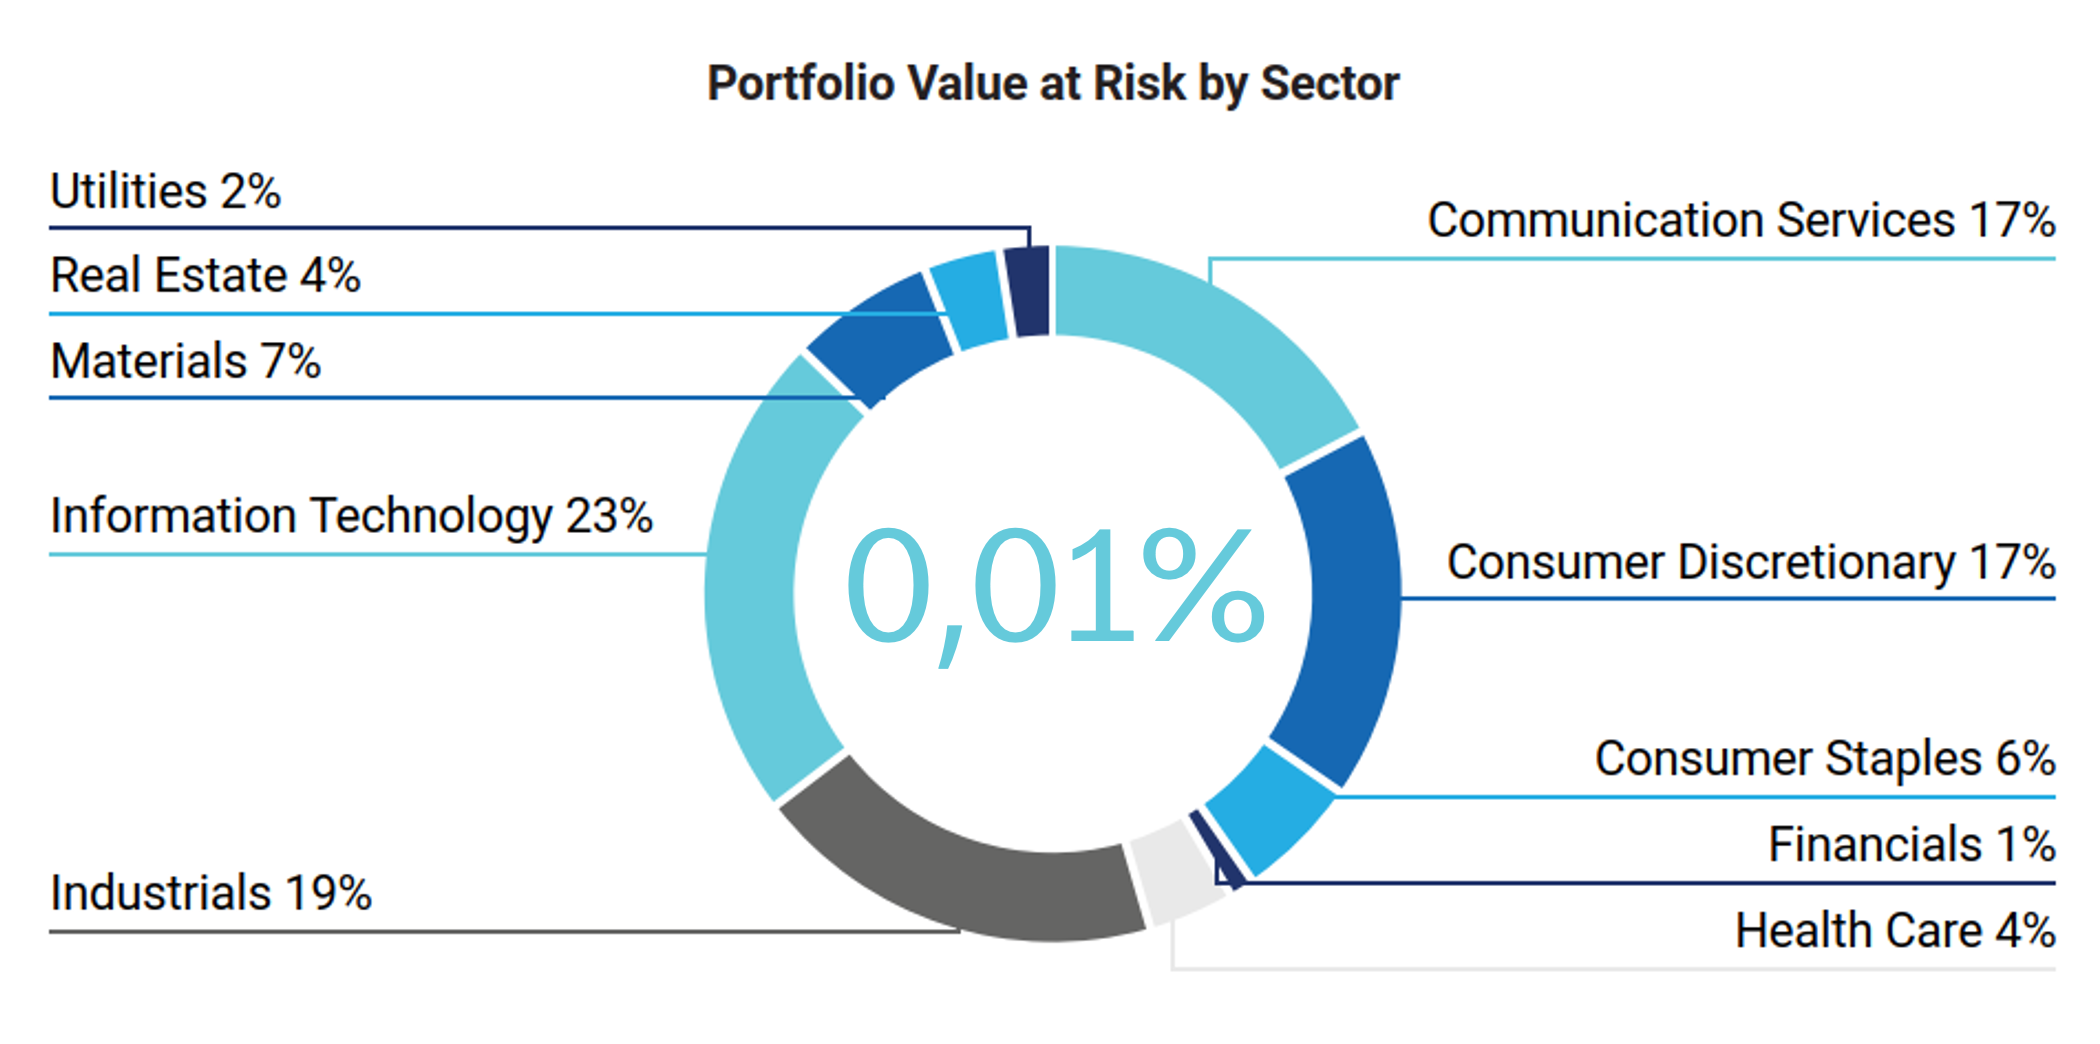
Figure 9 – Physical Risk Analysis, SICAV value at risk at the end of 2024.
However, based on the ISS assessment, only 10% (12% in 2024 analysis) of issuers have a weak physical risk management strategy and 55% have a robust strategy (53% in 2024 analysis).
Note that only 10% of Etica companies are not covered/without a strategy, compared to 29% of the benchmark.
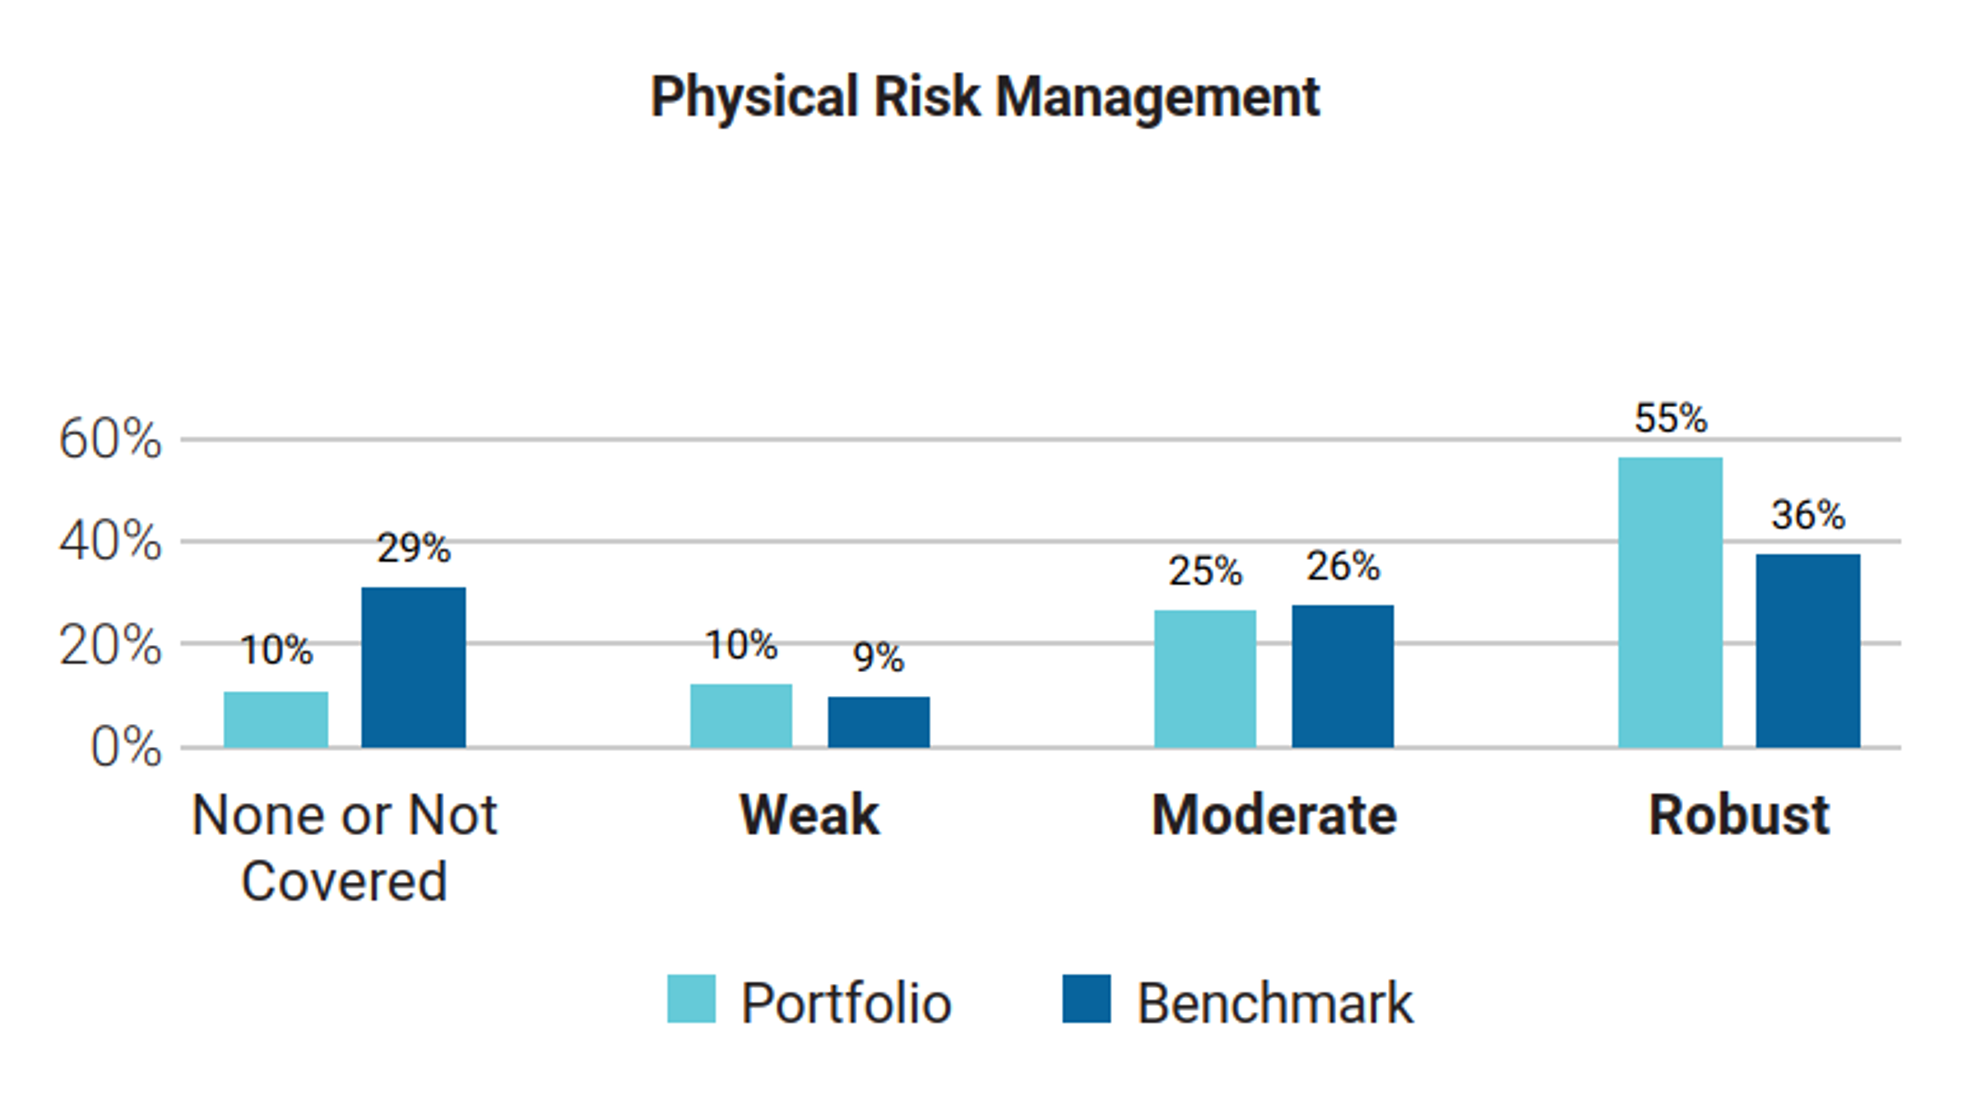
Figure 10 – Physical Risk Analysis, risk management portfolio vs benchmark.
Conclusions
The main outcome of the 2021 analysis was the introduction of a specific assessment for companies in the Materials sector, which is the largest contributor to the carbon intensity of the overall portfolio. In 2022, a specific climate assessment has been included in the methodology to better monitor the GHG emissions of companies operating in the materials, industrials and utilities sectors. The impact of this change will be fully applied to portfolio selection by June 2023.The stable and positive results presented in this report represent the improvement in climate performance resulting from this change.
However, the carbon intensity of the portfolio at the end of 2024 is lower than in previous years and steadily decreases over time.
The scenario analysis shows that the portfolio is now aligned with a projected temperature increase of 1.5°C.
Moreover the portfolio’s transitional and physical risk levels are both very low and the percentage of renewable energy is higher than in the IEA’s 2030 Sustainable Development Scenario.
Sovereign emissions
This Sovereign analysis compares the carbon emissions and other carbon related characteristics of the underlying portfolio with the benchmark. The tables below include absolute and relative figures for portfolio carbon emissions as well as intensity measures for both production and government emissions.
“Emission Exposure” section measures the carbon footprint of a sovereign portfolio. Scope 1 Emissions are in tCO₂e while Scope 2 and Scope 3 Emissions are only in CO2 Emissions.
Relative carbon footprint is defined as the total carbon emissions of the portfolio per million invested.
Carbon intensity is expressed as the weighted average carbon emissions per million of PPP adj GDP as a proxy of the carbon efficiency per unit of output.
To account for the different calculation possibilities as well as to offer various perspectives, ISS ESG provides data for the following two different sovereign emission categories:
- Production Emissions: Emission footprint of a country’s production with its imports according to the latest PCAF guidelines released in December 2022.
- Government Emissions: This approach takes into account that a government bond co-finances both direct emissions from the public sector and investments made by the government. This approach is no longer recommended by PCAF. However, ISS will still provide in the time being government emissions.
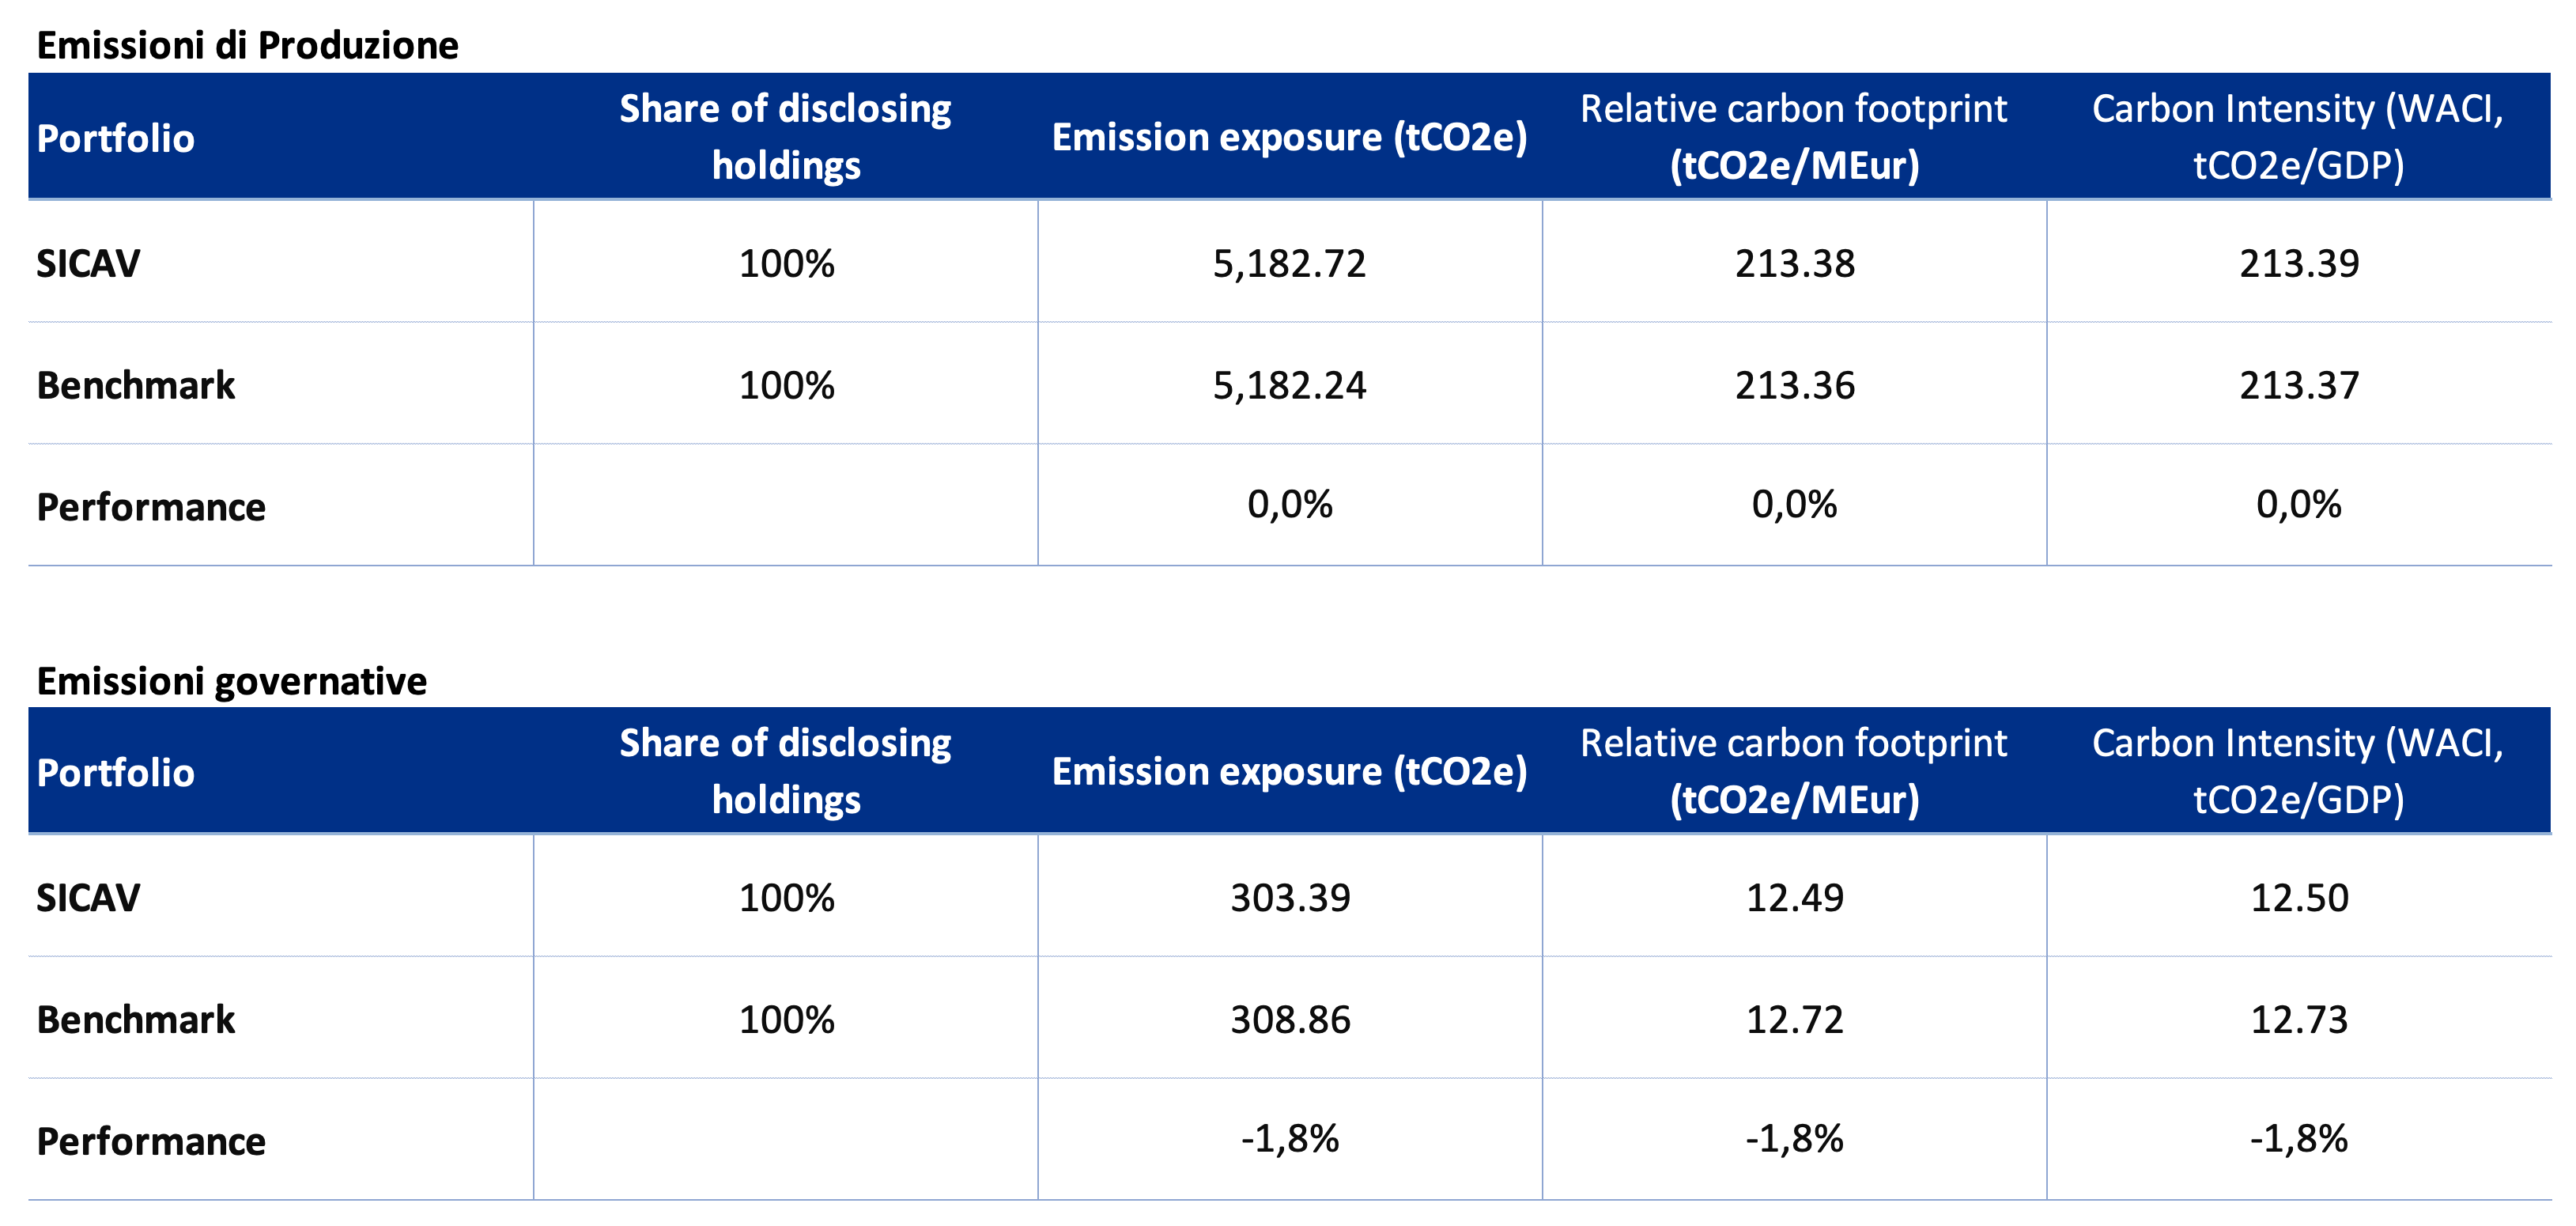
In general, performance is in line with the benchmark, with only a very small difference.
This is because the composition of the sovereign portfolio has not changed significantly and remains in line with the benchmark composition and last year’s portfolio. We have an overexposure to Italy, but this is almost offset by an underexposure to Germany, which is another country with high emissions.
Please note that the methodology does not currently account for any strong climate selection for the sovereign issuer.
Furthermore, this analysis does not consider the type of bond but only assesses the climate performance of individual countries.
The type of bond consideration could be an area for improvement in the 2026 analysis.
Reference
[1] https://www.issgovernance.com/esg/
[2] Launched after the 2015 Paris Agreement by the Financial Stability Board (FSB), the Task Force on Climate-related Financial Disclosure (TCFD – https://www.fsb-tcfd.org/) considers climate transparency as a crucial factor for the stability of financial markets. The objective of the TCFD is therefore to improve climate transparency in financial markets through recommendations on disclosure. These recommendations provide a “consistent framework that improves the ease of both producing and using climate-related financial disclosures”. The TCFD aims to create a unique standard for both corporate and investment disclosure, understanding that local regulatory frameworks may require different compliance levels. By October 12, 2023, the TCFD had fulfilled its mission and disbanded, although it remains a valid guideline for assessing and reporting on climate-related risks.
[3] Etica Funds doesn’t invest in the “traditional” financial sector (i.e. banks and asset managers), but only in digital payment methods that are classified as “financials” according to the GICS classification system.
[4] The Sustainable Development Scenario is not more developed in the World Energy Outlook 2022 by the International Energy Agency. However, to guarantee comparability with previous years, this edition of the report still relies on it.
[5] Details on the scenarios and on underlying assumptions are available at World Energy Model – Analysis – IEA
[6] Specifically, Etica does not invest in companies included in the following sectors (according to BICS classification): Oil Exploration & Production, Integrated Oils, Oil & Gas Services & Equipment, Oil, Gas & Coal, Pipeline, Mining Services, Precious Metal Mining, Coal Operations and Other Mined Minerals.
[6] ISS employs a model to estimate potential value losses arising from changes in share price due to physical climate risks by 2050, computing the Value at Risk (VaR) of each issuer.
This is a marketing communication.
This communication has been produced by Etica SGR S.p.A., in its capacity as investment manager and global distributor of the sub-funds Etica ESG Global Equity, Etica ESG Dynamic Allocation, and Etica ESG Conservative Allocation (the “Sub-Funds”) of the Luxembourg-domiciled UCITS Multilabel Sicav, established by Carne Global Fund Managers (Luxembourg) S.A. (“Carne LUX”), and is intended exclusively for professional investors.
Investing in the Sub-Funds involves acquiring shares of the SICAV and entails risks related to possible fluctuations in the value of those shares, which in turn reflect the performance of the financial instruments in which the Sub-Funds’ resources are invested. Investors should only make an investment decision regarding the Sub-Funds after having fully understood their overall characteristics and the degree of exposure to related risks, by carefully reading the Prospectus and the Key Information Document (KID), which – together with information regarding sustainability aspects pursuant to Regulation (EU) 2019/2088 – are available at www.eticasgr.com.
Investing in the Sub-Funds offers no guarantee of returns and does not ensure the reimbursement of the capital initially invested. Any future returns are subject to taxation, which depends on the personal situation of each investor and may change over time.
This communication does not take into account the investment objectives, financial situation, or specific needs of any potential recipients. Therefore, it should in no way be interpreted as investment advice. Recipients of this communication assume full and sole responsibility for the use of the information contained herein, as well as for any investment decisions made based on it, since any use of this information as a basis for investment choices is not permitted and is entirely at the investor’s own risk.
The Sub-Funds are authorized for distribution in Italy exclusively to professional investors. However, the issuer may decide to terminate such distribution in Italy at any time. The Sub-Funds are not authorized for distribution in certain jurisdictions; therefore, no marketing activity may be carried out in those jurisdictions in relation to them. This communication may not be distributed to individuals other than the intended recipients, nor reproduced in any part, in any form, without the prior authorization of Etica SGR S.p.A.
.


 – Etica Impatto Clima")
 – Valori Responsabili")