This content is an extract of the Task Force on Climate-related Financial Disclosures (TCFD[1]) aligned Report released by the company ISS ESG[2] based on its proprietary methodology, in relation to the holdings of Etica’s Linea Valori Responsabili Funds.
All asset classes have been analyzed accordingly to the TCFD recommendations, grouped as follows: Equity Portfolio and Corporate Bonds Portfolio together and, Sovereign Bonds Portfolio.
The data analysis reports climate performance achieved at the year-end 2020.
The boundary of the analysis has been updated because the equity and corporate bonds portfolio have been grouped together to conduct the assessment at issuer level, for both asset classes.
The related carbon metrics used in the Equity and Corporate Bonds analysis are the following ones (please refer to Appendix for more details):
- Relative Carbon Footprint: a normalised measure, defined as the total carbon emissions of the Portfolio per million EUR invested. Any reference to relative carbon metrics in the Analysis refers to tCO2e/EUR million Invested;
- The Weighted Average Carbon Intensity (WACI): is the metric explicitly recommended by the TCFD for asset managers. The WACI allocates Scope 1 & 2 GHG emissions based on Portfolio weights and has among its positive aspects the fact that is simple to calculate and easy to communicate to investors and, most notably, it can be applied across asset classes as it does not rely on the ownership approach. Any reference to carbon intensity in the Analysis refers to tCO2e/EUR million Revenue.
The Data Analysis goes beyond the sole carbon footprint assessment by providing various metrics[3] used to assess climate-related risks and opportunities in forward-looking perspectives. In the scope of this extract, for the Equity and Corporate Bonds Portfolio, results will be reported on Scenario analysis, Transitional climate risk and Carbon Risk Rating. For the Sovereign Portfolio results are referring to carbon footprint assessment.
- Equity and Corporate bonds portfolio of Linea Valori Responsabili
- Sovereign Bonds portfolio of Linea Valori Responsabili
Equity and Corporate bonds portfolio of Linea Valori Responsabili
Carbon footprint analysis – Equity and Corporate bonds portfolio of Linea Valori Responsabili.
1. Relative Carbon Footprint
The Relative Carbon Footprint is crucial because it is based on the ownership principle, which is the key logic to the GHG protocol: one EUR million invested in the Equity and Corporate bonds Portfolio of the Linea Valori Responsabili is associated with 152.26 tCO2e and this is based on the investor’s “ownership” of the underlying companies.
The Portfolio Scope 1 & 2 emission exposure and Relative Carbon Footprint (tCO2e / EUR million Invested) are higher than the benchmark, mostly driven by higher exposure to the carbon-intense sectors such as Materials and Industrials.
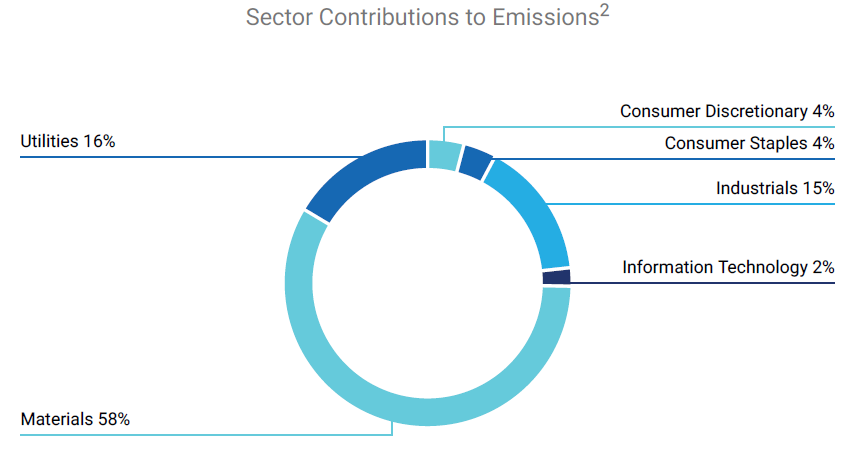
Sectoral Contribution to the Equity and Corporate Bond Portfolio of the Linea Valori Responsabili’s Scope 1 & 2 Emission Exposure
2. Weighted Average Carbon Intensity – WACI
The Equity and Corporate bonds Portfolio’s WACI is 290.66 tCO2e per one EUR million of revenue, higher than the benchmark.
This is mainly due to higher exposure to Materials sector, among other carbon-intense sectors.
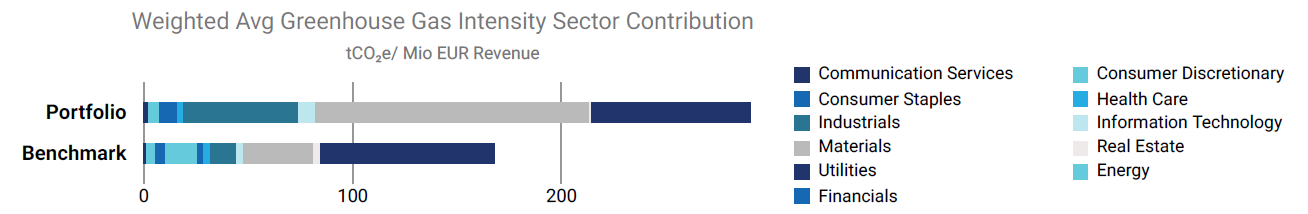
Sectoral Contributors to the WACI of the Equity and Corporate Bond Portfolio of the Linea Valori Responsabili.
-
SUSTAINABLE DEVELOPMENT SCENARIO (SDS) ANALYSIS
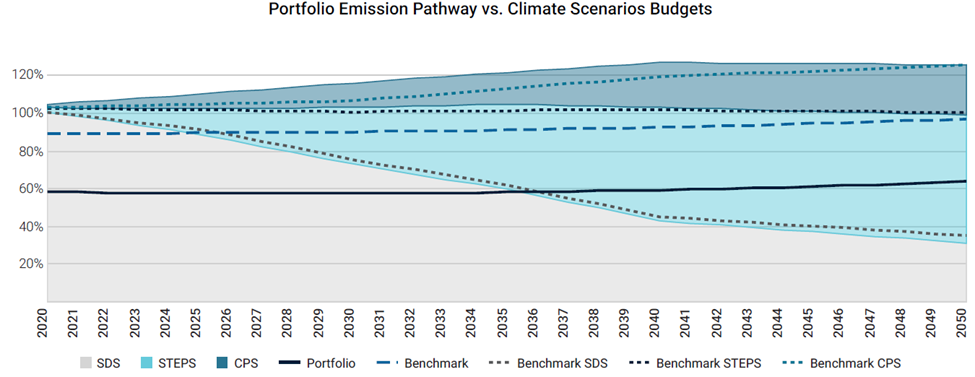
The Portfolio is aligned with a Sustainable Development Scenario (SDS)[4] until 2035 and is associated with a potential temperature increase of 2.1°C by 2050. The analysis shows a better performance than the benchmark which is not aligned with the SDS and exceeds the SDS -budget in 2024.
This is due to an expected increase of carbon emissions in carbon-intense sub-sectors such as Cement Manufacturers, where GHG emissions are expected to exceed emissions budgets after 2030. On the other hand, the positive sector allocation in sectors like Food Retailers & Wholesalers positively impacts the Portfolio’s predictions of staying within its carbon budget. The portfolio shows a high degree of climate targets, including relevant percentage of companies with approved Science-based Targets for emissions reduction.
![carbon footprint vr-3]()
Equity and Corporate Bond Portfolio of the Linea Valori Responsabili
Emission Pathway vs. Climate Scenarios Budgets -
TRANSITIONAL CLIMATE RISK & CARBON RISK RATING
The Portfolio exposure to renewable power generation (53%) is considerably larger than the benchmark (16,05%), and it is already in line with the Sustainable Development Scenario (SDS) compatible energy mix for 2030.
In terms of Carbon Risk Rating – CRR, the weighted average CRR of the Equity and Corporate Bonds Portfolio of the Linea Valori Responsabili is 55, outperforming the benchmark (53). This shows that issuers invested in the Portfolio are better prepared for a transition to a low carbon economy, compared to benchmark constituents.
Sovereign Bonds portfolio of Linea Valori Responsabili
Carbon footprint analysis – Sovereign Bonds portfolio of Linea Valori Responsabili.
1. Relative Carbon Footprint
A total carbon footprint of 63,080 tCO₂e is attributed to the Sovereign Portfolio, that corresponds to a relative footprint of 29.4 tCO₂e/Mil EUR invested, 8.4% below the benchmark. This ranking is reflected in the Relative Carbon Footprint based on investor’s “ownership” of the underlying countries’ debts.
2. Weighted Average Carbon Intensity – WACI
The WACI metric highlights the Portfolio’s exposure to carbon intensive countries. The WACI of the Portfolio amounts to 34 tCO2e per one EUR millions of GDP, slightly more than the benchmark.
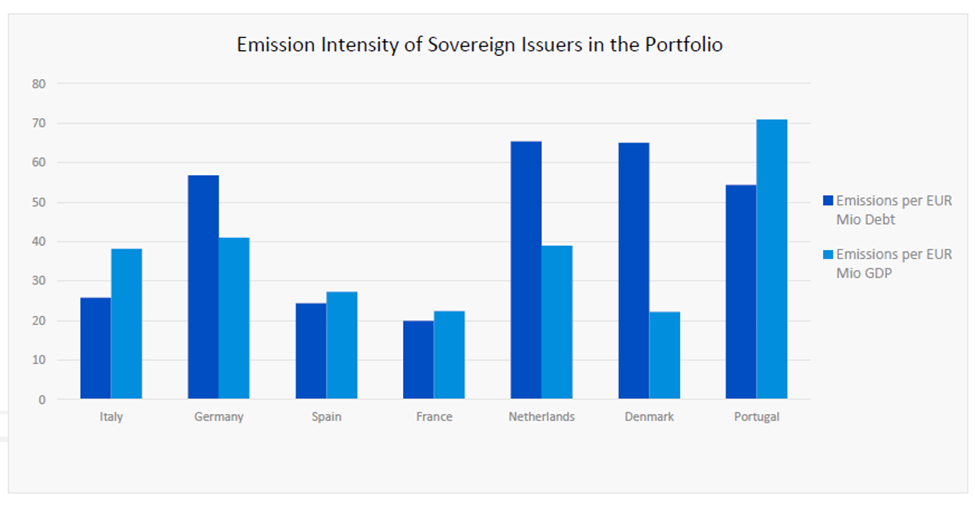
Emission intensity of the main constituents in the Sovereign bonds Portfolio of the Linea Valori Responsabili
[1] Launched after the 2015 Paris Agreement by the Financial Stability Board (FSB), the Task Force on Climate-related Financial Disclosure (TCFD – https://www.fsb-tcfd.org/) considers climate transparency as a crucial factor for the stability of financial markets. The objective of the TCFD is therefore to improve climate transparency in financial markets through recommendations on disclosure. These recommendations provide a “consistent framework that improves the ease of both producing and using climate-related financial disclosures”. The TCFD aims to create a unique standard for both corporate and investment disclosure, understanding that local regulatory frameworks may require different compliance levels.
[2] https://www.issgovernance.com/esg/
[3] The metrics applicable to the Equity and Corporate bonds portfolio are scenario analysis, transitional climate risk & carbon risk rating, and physical risk exposure. For sovereign bonds portfolios, beyond carbon footprint assessment, the risk-related metrics are referring to physical risk exposure of countries.
[4] The ISS ESG scenario analysis combines the three climate scenarios provided by the International Energy Agency (IEA) and the emission reduction methodology according to the Sectoral Decarbonization Approach (SDA)[4] developed by the Science Based Targets initiative (SBTi), which assumes that a company is responsible for its sector emission reduction pathway. The Sustainable Development Scenario -SDS alignment is based on a stricter assessment approach introduced by the IEA, which requires an alignment with a 1.5°C scenario, compared to previous year’s alignment to 2°C scenario
-
Appendix - Methodology
The analysis has been conducted by ISS ESG according to a proprietary methodology.
The document contains just an extract of the whole methodology.
Data
The data analysis is obtained via the ISS ESG ‘Portfolio Climate Impact Report’. Etica Sgr provided holdings for three asset classes (equity, corporate fixed income and sovereign fixed income). Holdings were screened based on ISS ESG’s proprietary platform DataDesk, after a mapping ensured that the company indicators were matched appropriately.
Scope 1 & 2 emissions
The methodology was developed over three years with the Swiss Federal Institute of Technology and includes about 800 sector and sub-sector specific models- allowing ISS ESG’s researchers to calculate the GHG emissions of companies based on those criteria that are most relevant to their line of business.
A summary of the process is provided below:
- Self-reported emissions data is collected from all available sources;
- Self-reported numbers are evaluated for trustworthiness and, where necessary, discarded;
- All companies are classified according to the proprietary ISS ESG CICS (Carbon Industry Classification System) – i.e. companies are classified in light of their carbon-profile, allowing ISS ESG to benchmark non-reporting companies against their reporting peers;
- ISS ESG applies its 800 sub-sector specific models to estimate the emissions of non-reporting companies according to sector-relevant financial or operational metrics.
Scope 3 emissions
ISS ESG’s methodology conceptually differentiates between two sources of Scope 3 emissions: a.) emissions from a company’s upstream and downstream supply chains and b.) emissions from the “use phase” of a company’s product or service.
- Supply Chain: For supply chain emissions, ISS ESG uses an Economic Input-Output Lifecycle Assessment table that models cash flows between sectors within an economy. The method uses information on industry transactions, such as the purchase of materials, to estimate total emissions throughout the supply chain.
- Product use phase: The “use phase” greenhouse gas emissions of representative products per industry are calculated based on Life Cycle Assessments (LCA) available through the Swiss Centre for Life Cycle Inventories (Ecoinvent) and other databases. ISS ESG uses LCA for representative products of the sectors to estimate, in average, the ratio between Scope 1&2 / Use Phase per activity.
For most sectors, Scope 3 emissions are “sector representative” emissions and should not be used for stock picking. They can, however, be used for quantifying the order of magnitude of a full portfolio assessment. Thus, considering Scope 3 emissions allows investors to focus their efforts on those sectors where Scope 3 data matters most and that might fall under the radar screen when just looking at Scope 1 & 2 emissions.
Carbon Metrics
For all equity calculations below, market capitalization represents the value of a company. For fixed income/corporate bonds calculations, instead, market capitalization is replaced with the adjusted enterprise value of a company (AEV)[15]. For sovereign bonds, market capitalization is replaced by the total national debt.
Position Ownership Ratio
Calculated as the aggregated position value / MCap or AEV or national debt.
Disclosure (Number/Weight)
Calculates the % number and % weight of companies that report reliable emissions in the Portfolio and benchmark respectively. Net performance is calculated in percentage points.
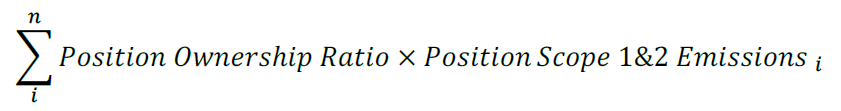
Emission Exposure
Calculated using the following formula for “scope 1&2”. The same approach is used for calculating scope 3 emissions.
![]()
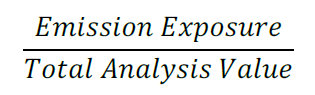
Relative Carbon Footprint
![]()
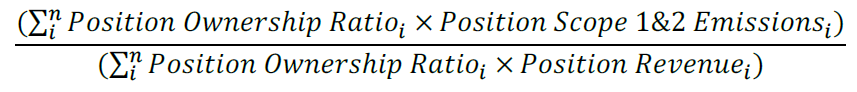
Carbon Intensity
![]()
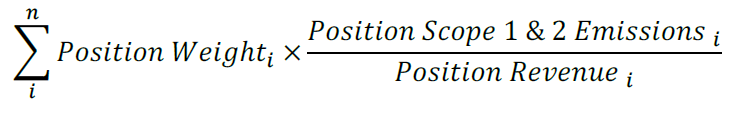
Weighted Average Carbon Intensity[16]
![]()
Climate Performance – Weighted Average
![]()
Attribution Analysis
The attribution analysis compares the Scope 1 & 2 emission exposure between the Portfolio universe and benchmark universe. The analysis separates any greenhouse gas emission out/under- performance between what can be attributed to stock allocation between intensive sectors and what can be attributed to stock selection. A positive number indicates an outperformance, and a negative number an underperformance. Any potential interaction effect is included in the stock selection column.
Scenario Alignment
The purpose of the scenario alignment is to analyze the current and future emission intensity from the direct and indirect emission of a company (Scope 1, 2 & 3) to see which climate scenario it is aligned with until 2050. Each company’s carbon budget is defined based on its market share.
The approach is based on three climate scenarios provided by the International Energy Agency (IEA)
in their report World Energy Outlook 2019[1]. The report presents three scenarios, Sustainable Development Scenario (SDS), Stated Policy Scenario (STEPS) and Current Policy Scenario (CPS). Each
scenario expects a certain level of carbon budget and temperature increase in 2050.
Each scenario is tied to a carbon budget. A carbon budget specifies the amount of fossil carbon that can be combusted worldwide to remain within a certain temperature. The carbon budget changes depending on scenario. For example, to remain within the limits of the SDS, less carbon can be combusted compared to the scenarios that expect a significant temperature increase i.e. the CPS.
- Sustainable Development Scenario (SDS) – The Sustainable Development Scenario pathway is fully aligned with the Paris Agreement by holding the rise in global temperatures to “well below 2°C … and pursuing efforts to limit [it] to 1.5°C”, and meets Sustainable Development Goals (SDGs) objectives related to achieve universal access to energy (SDG 7), to reduce the severe health impacts of air pollution (part of SDG 3) and to tackle climate change (SDG 13).
- Stated Policy Scenario (STEPS) – The Stated Policies Scenario pathway assumes today’s policy intentions and targets and considers only specific policy initiatives that have already been announced.
- Current Policy Scenario (CPS) – The Current Policies Scenario display the current pathway if the world continues without any additional changes in policy.
Temperature estimates on issuer and portfolio level can be used as a compliment to other climate related physical risk and alignment analysis. The temperature score should be used with caution since a single metric cannot explain the full dynamics of an issuer or portfolio contribution to the global temperature increase.
Transition Risk Assessment: Overview table
- % Installed Capacity Green Share – Portfolio weighted % green share of installed capacity, aggregated on Portfolio level. “Green” includes hydro, solar, wind, geothermal, biomass.
- % Installed Capacity Brown Share – Portfolio weighted % brown share of installed capacity, aggregated on Portfolio level. “Brown” includes coal, oil, gas.
- % Investment Exposed to Fossil Fuels – Sum of weights of companies where Carbon Reserves Involvement = “Coal”, “Oil & Gas” of “Coal, Oil and Gas”.
- Total Potential Future Emissions (GtCO₂) – Proven Oil & Gas and Coal reserves converted into GtCO₂. Emission factors for combustion of such fuels are used to calculate potential future emissions for all companies with reserves. The ownership ratio is applied to show investors share of emissions.
- Weighted Average Carbon Risk Rating – Average of each issuers (Position Weight * Carbon Risk Rating).
[1] https://www.iea.org/reports/world-energy-outlook-2019 (IEA World Energy Outlook 2019 report published 13th November 2019).
Carbon Risk Rating
The Carbon Risk Rating (CRR) is a comprehensive assessment of the carbon-related performance of companies, based on a combination of quantitative indicators (e.g. current intensity and trend of greenhouse gas emissions, carbon impact of the product Portfolio including revenue shares of products or services associated with positive as well as negative climate impact), forward-looking qualitative indicators (e.g. corporate policies, ongoing shift in product and services Portfolio, emission reduction targets and action plans, etc.), and a classification of the company’s absolute climate risk exposure due to its business activities.
The CRR is based on two complementary elements:
- Carbon Performance Score (CPS): a metric for the current carbon-related performance of a company as well as its capabilities to seize climate-related opportunities and manage its industry-specific climate risks in future;
- Carbon Risk Classification (CRC): a classification of a company’s individual exposure to climate change risks based on its specific industry assignment and business activities.
The Carbon Risk Rating is available for the full ISS ESG Rating Universe and assesses on a scale of 0 (very poor performance) to 100 (excellent performance) how a company deals with industry-specific climate risks both in production and in the supply chain. It allows to categorize companies according to their carbon-related performance into four groups: Climate Laggards, Climate Underperformers, Climate Performers, and Climate Leaders.