This content is an extract of the Task Force on Climate-related Financial Disclosures (TCFD[1]) aligned Report released by the company ISS ESG in relation to the positioning of Etica Sgr’s Linea Valori Responsabili Funds.
All asset classes have been analyzed accordingly to the TCFD recommendations, grouped as follows: Equity Portfolio; Corporate Bonds Portfolio and Sovereign Bonds Portfolio.
The data analysis reports climate performance achieved at the year-end 2019.
The related carbon metrics used in the Equity and Corporate Bonds analysis are the following ones (please refer to Appendix for more details):
- Relative Carbon Footprint: a normalised measure, defined as the total carbon emissions of the Portfolio per million EUR invested. Any reference to relative carbon metrics in the Analysis refers to tCO2e/EUR million Invested;
- The Weighted Average Carbon Intensity (WACI): is the metric explicitly recommended by the TCFD for asset managers. The WACI allocates Scope 1 & 2 GHG emissions based on Portfolio weights and has among its positive aspects the fact that is simple to calculate and easy to communicate to investors and, most notably, it can be applied across asset classes as it does not rely on the ownership approach. Any reference to carbon intensity in the Analysis refers to tCO2e/EUR million Revenue.
The Data Analysis goes beyond the sole carbon footprint assessment by providing various metrics used to assess climate-related risks and opportunities in forward-looking perspectives. Those metrics include[2]: carbon risk rating, scenario analysis, transitional climate risk and physical risk exposure.
- Linea Valori Responsabili Equity portfolio
- Linea Valori Responsabili corporate bonds portfolio
- Linea Valori Responsabili Sovereign Bonds portfolio
Linea Valori Responsabili Equity portfolio
Carbon footprint analysis – Linea Valori Responsabili Equity portfolio[3].
1. Relative Carbon Footprint
The Relative Carbon Footprint is crucial because it is based on the ownership principle, which is the key logic to the GHG protocol: one EUR million invested in the Equity Portfolio of the Linea Valori Responsabili is associated with 287.67 tCO2e and this is based on the investor’s “ownership” of the underlying companies.
The Portfolio Scope 1 & 2 emission exposure and Relative Carbon Footprint (tCO2e / EUR million Invested) are higher than the benchmark because of a greater allocation effect to the Materials sector, in addition the stock picking effect increasing the performance gap to the benchmark. When looking at the Utilities sector, the weight of the Portfolio in this sector is higher compared to the benchmark (5.73% of the Portfolio vs 3.3% of the benchmark), but the overall carbon performance is lower. This is attributable to a positive stock selection effect, which totally offsets the higher capital allocation to the Utilities sector.
2. Weighted Average Carbon Intensity
The Equity Portfolio of the Linea Valori Responsabili’s WACI is 297.56 tCO2e per one EUR million of revenue, higher than the benchmark.
Figure 1 provides more insights into the WACI. First, in terms of sector contribution, the generally carbon-intensive Materials sector is the largest contributor to the Portfolio’s WACI. The contribution of another GHG-intensive sector such as Utilities is much lower than the benchmark. This highlights that the choice of the stocks in the Equity Portfolio of the Linea Valori Responsabili favours lower-carbon intensity Utilities when compared to the benchmark, also from the angle of carbon efficiency in terms of output. Moreover, the fact that the Portfolio has no asset allocation to the Energy sector contributes positively to the WACI versus the benchmark. In addition to this, the difference between the Portfolio weight and the benchmark weight for the Financials sector partially explains why the emissions exposure of the Portfolio are higher. The Financials sector is one of the least emission-intense ones, therefore a portfolio with a reduced presence of issuers in such sector is more likely to have a higher emission exposure to GHG-intensive sectors than a portfolio that has a wider presence of Financials holdings.
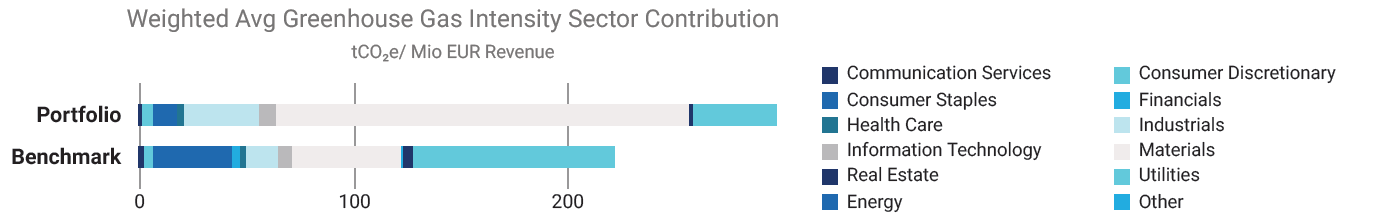
Figure 1: Sectoral Contributors to the WACI of the Equity Portfolio of the Linea Valori Responsabili
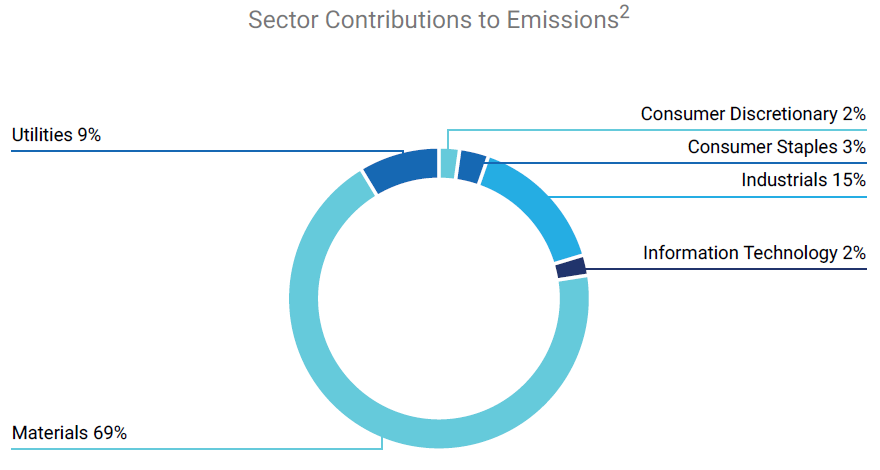
Figure 2: Sectoral Contribution to the Equity Portfolio of the Linea Valori Responsabili’s Scope 1 & 2 Emission Exposure
-
Carbon risk rating
The Carbon Risk Rating (CRR) assesses how an issuer is exposed to climate risks and opportunities, and whether these are managed in a way to seize opportunities, and to avoid or mitigate risks.
The metric of CRR[4] can provide critical insights into how issuers are prepared for a transition to a low carbon economy and is a central instrument for the forward-looking analysis of carbon-related risks at Portfolio and issuer level.
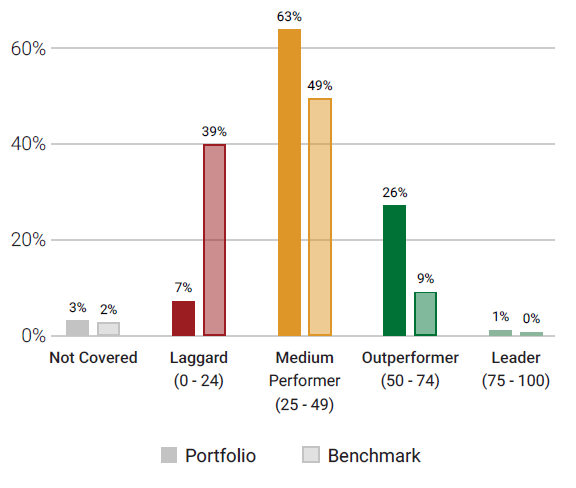
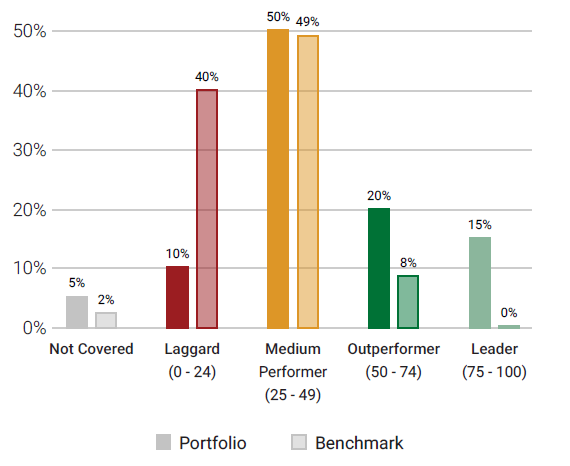
The weighted average CRR of the Equity Portfolio of the Linea Valori Responsabili is 43, outperforming the benchmark (36).
Figure 3 (below) displays the CRR distribution of the Equity Portfolio of Linea Valori Responsabili versus the benchmark.
![]()
Figure 3: CRR Distribution of the Equity Portfolio of the Linea Valori Responsabili vs Benchmark
-
Scenario analysis
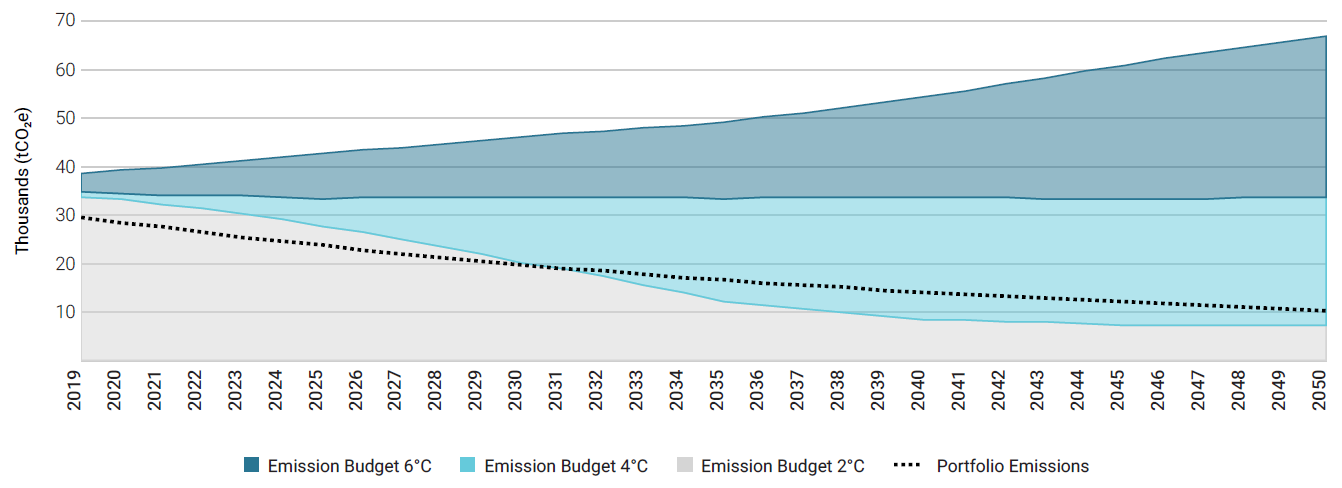
The quantitative analysis aims to analyse the emission intensity from the direct emission of an asset to assess with which climate scenario it is aligned, based on its market share and carbon budget, and aggregate the results for the Portfolio holdings at the Portfolio level. The ISS ESG scenario analysis combines the three climate scenarios provided by the International Energy Agency (IEA) and the emission reduction methodology according to the Sectoral Decarbonization Approach (SDA) developed by the Science Based Targets initiative (SBTi), which assumes that a company is responsible for its sector emission reduction pathway.
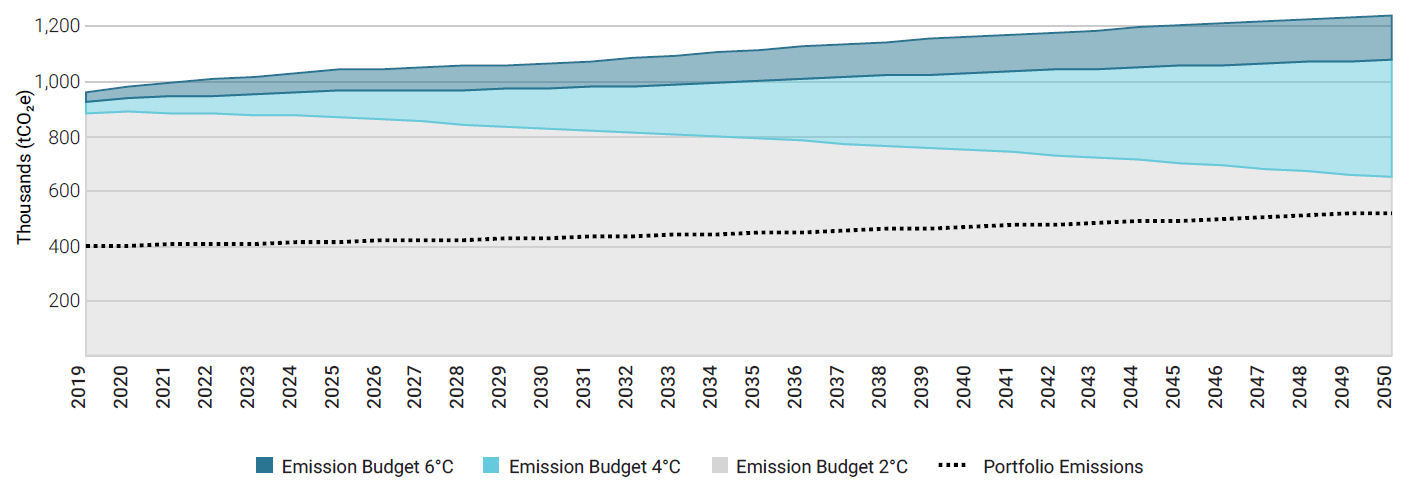
The Equity Portfolio of the Linea Valori Responsabili in its current status is aligned with a 2 degrees scenario for the full period analysed. The dotted line represents the projected Portfolio GHG emission pathway[5].
In a 2 degrees scenario, the GHG emission levels are expected to decrease substantially starting post 2025. As opposed to the Portfolio alignment with a 2 degrees scenario for the full period analysed, the benchmark is not aligned with a 2 degrees scenario and it exceeds its budget in 2028.
![]()
Figure 4: Linea Valori Responsabili, Equity Portfolio GHG Emission Pathway vs Climate Scenarios
-
Transitional climate risk
For a decarbonized future economy, it is key to transition the energy generation mix from fossil to renewable sources. Utilities relying on fossil power production without a substitute plan might run a higher risk of getting hit by climate change regulatory measures as well as reputational damages.
With regard to transitional climate risks[6], the Equity Portfolio of the Linea Valori Responsabili shows a stronger performance than the benchmark. The Portfolio exposure to green power generation (55.5%) is much larger than the benchmark, and it is already in line with the 2 degrees scenario compatible energy mix for 2030.
-
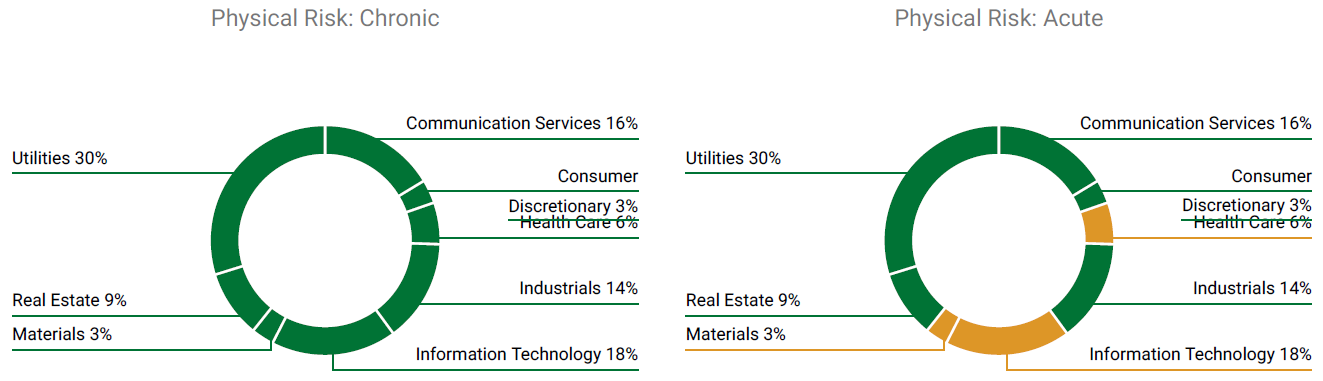
Physical Climate Risk Exposure
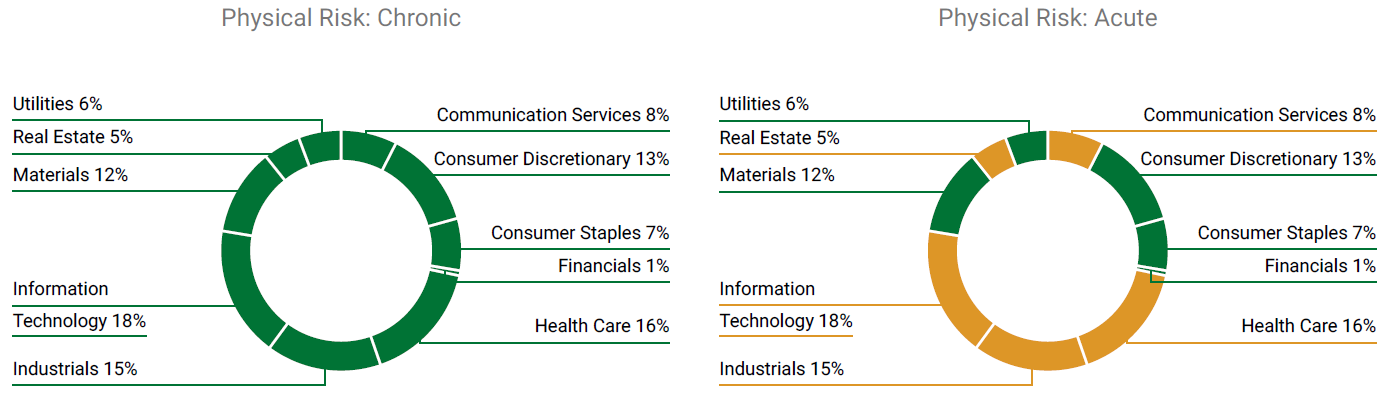
Rising temperature levels, even if limited to 2° Celsius, will result in changes of the climate system resulting in physical risks. Physical risks arising from climate change can be classified into chronic risks such as droughts, heat stress and sea level rise, and acute risks such as extreme weather events and flooding. Companies’ exposure to these two types of physical risk depends on two main factors: their sector as well as the geographical region they are active in[7].
![]()
Figure 5: Exposure to Physical Climate Risks of the Equity Portfolio of the Linea Valori Responsabili (Green: Low Risk; Orange: Medium Risk; Red: High Risk).
Linea Valori Responsabili corporate bonds portfolio
Carbon footprint analysis – Linea Valori Responsabili corporate bonds portfolio[8].
1. Relative Carbon Footprint
The Relative Carbon Footprint is crucial because it is based on the ownership principle, which is the key logic to the GHG protocol: one EUR million invested in the Corporate Bonds Portfolio of the Linea Valori Responsabili is associated with 129.79 tCO2e and this is based on the investor’s “ownership” of the underlying companies.
The Portfolio Scope 1 & 2 emission exposure and Relative Carbon Footprint (tCO2e / EUR million Invested) are higher than the benchmark because of a greater allocation effect to the Utilities sector. The stock picking effect partially compensates the gap of performance compared to the benchmark, which is also compensated by lower allocation to the Energy and the Materials sectors (0% and 3.18% for the Portfolio and 5.17% and 4.59% for the benchmark).
2. Weighted Average Carbon Intensity
The Corporate Bonds Portfolio of the Linea Valori Responsabili’s WACI is 338.3 tCO2e per one EUR million of revenue, higher than the benchmark
Figure 6 (below) provides more insights into the WACI. First, in terms of sector contribution, the generally carbon-intensive Utilities sector is the largest contributor to the Portfolio’s WACI. The second largest contributor is the Real Estate Sector. On the other hand, the WACI in another GHG-intensive sector such as Materials is much lower than the benchmark. Moreover, the fact that the portfolio has no asset allocation to the Energy sector contributes positively to the WACI versus the benchmark.
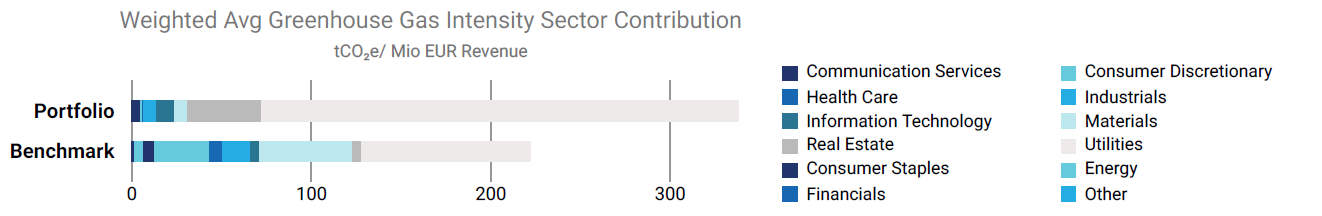
Figure 6: Sectoral Contributors to the WACI of the Corporate Bonds Portfolio of the Linea Valori Responsabili
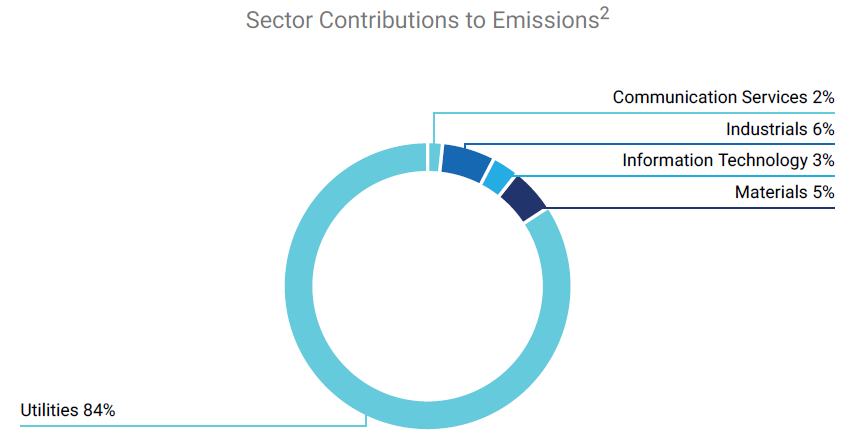
Figure 7: Sectoral Contribution to the Corporate Bonds Portfolio of the Linea Valori Responsabili’s Scope 1 & 2 Emission Exposure
-
Carbon Risk rating
The Carbon Risk Rating (CRR) assesses how an issuer is exposed to climate risks and opportunities, and whether these are managed in a way to seize opportunities, and to avoid or mitigate risks.
The metric of CRR[9] can provide critical insights into how issuers are prepared for a transition to a low carbon economy and is a central instrument for the forward-looking analysis of carbon-related risks at Portfolio and issuer level.
The weighted average CRR of the Corporate Bonds Portfolio of the Linea Valori Responsabili is 53, outperforming the benchmark (36).
Figure 8 (below) displays the CRR distribution of the Portfolio versus the benchmark.
![]()
Figure 8: CRR Distribution of the Corporate Bonds Portfolio of the Linea Valori Responsabili vs Benchmark
-
Scenario analysis
The quantitative analysis aims to analyse the emission intensity from the direct emission of an asset to assess with which climate scenario it is aligned, based on its market share and carbon budget, and aggregate the results for the Portfolio holdings at the Portfolio level. The ISS ESG scenario analysis combines the three climate scenarios provided by the International Energy Agency (IEA) and the emission reduction methodology according to the Sectoral Decarbonization Approach (SDA) developed by the Science Based Targets initiative (SBTi), which assumes that a company is responsible for its sector emission reduction pathway.
The Corporate Bonds Portfolio of the Linea Valori Responsabili in its current status is aligned with a 2 degrees scenario until 2031. The dotted line represents the projected Portfolio GHG emission pathway[10]. In a 2 degrees scenario, the GHG emission levels are expected to have a steeper constant decrease until 2035 and then decrease more slowly. The benchmark is not aligned with a 2 degrees scenario and exceeds its budget in 2028.
![]()
Figure 9: Linea Valori Responsabili, Corporate Bonds Portfolio GHG Emission Pathway vs Climate Scenarios
-
Transitional climate risk analysis
For a decarbonized future economy, it is key to transition the energy generation mix from fossil to renewable sources. Utilities relying on fossil power production without a substitute plan might run a higher risk of getting hit by climate change regulatory measures as well as reputational damages.
With regard to transitional climate risks[11], the Corporate Bonds Portfolio of the Linea Valori Responsabili shows a stronger performance than the benchmark. The portfolio exposure to renewable power generation (67%) is much larger than the benchmark, and it is already in line with the 2 degrees scenario compatible energy mix for 2050.
-
Phisycal climate risk analysis
Rising temperature levels, even if limited to 2° Celsius, will result in changes of the climate system resulting in physical risks. Physical risks arising from climate change can be classified into chronic risks such as droughts, heat stress and sea level rise, and acute risks such as extreme weather events and flooding. Companies’ exposure to these two types of physical risk depends on two main factors: their sector as well as the geographical region they are active in[12].
![]()
Figure 10: Exposure to Physical Climate Risks of the Corporate Bonds Portfolio of the Linea Valori Responsabili (Green: Low Risk; Orange: Medium Risk; Red: High Risk)
Linea Valori Responsabili Sovereign Bonds portfolio
The “Carbon Footprint” section compares the GHG emissions and other related carbon metrics for the Sovereign bonds Portfolio of the Linea Valori Responsabili versus the benchmark[13], including absolute and relative values for the Portfolio’s carbon emissions[14].
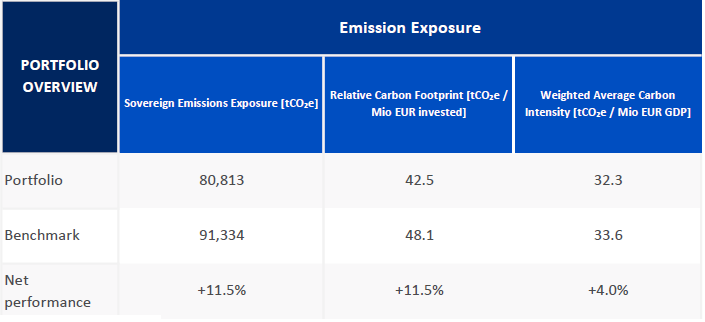
Figure 11: Sovereign bonds Portfolio of the Linea Valori Responsabili – Carbon Footprint Overview
As shown in Figure 11, the overall Portfolio’s Scope 1 & 2 emission exposure is 80,813 tCO2e, which is 11.5% lower than the benchmark. This ranking is reflected in the Relative Carbon Footprint based on investor’s “ownership” of the underlying countries’ debts.
The WACI metric highlights the Portfolio’s exposure to carbon intensive countries. The WACI of the Portfolio amounts to 32.3 tCO2e per one EUR million of GDP. Instead, the benchmark WACI is 33.6 tCO2e per one EUR million of GDP.
As displayed in Figure 12 (below), 38% of the Portfolio’s Scope 1 & 2 emission exposure arises from the German bonds with a 15% investment allocation, whereas the contribution of the Italian bonds is 22%, although the capital allocation is 33%. Other main contributors to the emissions exposure are Spain and France, while the other countries contribute to the remaining 7% of the Portfolio’s emission exposure.
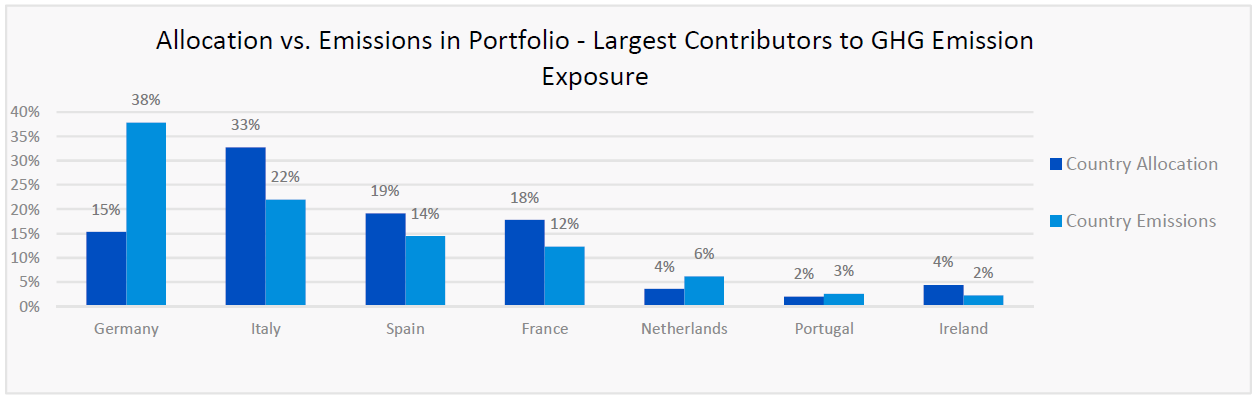
Figure 12: Sovereign bonds Portfolio of the Linea Valori Responsabili – Largest Contributors
The different carbon intensities of the analysed countries are the main factors that explain the results of the carbon footprint analysis. For this reason, the sovereign report presents a dedicated column chart, in Figure 13 below, showing both the emissions per EUR million of debt and the emissions per EUR million of GDP of the main contributors.
For the Sovereign bonds Portfolio of the Linea Valori Responsabili the emission intensity per unit debt of Germany is three times higher than the one for Italy. This explains why Germany is the top contributor in terms of emissions, although it is the fourth in terms of capital allocation.
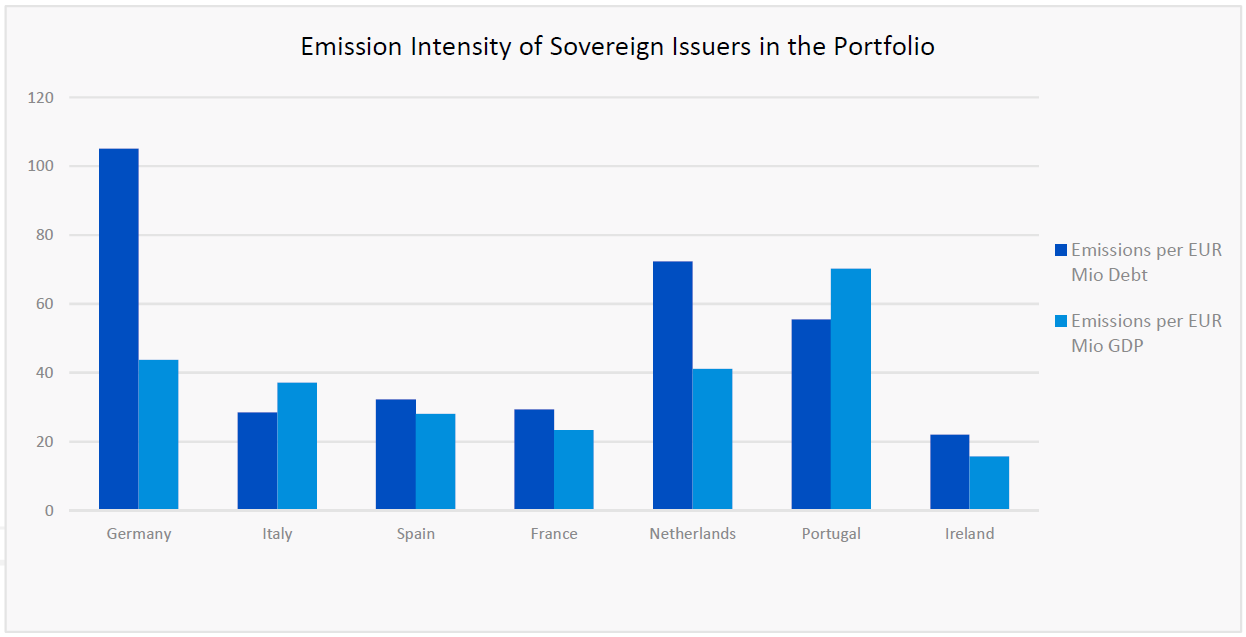
Figure 13: Emission intensity of the main constituents in the Sovereign bonds Portfolio of the Linea Valori Responsabili
[1] Launched after the 2015 Paris Agreement by the Financial Stability Board (FSB), the Task Force on Climate-related Financial Disclosure (TCFD – https://www.fsb-tcfd.org/) considers climate transparency as a crucial factor for the stability of financial markets. The objective of the TCFD is therefore to improve climate transparency in financial markets through recommendations on disclosure. These recommendations provide a “consistent framework that improves the ease of both producing and using climate-related financial disclosures”. The TCFD aims to create a unique standard for both corporate and investment disclosure, understanding that local regulatory frameworks may require different compliance levels.
[2] The metrics mentioned in the list refer to equity and corporate bonds portfolios. For sovereign bonds portfolios the risk-related metrics are limited to physical risk exposure of countries.
[3] The benchmark used in the Data Analysis is ISHARES MSCI ACWI ETF as a proxy of the MSCI World Net Total Return (in Euro).
[4] CRR is based on a scale of 0 (very poor performance) to 100 (excellent performance) and allows to categorise companies according to their carbon-related performance into four groups: Climate Laggards, Climate Underperformers, Climate Performers, and Climate Leaders. For more details, please refer to Appendix.
[5] The GHG emission pathway and carbon budget of the Portfolio are the result of the aggregation of company-level data. The GHG emission trajectories at the company-level include both historical (i) and forward-looking indicators (ii) to project the emission intensity profile of a company from now until year 2050:
- The scenario analysis utilises 5 years of the ISS ESG historical, high-quality emission intensity data to create a trend for each company included in the analysis.
- The historical trend is then combined with forward looking emission reduction commitments and targets to estimate future emissions.
For a specific company to be in line with either the 2°C, 4°C and 6°C climate scenario, the allocated carbon budget per year need to be higher than the estimated direct emissions for the same company. The emissions and carbon budget at the company-level are then aggregated to get a Portfolio 2°C, 4°C and 6°C scenario alignment.
[6] Further details on the methodology are reported in the Appendix.
[7] Further details on the methodology are reported in the Appendix.
[8] The benchmark used in the Data Analysis is ISHARES MSCI ACWI ETF as a proxy of the MSCI World Net Total Return (in Euro).
[9] CRR is based on a scale of 0 (very poor performance) to 100 (excellent performance) and allows to categorise companies according to their carbon-related performance into four groups: Climate Laggards, Climate Underperformers, Climate Performers, and Climate Leaders. For more details, please refer to Appendix.
[10] The GHG emission pathway and carbon budget of the Portfolio are the result of the aggregation of company-level data. The GHG emission trajectories at the company-level include both historical (i) and forward-looking indicators (ii) to project the emission intensity profile of a company from now until year 2050 :
- The scenario analysis utilises 5 years of the ISS ESG historical, high-quality emission intensity data to create a trend for each company included in the analysis.The historical trend is then combined with forward looking emission reduction commitments and targets to estimate future emissions.
- For a specific company to be in line with either the 2°C, 4°C and 6°C climate scenario, the allocated carbon budget per year need to be higher than the estimated direct emissions for the same company. The emissions and carbon budget at the company-level are then aggregated to get a Portfolio 2°C, 4°C and 6°C scenario alignment.
[11] Further details on the methodology are reported in the Appendix.
[12] Further details on the methodology are reported in the Appendix.
[13] For the Sovereign bonds portfolios two benchmarks are used: AMUNDI INDEX JPM EMU GOVIES ETF as a proxy of the benchmark JP Morgan EMU and the index Invesco Euro Government Bonds 1 – 3 Year UCITS ETF EUR Inav as a proxy of the benchmark ICE BofAML Euro Treasury Bill Index.
[14] In the Sovereign Bonds section of this report, Figure 11 displays the “Sovereign Emissions Exposure” of the Portfolio taking Scope 1 & 2 emissions into account. The “Relative Carbon Footprint” is a normalised measure, defined as the total carbon emissions of the Portfolio per million EUR invested. “The Weighted Average Carbon Intensity” differs from the one calculated for non-sovereign portfolios because the GDP of the country is used instead of the revenue of the company.
[15] Adjusted Enterprise Value is calculated as Total Market Cap + Total Debt. For non-listed entities where MCap is not available, total debt only is used.
[16] For sovereign bonds the revenue is replaced by the GDP of the country.
[17] The PCAF is a coalition of twelve Dutch financial institutions launched via the Dutch Carbon Pledge at the COP-21 Summit in Paris and is led by ASN Bank. The objective of this coalition is to develop a standard that enables financial institutions to set targets for carbon emissions and measure the extent to which these targets are achieved, which was presented in a December 2017 report (http://carbonaccountingfinancials.com/).
[18] Data availability limits the implementation of the exact methodology in practice. Data scarcity consists of (i) lack of data based on the same sector classifications for emissions and for expenditure, resulting in inaccuracies when matching the two data sets; and (ii) lack of sector-based expenditure data for many countries, particularly developing countries.


 VALORI RESPONSABILI 2024")