
This document is a commented summary of the Climate Impact Report released by the company ISS ESG[1] based on its proprietary methodology, concerning the holdings of Etica Sgr’s Fund Etica Impatto Clima (also referred to as “the portfolio”). The report includes metrics aligned with the guidelines of the Task Force on Climate-related Financial Disclosures (TCFD[2]).
All asset classes have been analysed according to the TCFD recommendations, grouped as follows: Equity Portfolio and Corporate Bonds Portfolio together and, Sovereign Bonds Portfolio.
The analysis outlines the climate performance calculated on the portfolio at the year-end of 2021 and compares it with the index MSCI World Net Total Return as a market benchmark (also referred to as “the benchmark”) on the same date. It is divided into the following sections: carbon metrics, scenario analysis, transitional climate risks analysis, physical risks, additional insights, and conclusions.
- Carbon metrics
- Scenario Analysis
- Transitional climate risks analysis
- Physical risks
- Conclusions
- Sovereign bonds
Carbon metrics
The carbon metrics recommended by the TCFD used in the Equity and Corporate Bonds analysis are the following ones:
- Relative Carbon Footprint: defined as the total scope 1 and scope 2 GHG emissions of the portfolio, directly attributable to the investor through its ownership share in companies’ total market value (also defined as “Emissions Exposure”), per million EUR invested. It is measured in tCO2e/EUR million invested.
- Carbon intensity: defined as the total scope 1 and 2 GHG emission intensity of the portfolio (based on issuers’ revenues), directly attributable to the investor through its ownership share in the companies’ total market value. It is measured in tCO2e/EUR million revenue.
- The Weighted Average Carbon Intensity (WACI):expresses scope 1 and 2 GHG emission intensity (based on issuers’ revenues), proportional to the issuers’ weight in the portfolio. Hence, this does not take the ownership share into account. It is measured in tCO2e/EUR million revenue.
Overall, the relative carbon footprint of the portfolio amounts to 70.3 tCO2e/EUR million. The carbon intensity is 175.4 tCO2e/EUR million. The weighted average carbon intensity is 154.5 tCO2e/EUR million.
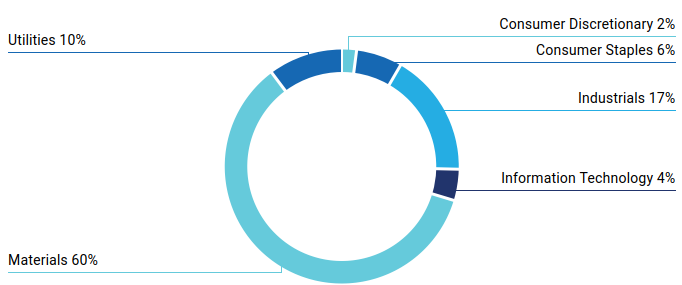
Sector contribution to emissions in Etica Impatto Clima
Comparison with Etica Impatto Clima Responsabili portfolio year-end 2020.
In 2021 the selection methodology has been amended in order to improve the carbon footprint of the funds, by introducing specific criteria to evaluate companies involved in natural gas activities and companies in high carbon-intensity sectors.
The comparison of Etica Impatto Clima on 31.12.2021 with Etica Impatto Clima on 31.12.2020 shows a significant improvement in main carbon metrics. Note that emissions data for fiscal year 2021 refer to 2020, when the global slowdown due to the pandemic may have resulted in a reduction of companies’ emissions. The use of carbon metrics that relate emissions to revenues (Carbon Intensity and WACI) helps circumvent comparability issues arising accordingly.
| Relative Emission Exposure | |||
| Relative Carbon Footprint | Carbon Intensity | WACI | |
| Portfolio 2021 | 70.53 | 178.15 | 154.56 |
| Portfolio 2020 | 97.80 | 182.71 | 170.66 |
| Net Performance | -27.9% | -2.5% | -9.4% |
Scenario Analysis
The purpose of the scenario analysis is to examine the current and future emission intensity from the direct and indirect emissions of a company (GHG scope 1&2) to see which climate scenario it is aligned with, until 2050. Each company’s carbon budget is defined based on its current and estimated future market share.
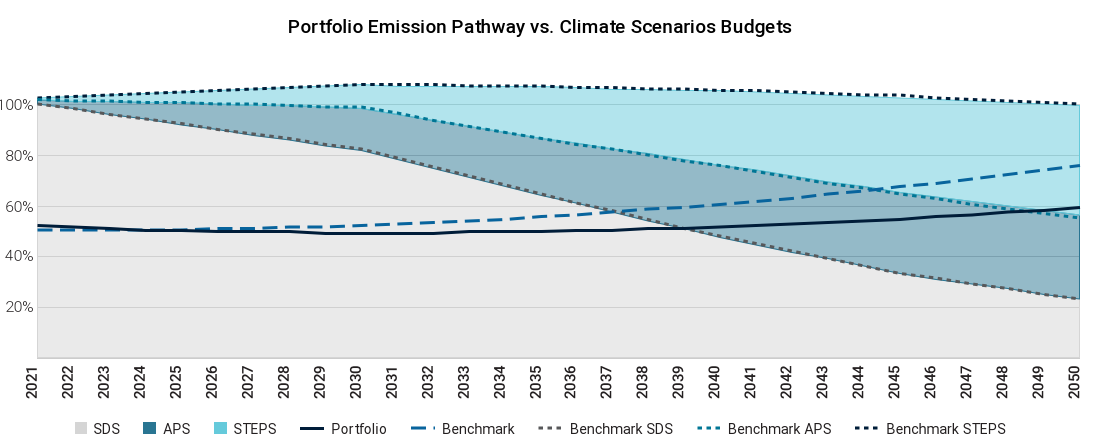
The scenario analysis compares current and future portfolio’s GHG emissions with the carbon budget estimated in different IEA scenarios: Sustainable Development Scenario (SDS), Announced Pledges Scenario (APS) and Stated Policies Scenario (STEPS)[4]. Each scenario is tied to a carbon budget, i.e. a limited amount of fossil carbon that can be combusted worldwide to remain within a certain temperature. The carbon budget changes depending on the scenario, with the Sustainable Development Scenario being the most ambitious one, consistent with a global temperature increase well below 2°C by 2010, compared to pre-industrial levels.
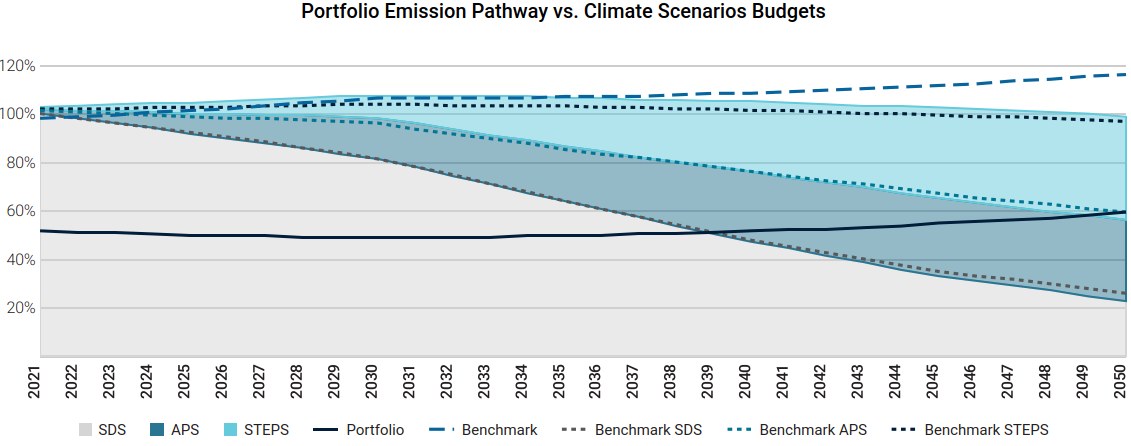
Performance is shown as the percentage of the assigned budget used. The analysis shows that the portfolio remains below the carbon budget associated with the Stated Policies Scenario (STEPS) and, until 2049, it is below the Announced Pledges Scenario (APS).
The portfolio is aligned with the Sustainable Development Scenario until 2039 and is associated with a potential temperature increase of 2.1°C by 2050. This result shows that there is still room to improve the fund’s carbon footprint to align with a below-two-degrees-world. However, the fund outperforms the market, here proxied by the index MSCI World Net Total Return and referred to as “benchmark”, which exceeds the budget of the SDS scenario already in 2022 and is associated with a temperature increase of 2.8°C by 2050.
The better performance of the portfolio compared to the benchmark is explained by two factors, linked to the sectorial allocation and the single stock selection:
- The exclusion of most fossil activities from the portfolio
- A higher number of companies with a commitment to reducing emissions
-
1. The exclusion of most fossil activities from the portfolio
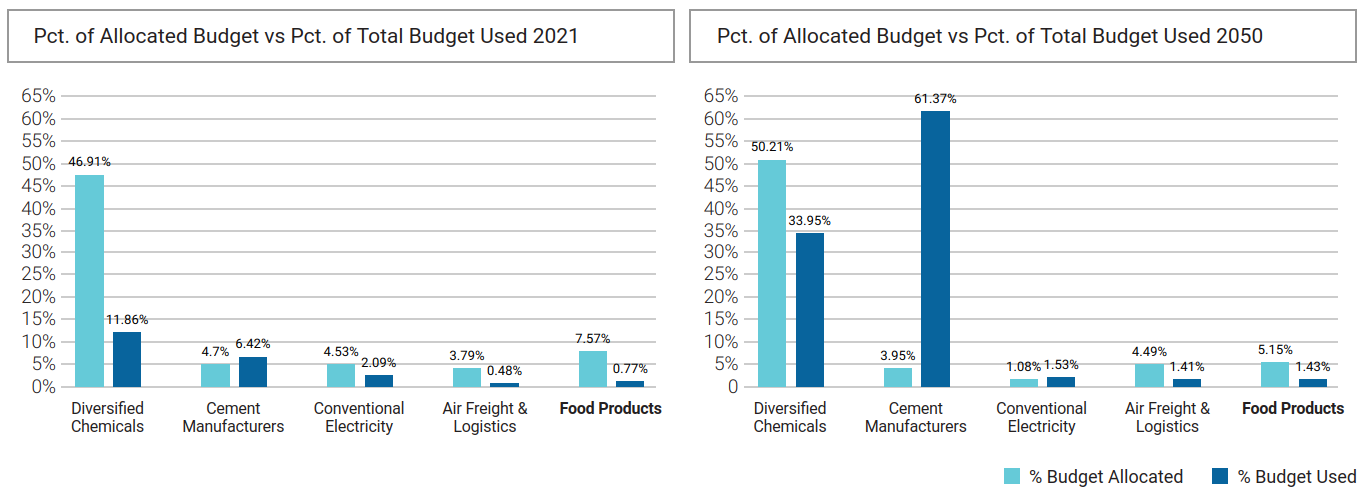
According to Etica’s investment policy, there are no investments in companies operating in the Energy sector[3]. The higher trajectory of the portfolio’s emissions compared to the SDS budget is mainly driven by the Cement Manufacturers sub-sector, which is estimated to overshoot its sectorial budget by over 61% in 2050.
Etica Impatto Clima – comparison between allocated budget and budget used, by sector
![]()
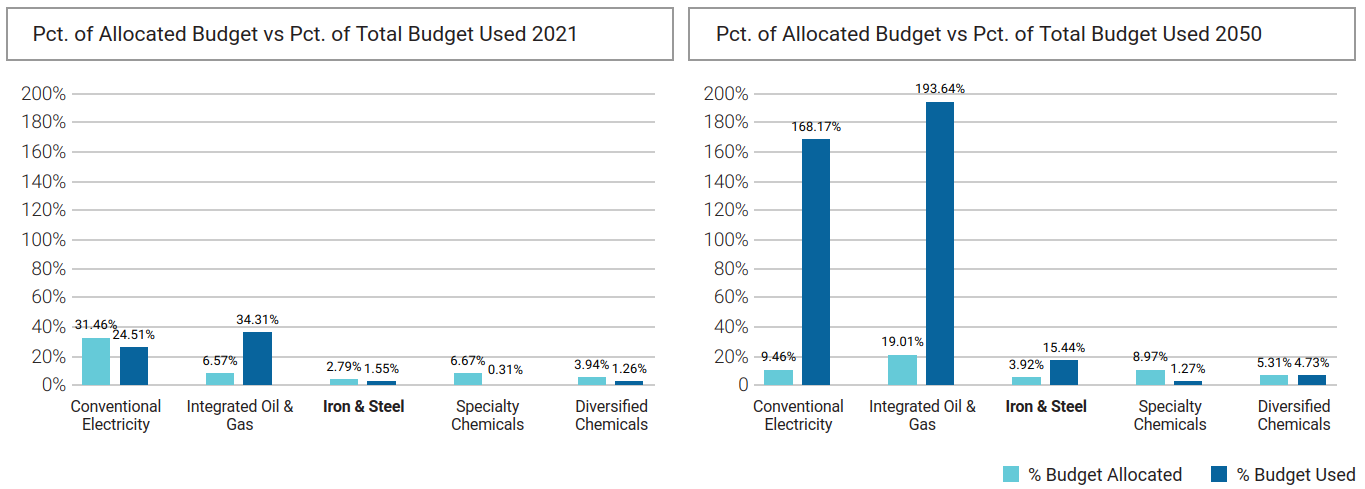
For the benchmark, the overshoot of the budget is mainly driven by the sub-sectors Conventional Electricity, Integrated Oil&Gas, Iron&Steel.
![]()
Note that the budget allocated to the subsectors differs between the portfolio and the benchmark because it depends on each company’s projected market share and on its projected carbon footprint. Therefore, a different sectorial allocation at the portfolio level results in a different allocated carbon budget. Specifically, a higher budget is allowed for sectors that exhibit the highest climate impact.
-
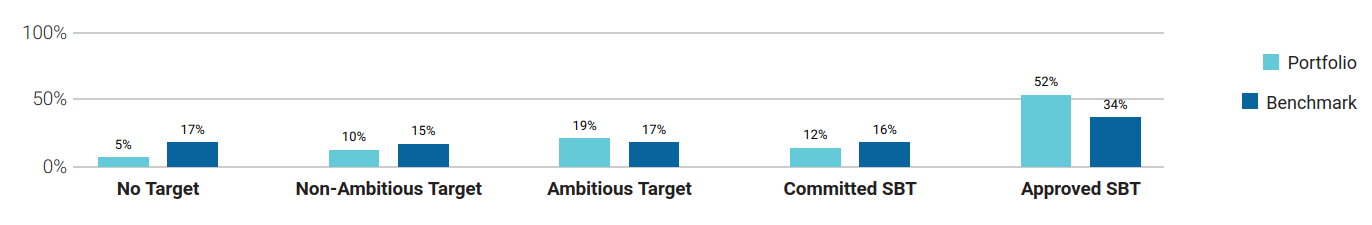
2. A higher number of companies with a commitment to reducing emissions
![]()
As of 31.12.2021, according to ISS, 83% of the portfolio’s value is committed to international climate goals and demonstrates future progress, against 67% of the benchmark. Specifically, 52% of companies in the portfolio set a GHG reduction target approved by the Science-Based Targets initiative (SBTi), against 34% of the benchmark.
Comparison with Etica Impatto Clima portfolio year-end 2020
The scenario analysis improves from 2020 year-end to 2021 year-end as well: in 2021 the portfolio overshoots the SDS carbon budget in 2039 and is associated with a temperature increase of 2.1°C, whereas in 2020 the overshoot is estimated in 2037 and is associated with a temperature increase of 2.3°C.
![]()
Portfolio emission pathway: comparison between 2021-year end and 2020 year end (here referred to as “Benchmark”)
Transitional climate risks analysis
The transitional climate risks analysis dives into the power generation mix of the portfolio.
Of the overall power generation installed capacity by companies in the portfolio, 60% comes from renewables. In the benchmark index, the share of renewable energy capacity is around 20%.
Transitional climate risk analysis on Etica Impatto Clima’s portfolio as of 31.12.2021
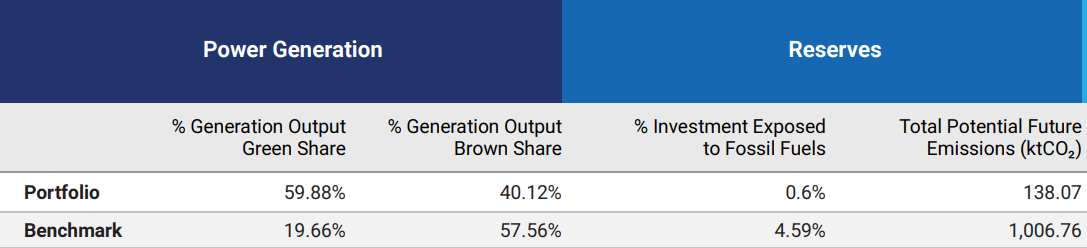
The current energy generation mix of the portfolio exhibits a higher share of renewables than in the Sustainable Development Scenario of the International Energy Agency in 2030, which envisages 84% of renewables in 2050 and 53% in 2030.
Comparison with Etica Impatto Clima portfolio year-end 2020
Transition risks decreased from 2020 to 2021, with the exposure to fossil fuel reserves falling from 0.92% to 0.6%.
Physical risks
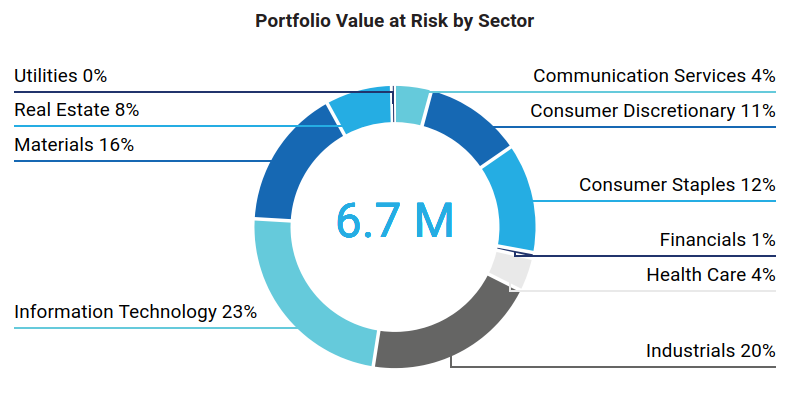
ISS employs a model to estimate the potential value losses, estimated by 2050, arising from the change in share price due to climate physical risks, computing the Value at Risk (VaR) of each issuer. The valuation model considers the following risks: changes in capital value via changes in Property, Plant and Equipment (PP&E), repair costs to damaged assets via investments in Capital Expenditure (CAPEX), increases in production costs via changes in Selling, General and Administrative Expenses, (SG&A) or Cost of Goods Sold (COGS), change in income via sales.
The analysis is based on the most relevant scenarios used as part of the IPCC 5th Assessment Report (AR5). The baseline scenario is built around Representative Concentration Pathway (RCP) 4.5 (1.7-3.2 ℃ temperature rise by 2100). In this scenario, the portfolio value at risk by 2050 is estimated at 6.7 EUR million, with the Information technology and Industrials being the most exposed ones. This represents a 1.1% loss in the overall portfolio value. The value at risk rises to over 10 EUR million if a worst-case scenario is employed, assuming a temperature increase over 3.2°C.
Conclusions
The overall performance of the portfolio concerning all metrics in the analysis appears positive and the scenario analysis is particularly reassuring about the consistency of the fund with a transition pathway in the medium term. This evidence holds notwithstanding there is still room for improvement, especially in the Materials sector.
Methodological changes introduced in 2021 to reduce carbon footprint resulted effective in improving all relevant metrics in the analysis in comparison with 2020, especially those targeting most carbon-intense companies in Materials, Utilities and Industrials sectors. Additional improvements to the selection policy are in progress to further tackle the climate impacts of investments.
Sovereign bonds
This section compares the GHG emissions and other related carbon metrics for the sovereign bonds portfolio of Etica Impatto Clima, including absolute and relative values for the portfolio’s carbon emissions. Emissions are calculated based on the principles proposed by Platform Carbon Accounting Financials (PCAF)[5], allocating emissions to a sovereign bond through a government’s direct operations as well as from government financing in other sectors of society.
Metrics employed:
- Emission Exposure: it measures scope 1 and 2 GHG emissions of a country, weighted by the share of invested value relative to the gross government debt. It is measured in tCO2
- The relative carbon footprint: it is defined as the emission exposure of the portfolio per amount invested. It is measured in tCO2e/EUR million invested
- Weighted Average Carbon intensity: it is expressed as the weighted average scope 1 and 2 GHG emissions per million of GDP as a proxy of the carbon efficiency per unit of output. It is measured in tCO2e/ EUR million GDP.
The portfolio’s emission exposure is 5572 tCO2e.The relative carbon footprint is 20.58 tCO2e/ EUR million invested. The Weighted Average Carbon intensity is 27.43 tCO2e/ EUR million GDP.
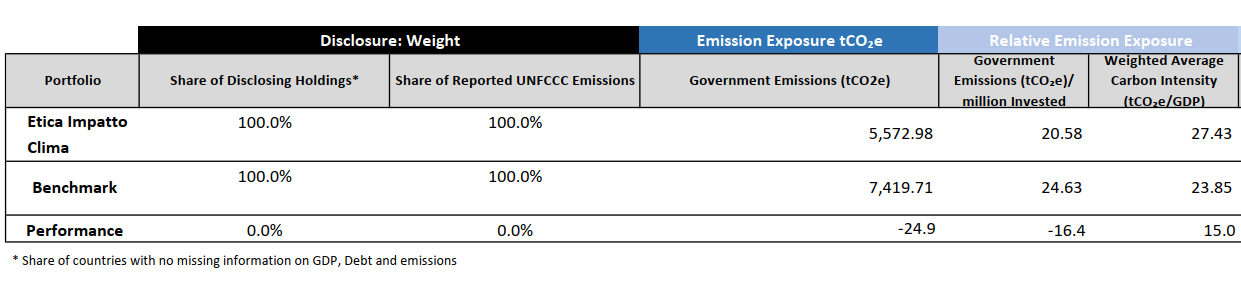
The portfolio is characterised by a significant overexposure to Italian debt, which represents 46.8% of the total amount invested and contributes to around 47.5% of the portfolio’s overall emission exposure.
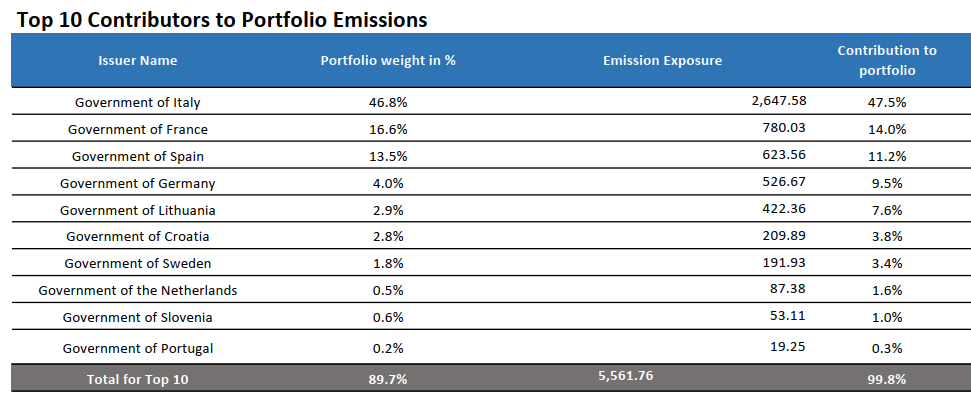
It is worth noting that a significant difference in carbon metrics may appear across countries, depending on whether these consider emissions per unit of debt (i.e. emission exposure and relative carbon footprint) or per unit of GDP.
Italy’s emission intensity per unit of output is around 36% higher than that of France, 38% higher than that of Spain, and 11% lower than Germany’s. However, Italy’s emission intensity per unit of issued debt decreases to around +16% compared to France and +18% against Spain but it is 133% lower than Germany’s. Indeed, Germany’s absolute emissions are almost twice Italy’s, but its ppp-adjusted GDP is also much higher than Italy’s whereas the two countries have a similar amount of absolute debt. Hence, if the emissions gap between Italy and Germany appears to be limited when it’s related to GDP, it emerges clearly when it is related to debt. Note also that Germany’s contribution to the portfolio’s emission exposure is much higher than its weight in the portfolio.
| Country | Government emissions intensity – mio EUR PPP-adjusted GDP | Government emissions intensity – mio EUR Debt |
| Government of France | 17 | 16 |
| Government of Germany | 31 | 44 |
| Government of Ireland | 15 | 21 |
| Government of Italy | 28 | 19 |
| Government of Portugal | 40 | 32 |
| Government of Spain | 17 | 15 |
| Government of Sweden | 14 | 36 |
| Government of the Netherlands | 32 | 55 |
References
[1] https://www.issgovernance.com/esg/
[2] Launched after the 2015 Paris Agreement by the Financial Stability Board (FSB), the Task Force on Climate-related Financial Disclosure (TCFD) considers climate transparency as a crucial factor for the stability of financial markets. The objective of the TCFD is therefore to improve climate transparency in financial markets through recommendations on disclosure. These recommendations provide a “consistent framework that improves the ease of both producing and using climate-related financial disclosures”. The TCFD aims to create a unique standard for both corporate and investment disclosure, understanding that local regulatory frameworks may require different compliance levels.
[3]Specifically, Etica does not invest in companies included in the following sectors (according to BICS classification): Oil Exploration & Production, Integrated Oils, Oil & Gas Services & Equipment, Oil, Gas & Coal, Pipeline, Mining Services, Precious Metal Mining, Coal Operations and Other Mined Minerals.
[4] Details on the scenarios and underlying assumptions are available at World Energy Model – Analysis – IEA
[5] PCAF: Enabling financial institutions to assess greenhouse gas emissions | PCAF (carbonaccountingfinancials.com)

 – Valori Responsabili")
