
This document is a commented summary of the Climate Impact Report released by the company ISS ESG[1] based on its proprietary methodology, concerning the holdings of Etica Sgr’s Fund Etica Transizione Climatica (also referred to as “the portfolio”). The report includes metrics aligned with the guidelines of the Task Force on Climate-related Financial Disclosures (TCFD[2]).
All asset classes have been analysed according to the TCFD recommendations, grouped as follows: Equity Portfolio and Corporate Bonds Portfolio together and, Sovereign Bonds Portfolio.
Updated June 2025
Etica performed a climate analysis on the portfolio as of 30 June 2025, comparing it with the MSCI World Universal Net Total Return (i.e. the benchmark) as of 1 July 2025.
This analysis was conducted to assess the transition effort of this fund more effectively on an ongoing basis. Furthermore, this analysis attempts to implement some of the suggestions that emerged during the analysis of the 2024 portfolio. In particular, Corporate green bonds were excluded from the analysis because they do not contribute to the issuer’s emissions. An appropriate section analyzing green bonds was also added. This analysis also includes the same metrics aligned with the Task Force on Climate-related Financial Disclosures (TCFD) guidelines, as described in the above analysis.
- Carbon Metrics
- Scenario Analysis
- Transitional Analysis
- Green Bonds: use of proceeds analysis
- Physical Risks Analysis Overview
- Sovereign Bond – Green Bond Analysis
- Conclusion
Carbon Metrics
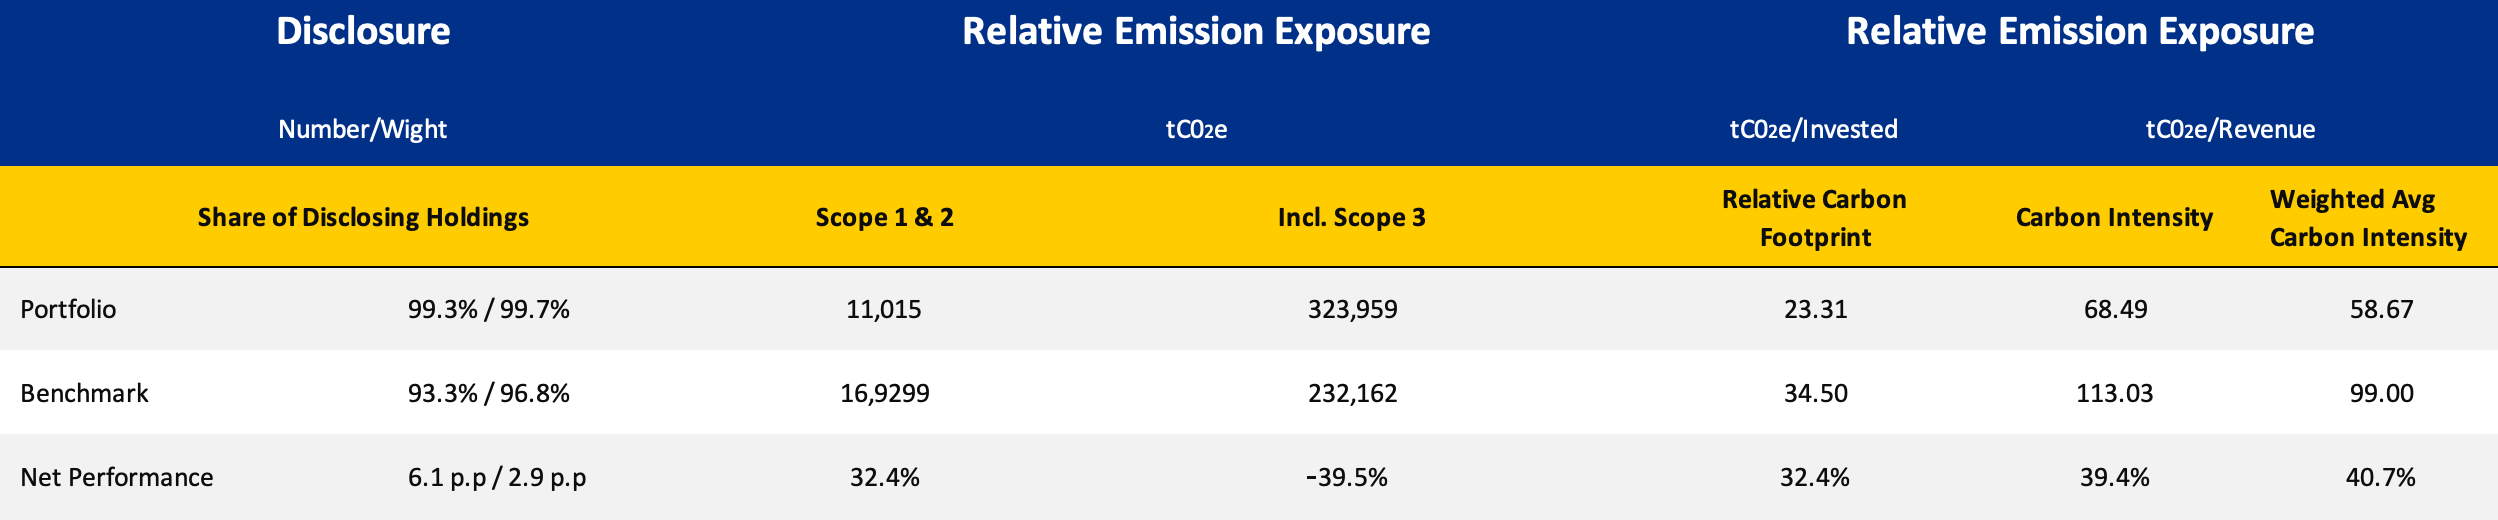
The analysis shows that the portfolio outperformed the benchmark across all carbon metrics.
The analysis shows that the portfolio outperforms the benchmark on all carbon metrics, achieving significantly better results. In fact, the net performance shows that the portfolio has:
- a 32.4% reduction in relative carbon footprint.
- a 39.4% lower carbon intensity.
- a 40.7% less WACI.
Compared to the benchmark.
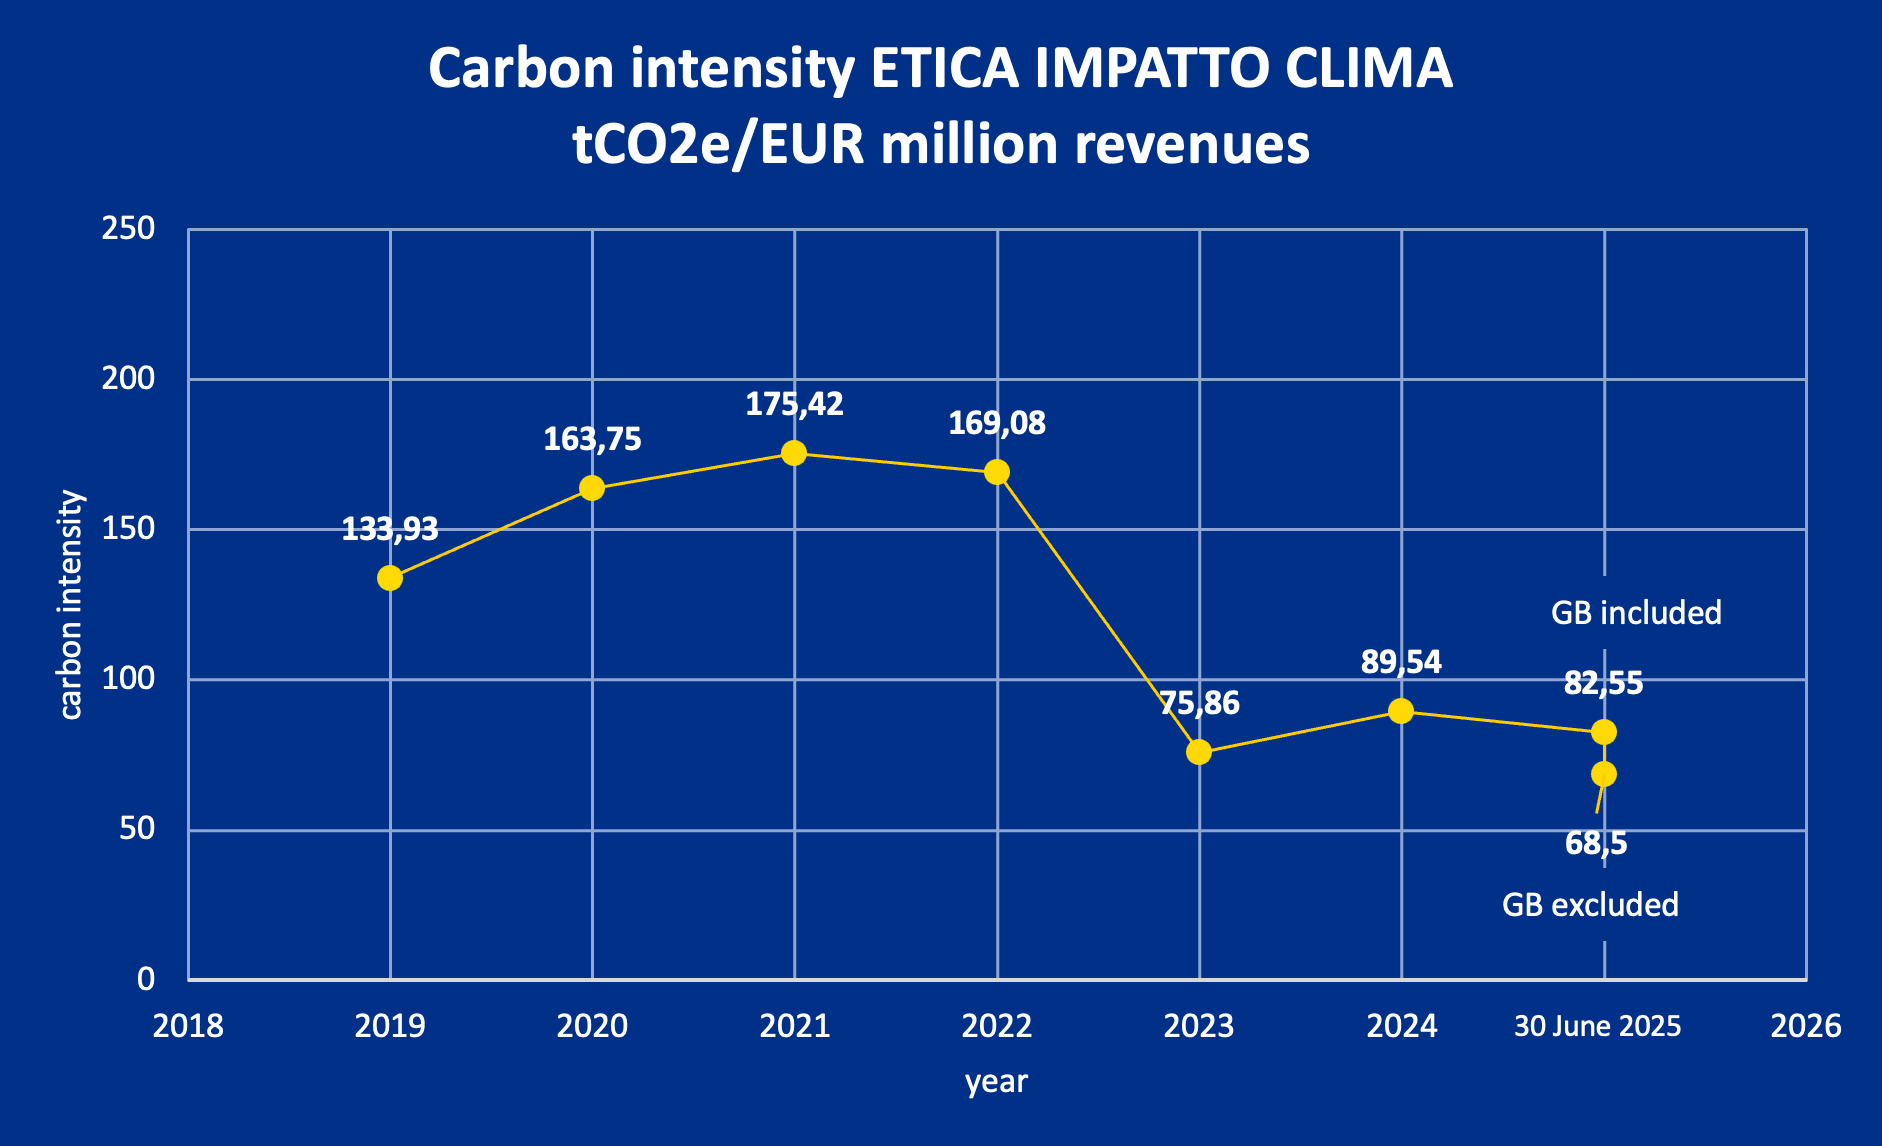
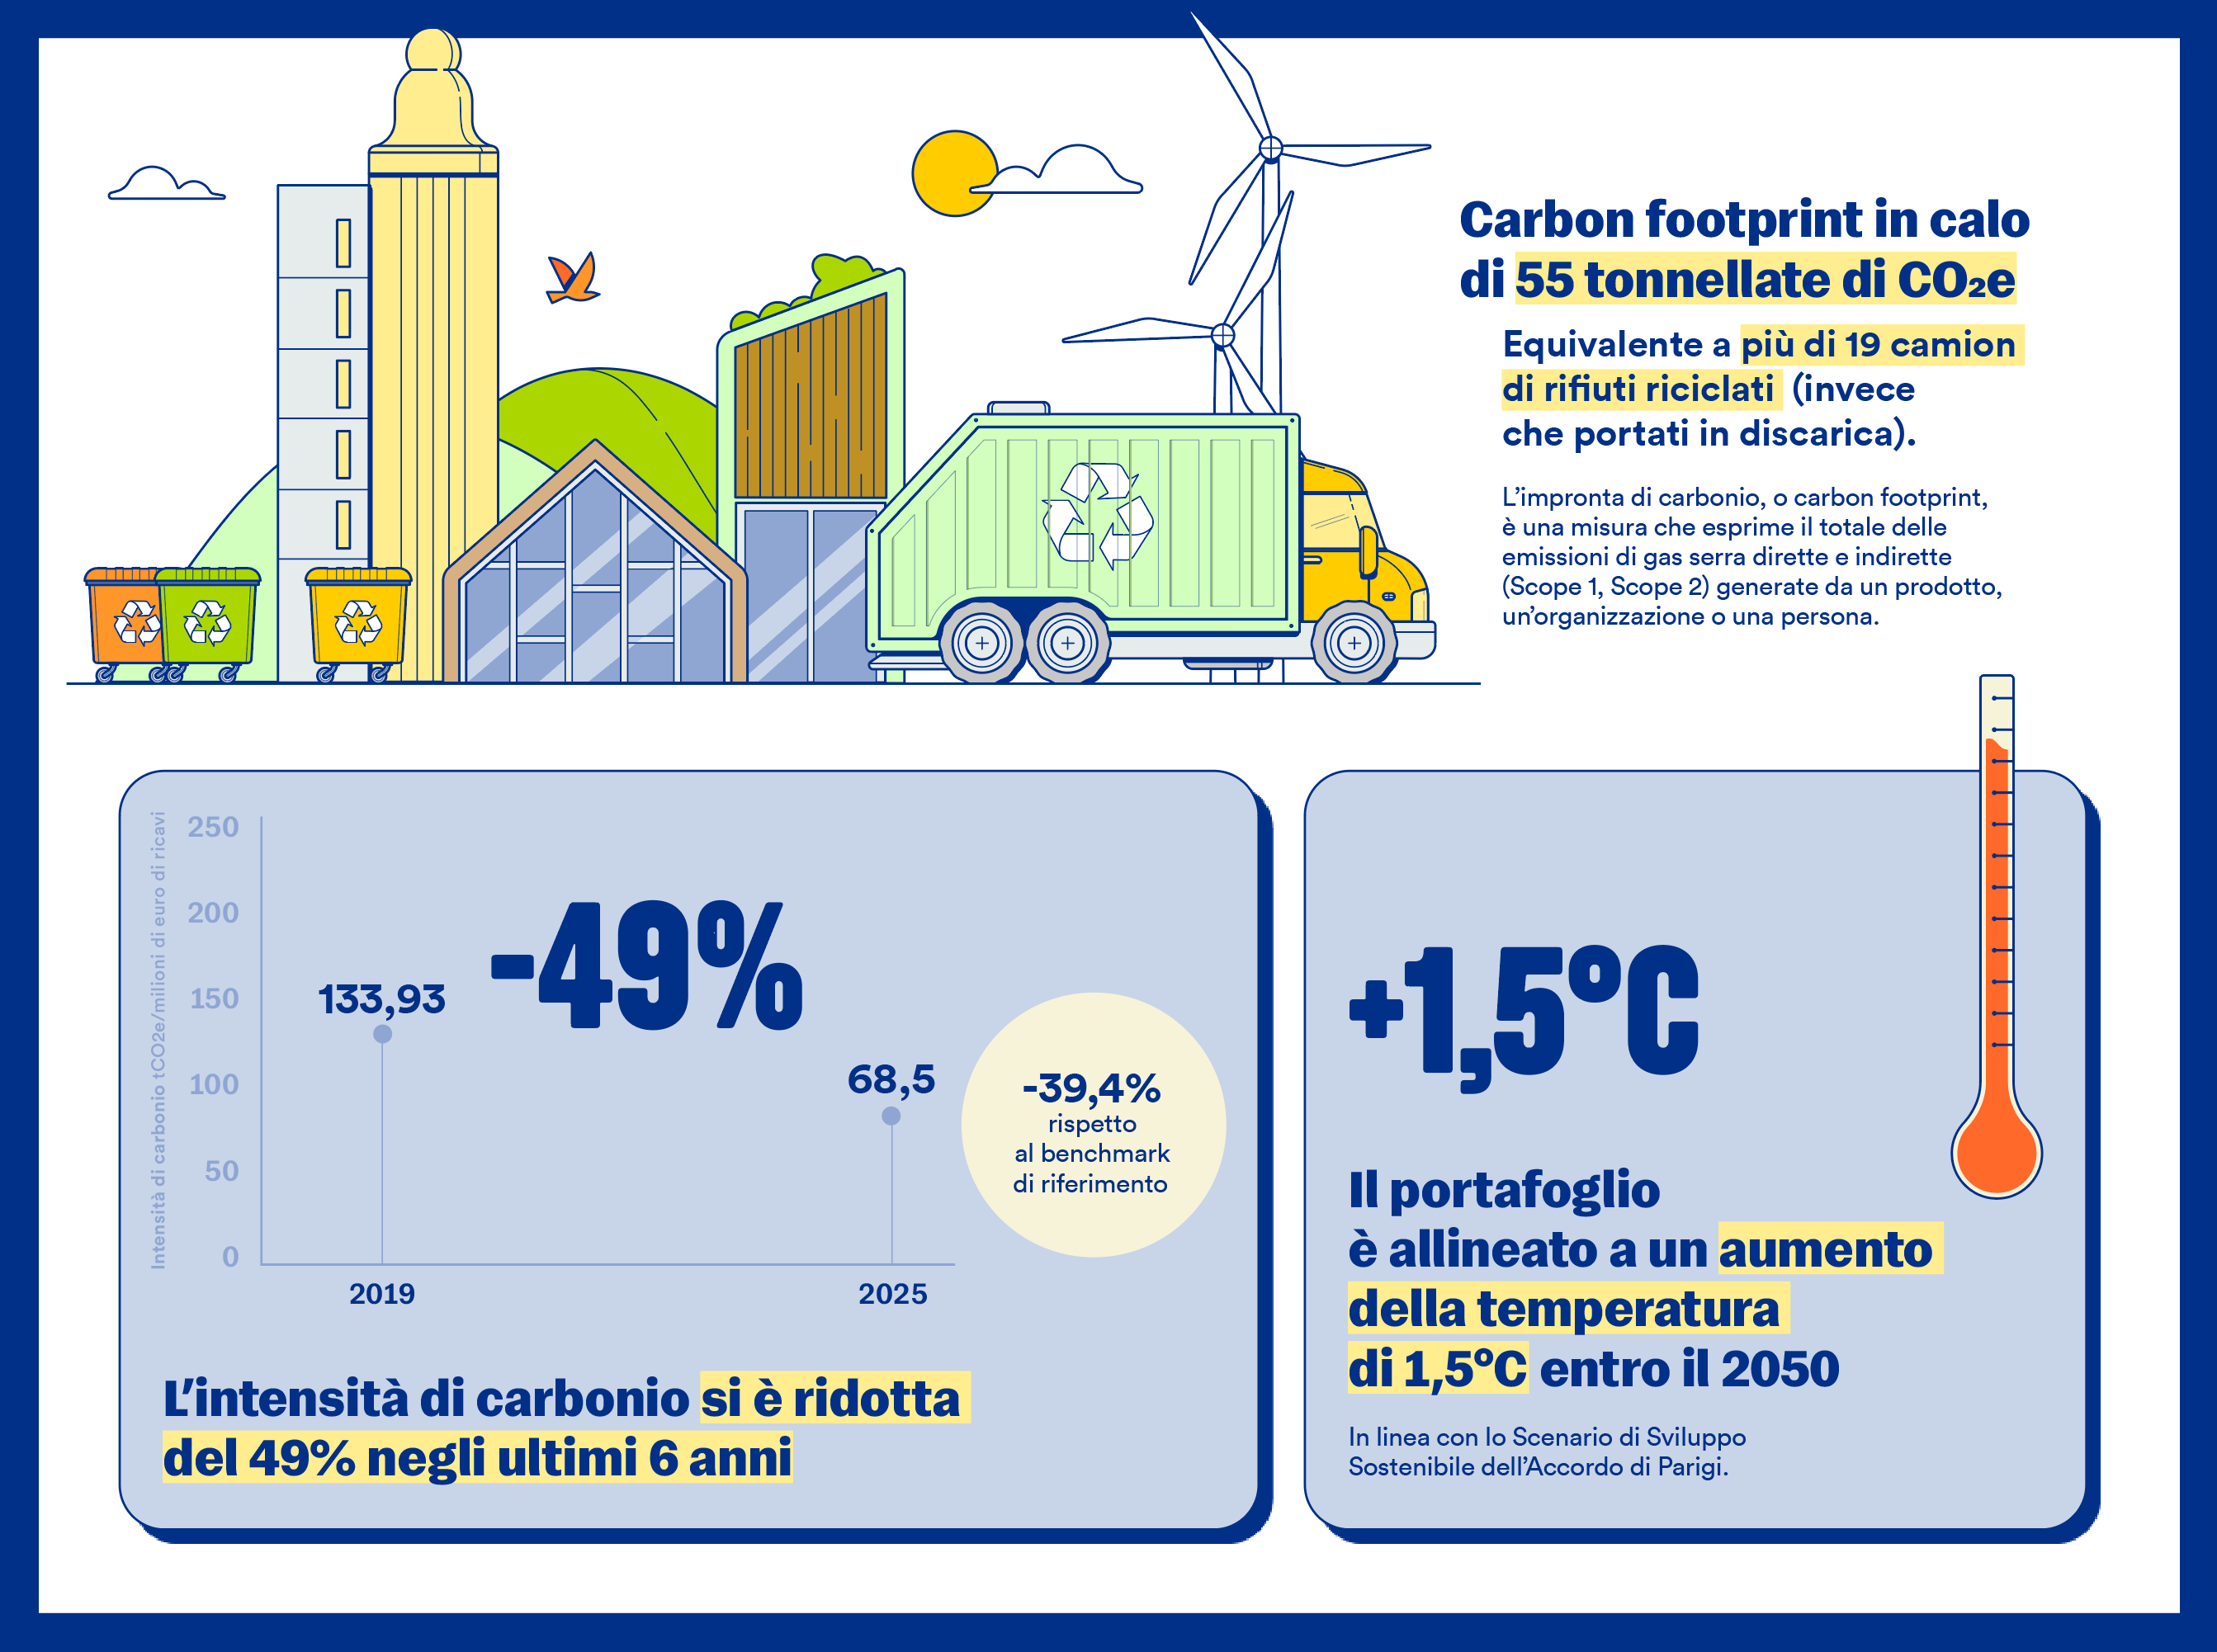
Moreover, compared to 2019, our carbon intensity has decreased by 49% as of 30 June 2025.
Furthermore, both this analysis and previous ones have used a benchmark that only includes equities. It is not possible to recreate a benchmark that reflects the full composition of the portfolio, which includes both equities and corporate bonds. However, it seems reasonable to include non-green bonds in the analysis, given that corporate debt is used to finance activities that generate emissions. Conversely, it is methodologically more consistent to exclude green bonds that finance activities aimed at reducing emissions.
It should be noted that the emissions (Scope 1 and 2) attributable to issuers in the Etica portfolio (including bonds) amounted to 27,317 tCO₂ at the end of 2024, falling to 19,000 tCO₂eq by 30 June 2025. This is due to financial dynamics. However, when green bonds are excluded, this figure falls further to 11,015 tCO₂eq.
The results of the carbon metrics as of June 30, including or excluding green bonds, are shown in the chart below.
Scenario Analysis
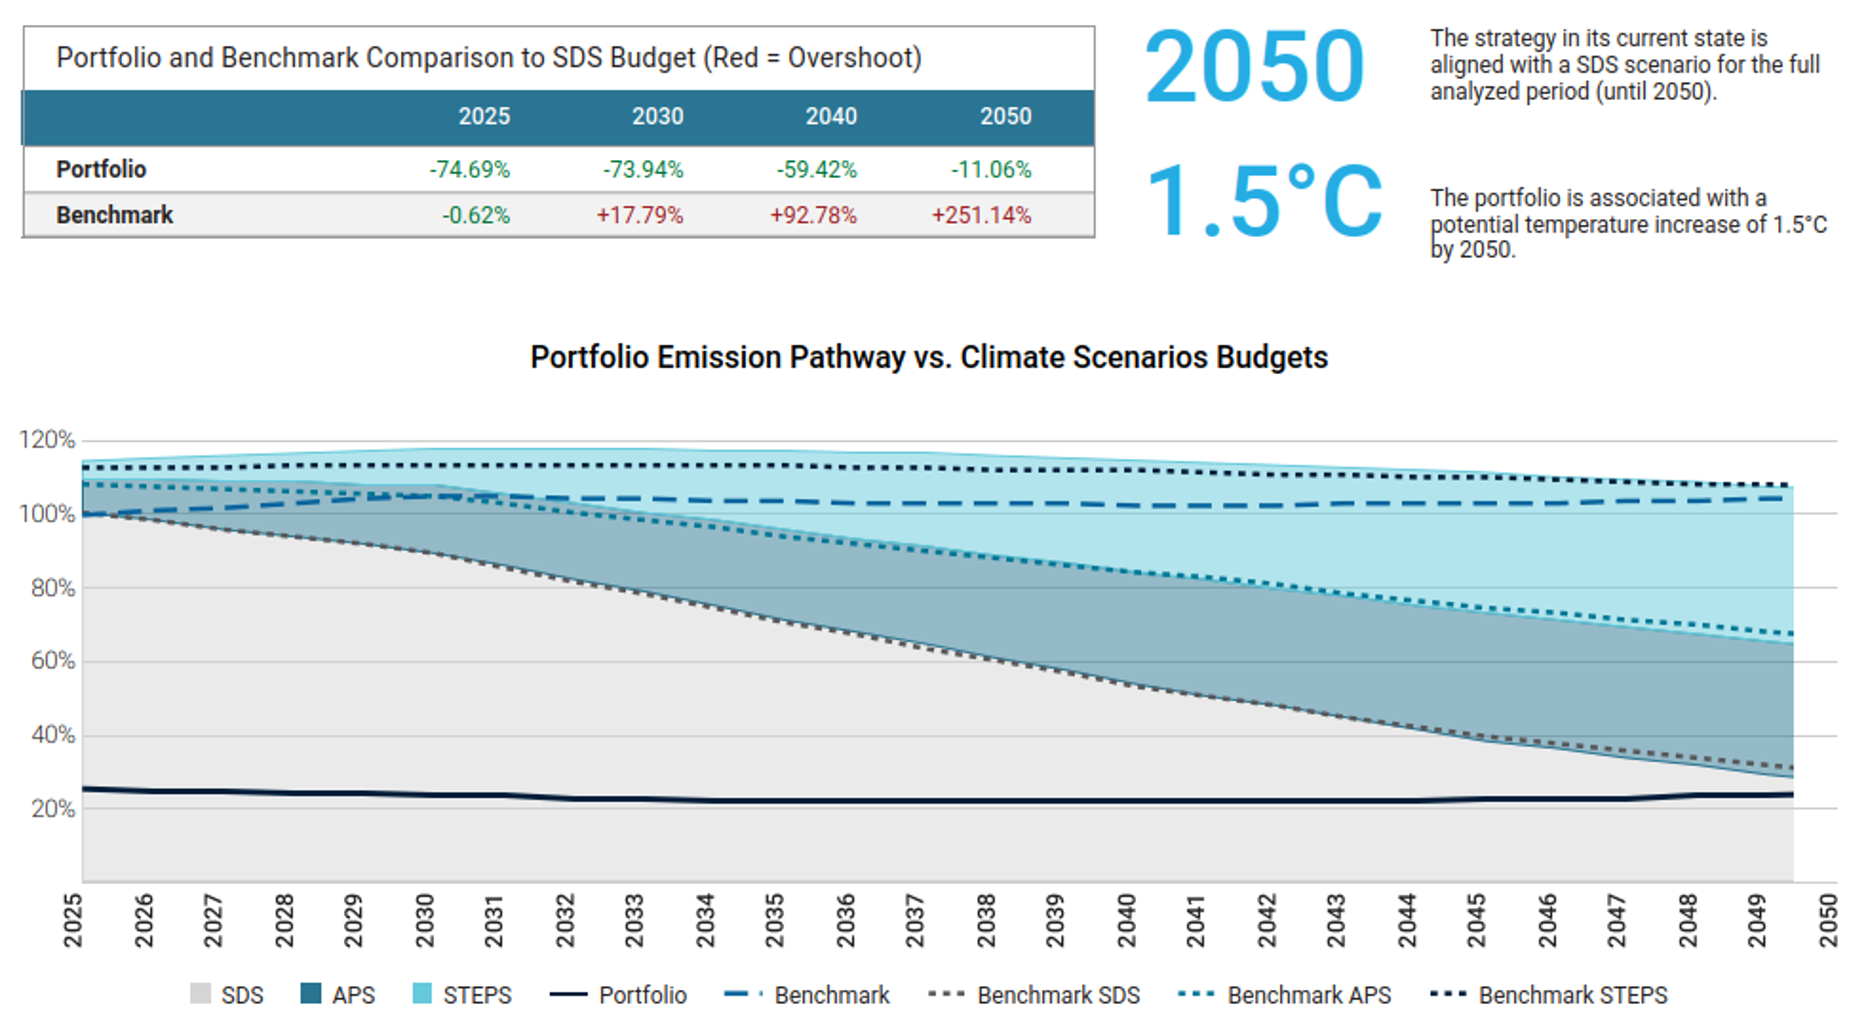
As of June 30, we cannot see changes in the scenario analysis. The fund remains aligned with a 1.5°C scenario and has outperformed the benchmark.
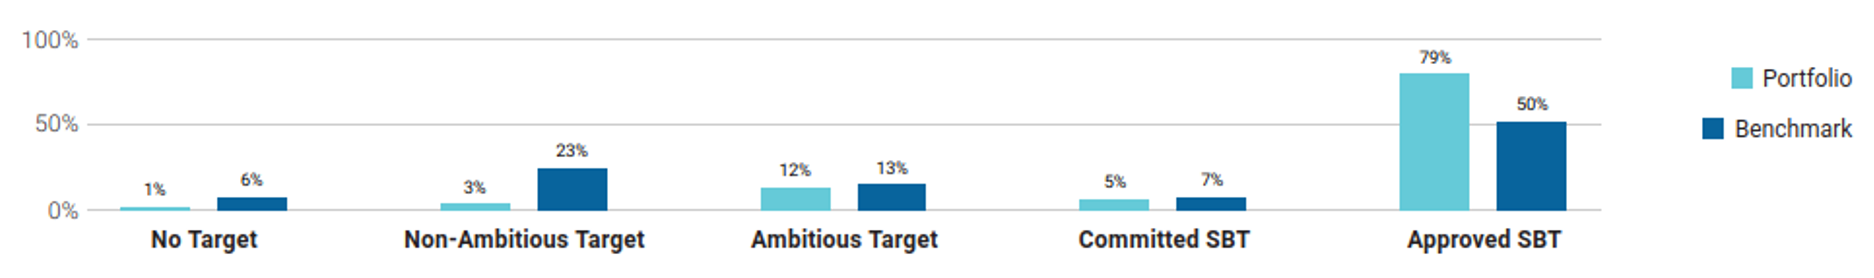
Compared to the previous analysis, the percentage of portfolio value aligned with international climate goals increased to 96%. This result is clearly explained by the exclusion of green bonds. As stated in Green Bond Universe, climate methodology is less stringent because the focus is on project financing. In this universe, there could be issuers that are less virtuous from a climate perspective, but we decided to finance their green projects to help them transition. Excluding them from the analysis logically results in a higher percentage of the portfolio having climate goals. Moreover, only 1% of the portfolio has no target, while 79% have targets approved by the Science Based Target Initiative.
 When we included scope 3 emissions in the scenario analysis, the funds performed better than in 2024.
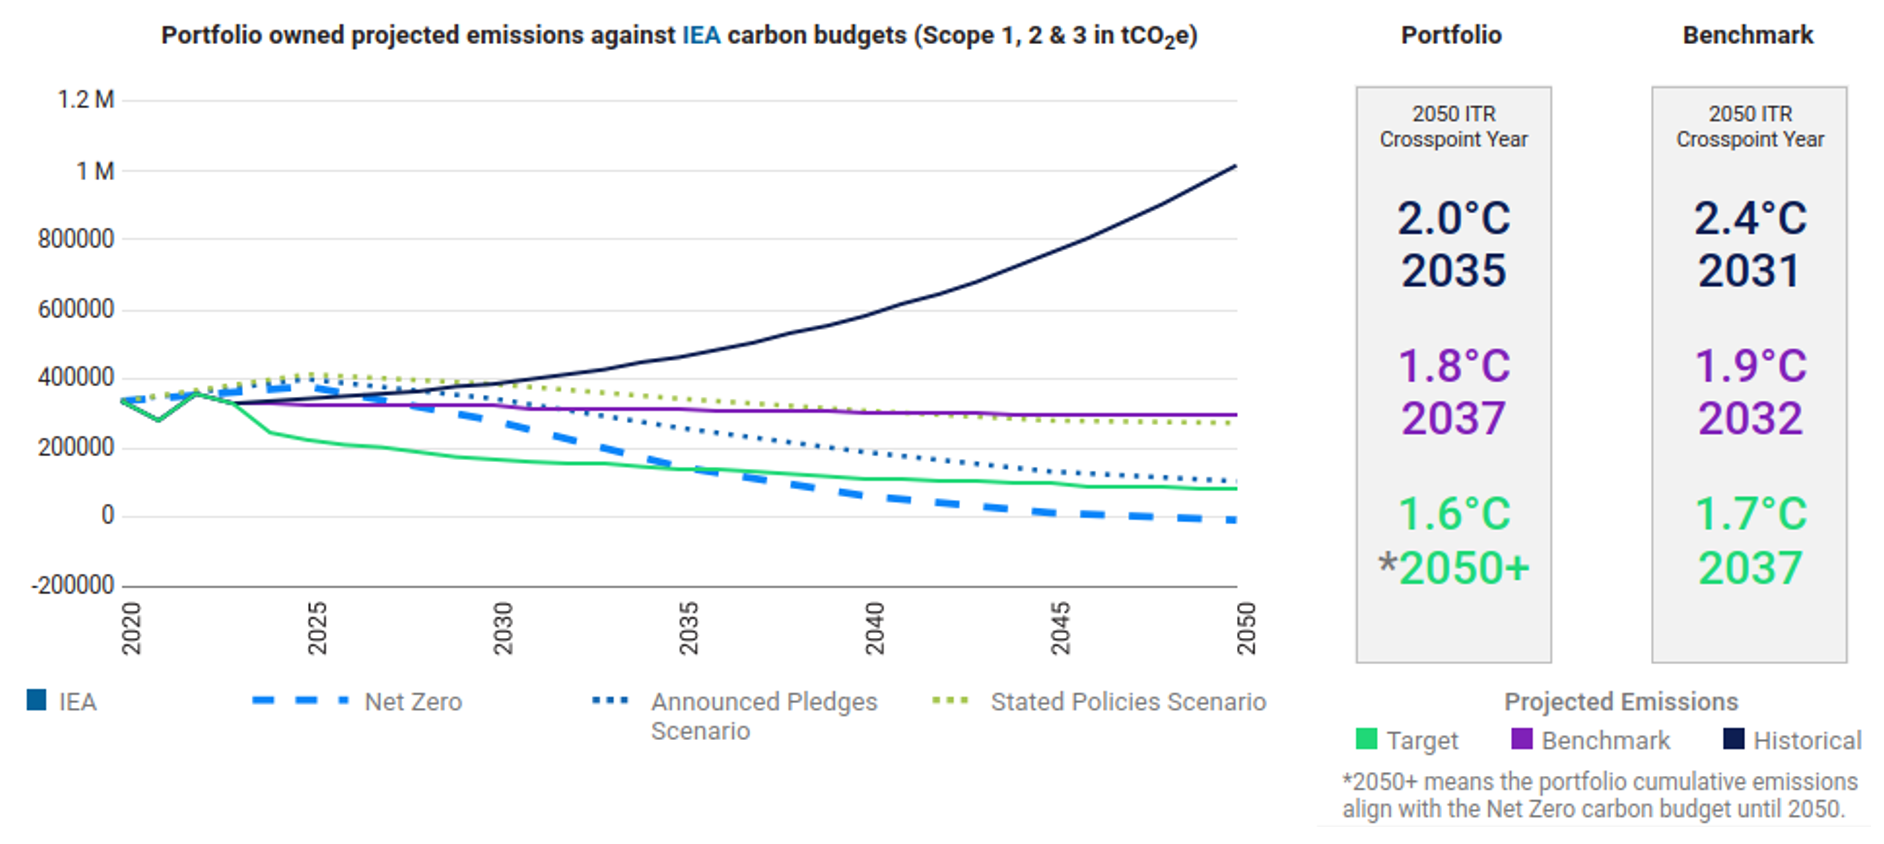
The portfolio is aligned with a net zero trajectory when we consider the target projection, and with a 2°C trajectory when we consider the historical projection.
Transitional Analysis
As expected, excluding some green bonds improved performance in the transition analysis.
For the reasons explained above, we now have only 1% of the portfolio transition value at risk.
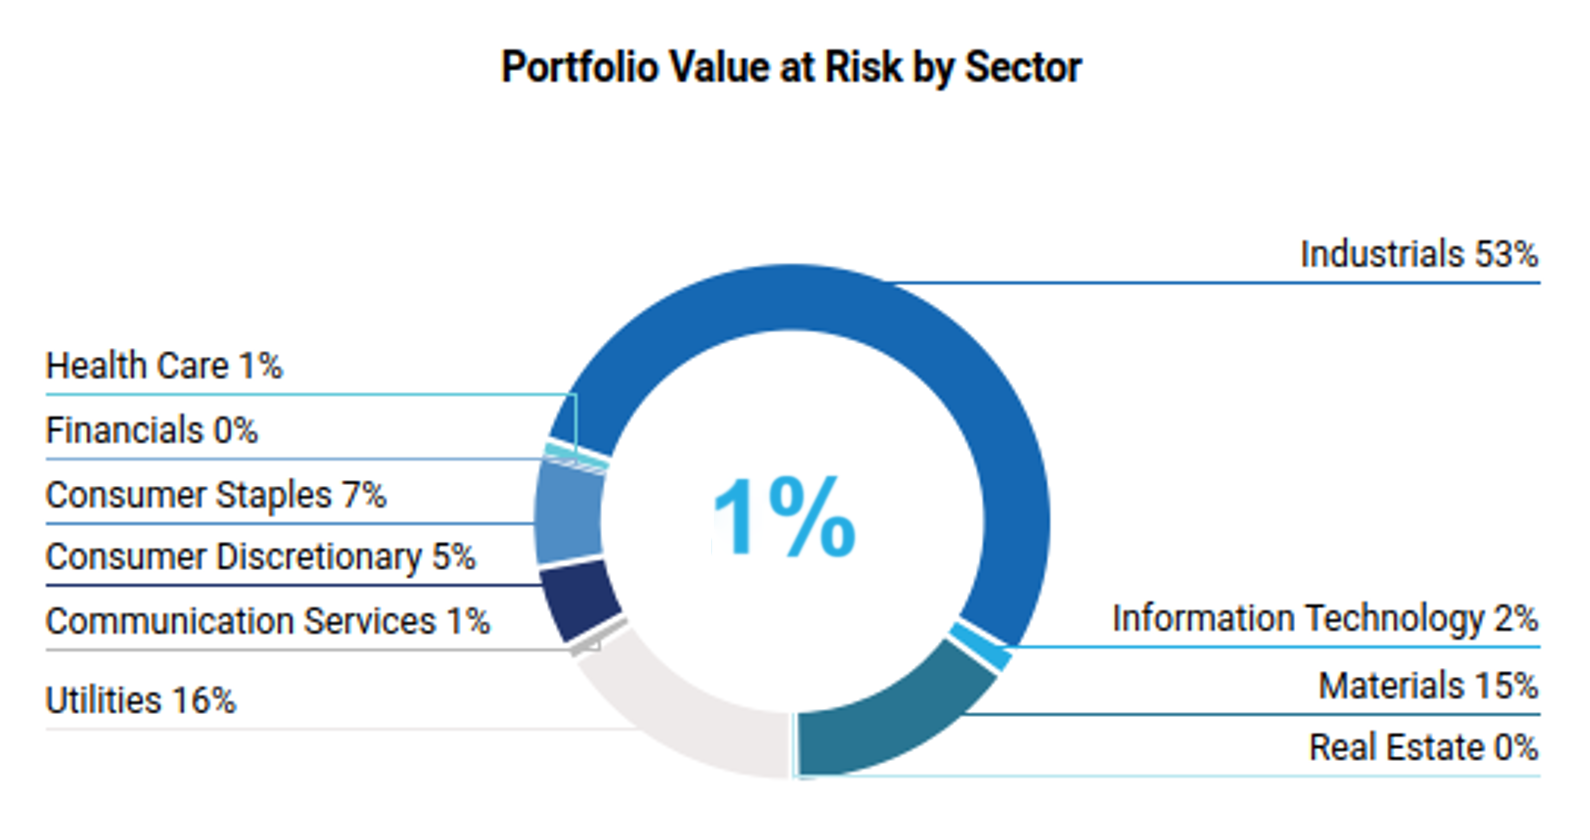
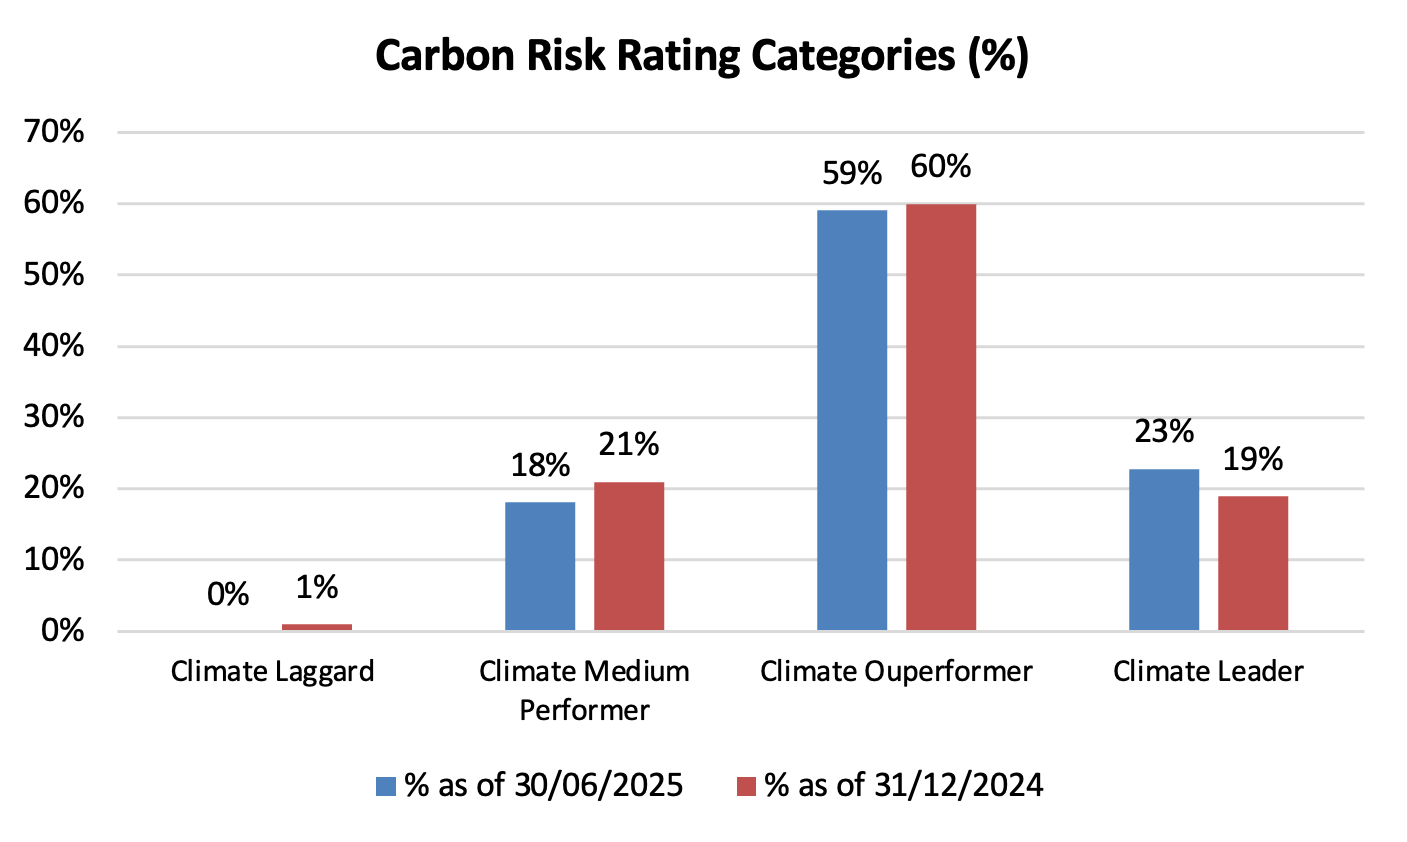
The Carbon Risk Rating for the issuers also slightly improved.
As expected, excluding some green bonds resulted in a decrease in the percentage of power generated from green energy in the portfolio.
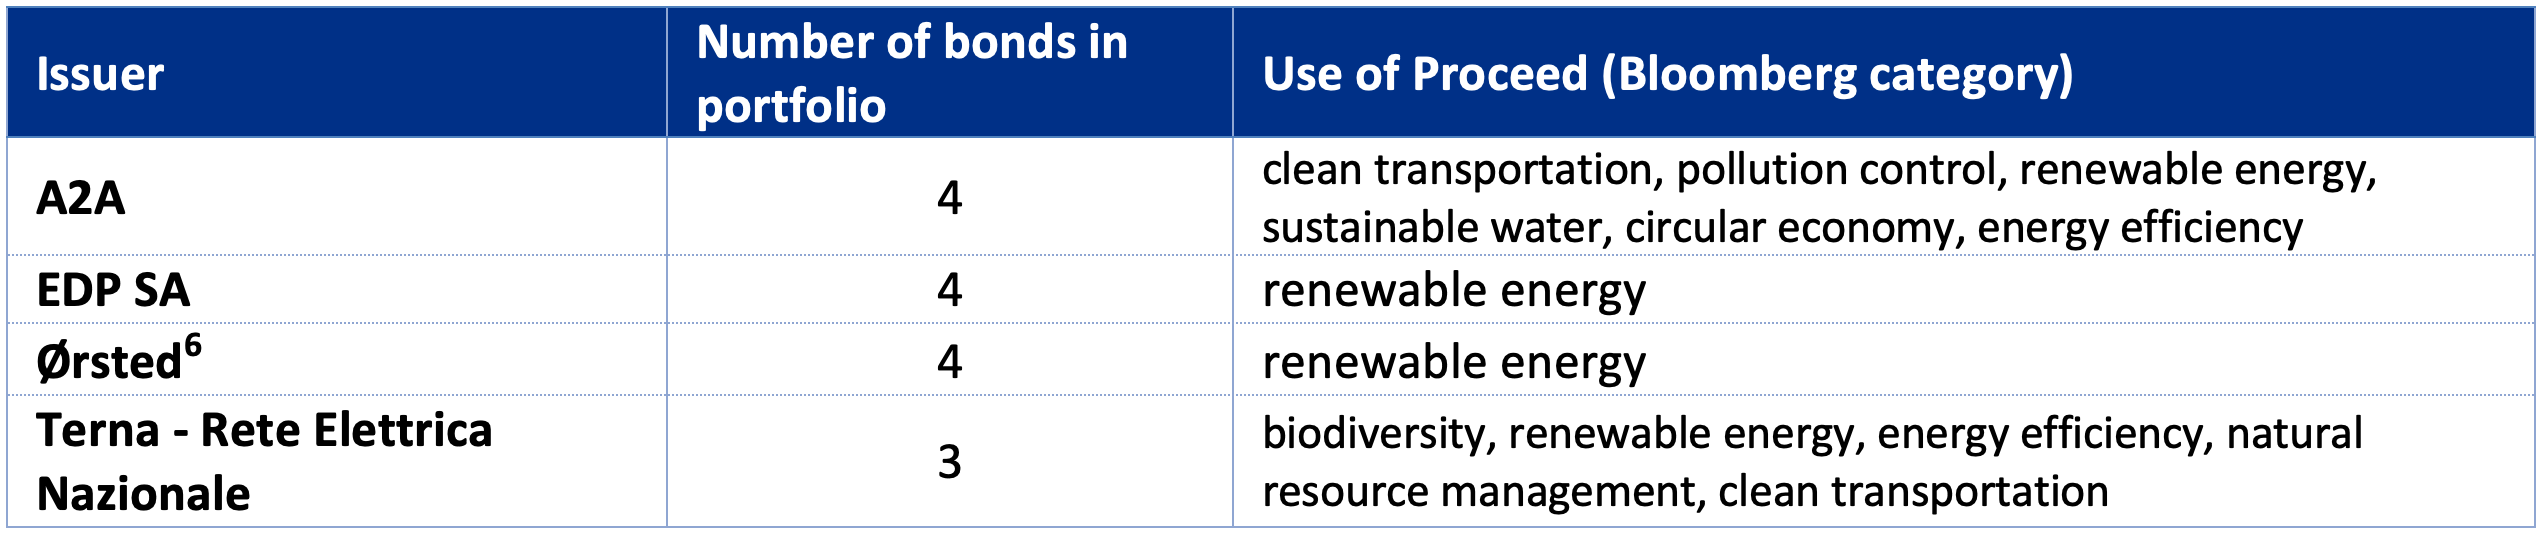
This is because, as of 30 June, we only had green bonds from 3 utilities. Orsted, EDP SA e RED ELECTRIC Corp.
The table below shows the portfolio transition analysis at the end of June, excluding green bonds.
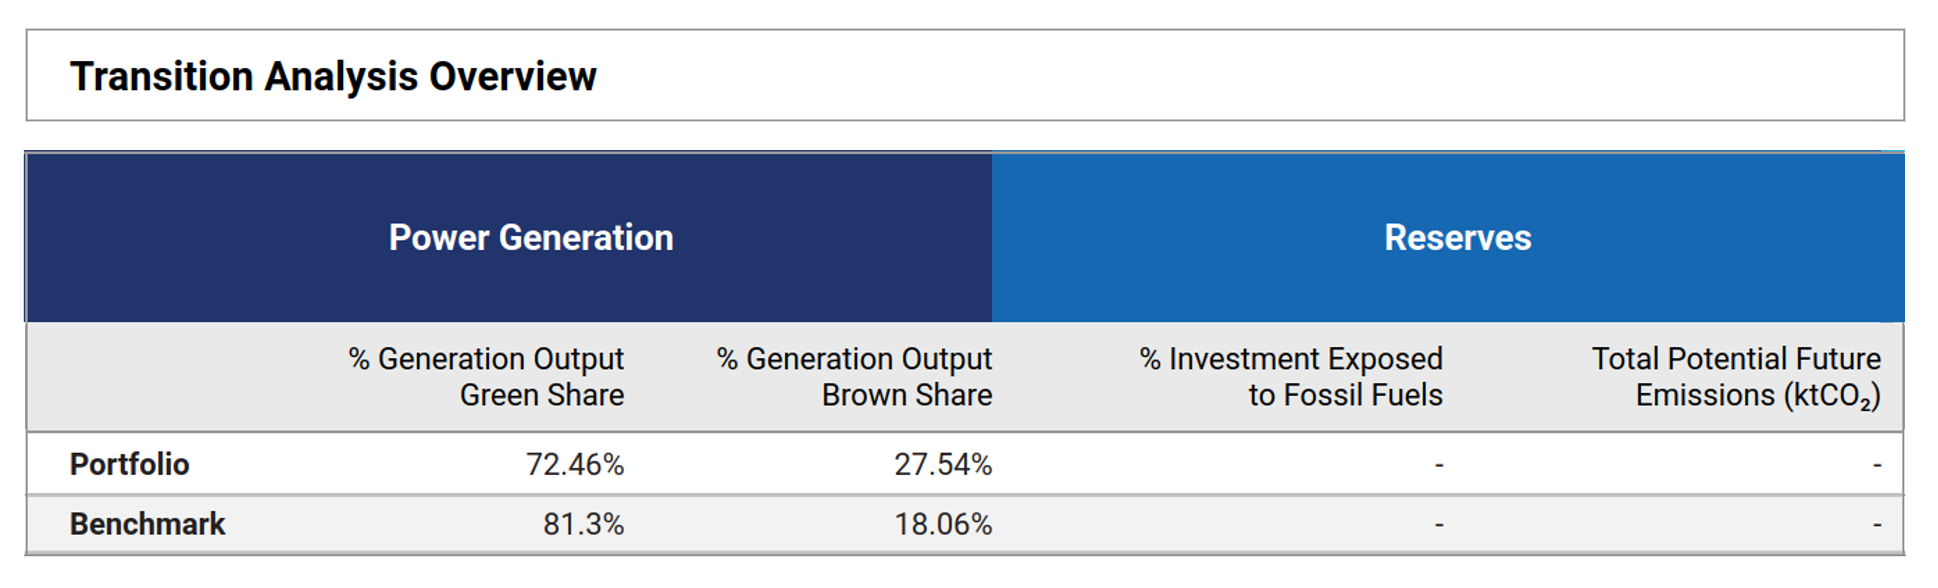
Despite having 9 pp less than at the end of 2024, we were able to calculate the impact of the green bond project.
Green Bonds: use of proceeds analysis
As of 30 June, Etica Transizione Climatica’s portfolio comprised 40 corporate green bonds.
The use of proceeds is associated with the following categories:
- Access to essential services – 1 bond
- Biodiversity – 4 bond
- Circular economy – 3 bond
- Clean transportation – 6 bond
- Climate change adaptation – 2 bond
- Energy efficiency – 7 bond
- Green buildings – 10 bond
- Natural resource management – 2 bond
- Pollution control – 3 bond
- Renewable energy (wind, bioenergy, geothermal, solar, hydro and marine) – 30 bond
- Sustainable water – 2 bond
Most of the bonds that we financed contribute to renewable energy production. Where available, we used data from Bloomberg’s income allocation reports to quantify the renewable energy generated by these bonds, which amounts to 31,724.61 GWh. When we add this to the energy generated by the companies in our portfolio, the result is that close to 80% of the portfolio’s total energy production comes from renewable sources.
Physical Risks Analysis Overview
Excluding green bonds also improves performance in physical risk analysis. The value at risk decreases to less than 1%. The issuers’ management of this risk remains strong.
Sovereign Bond – Green Bond Analysis
The bonds in the portfolio remain almost unchanged between the two analyses.
As of 30 June, our portfolio comprised 21 bonds, including 14 green bonds (66%), which contribute to reducing the issuer’s emissions.
Excluding the green bonds from the analysis reveals a significant difference with the benchmark in terms of weight. Therefore, a significant change in carbon metrics is expected in the next analysis of government emissions, which, for technical reasons, can only be carried out once a year.
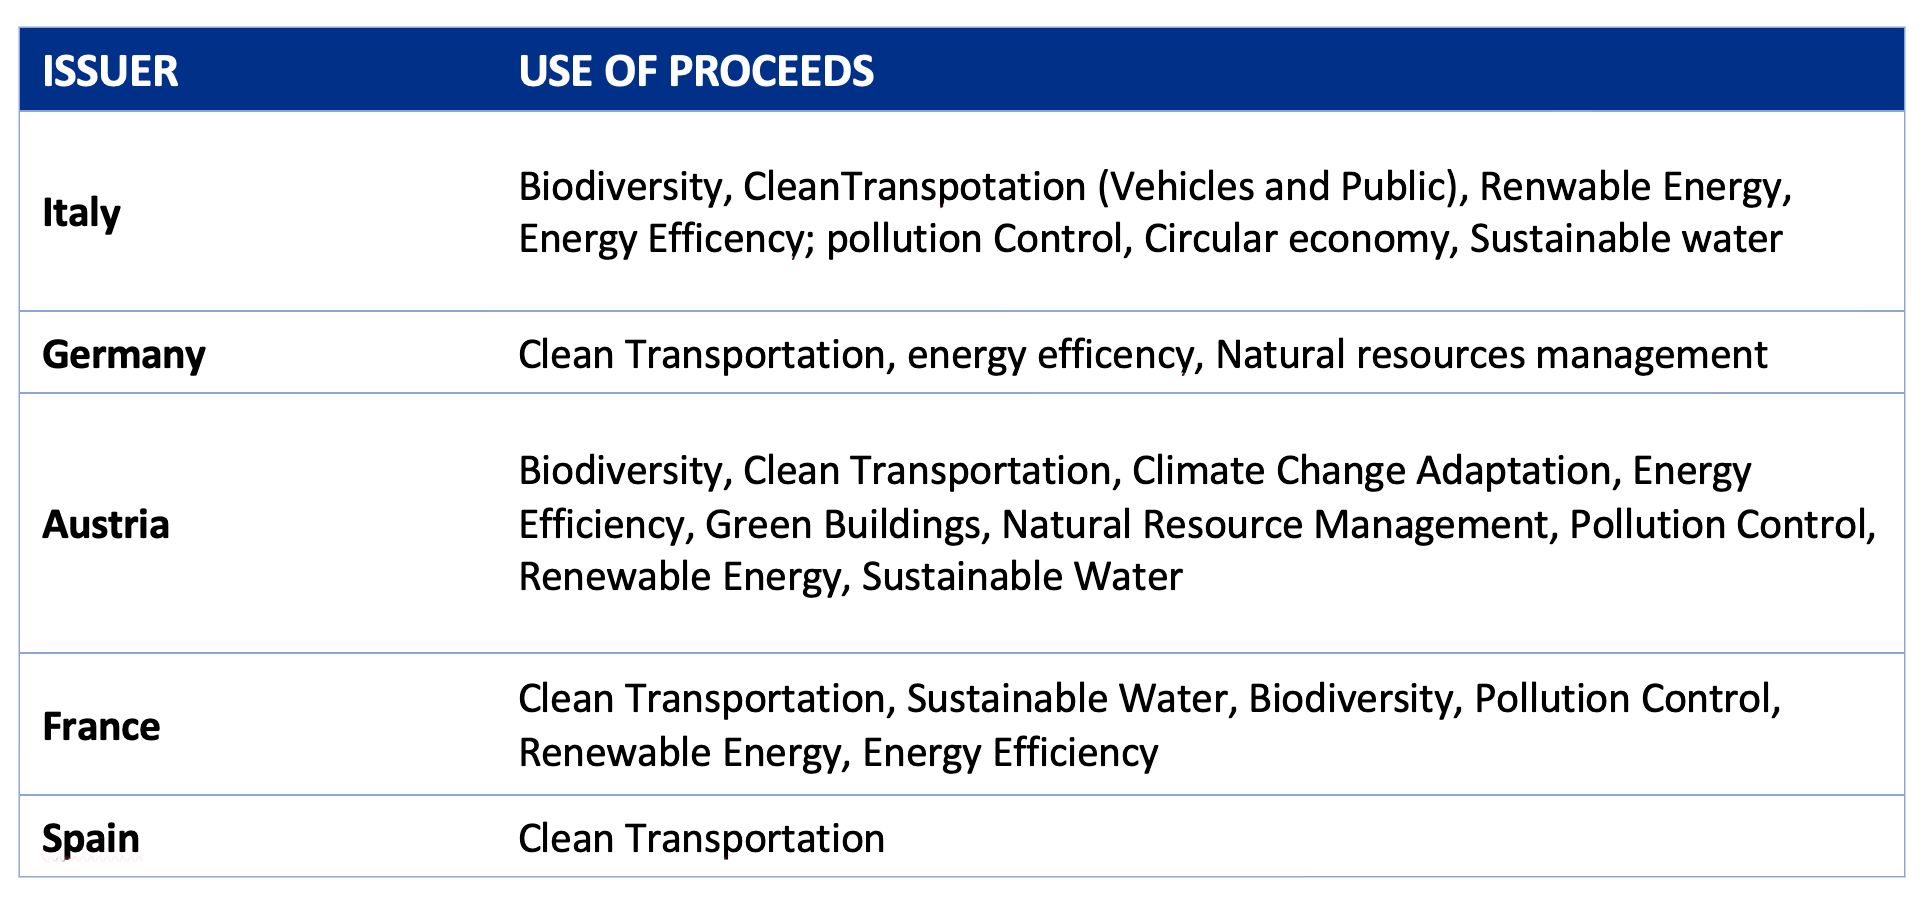
For the bonds for which data was available at the time of the analysis, it was possible to see which project categories the green bond proceeds were allocated to. The aggregate results by country are shown below.
Conclusion
Excluding green bonds from the climate analysis enables us to provide a more detailed and accurate assessment of portfolio emissions. Thanks to this approach, we have achieved remarkable results:
- a 32.4% reduction in the relative carbon footprint.
- a 39.4% reduction in carbon intensity.
- a 40.7% reduction in WACI.
Compared to the benchmark.
Moreover, compared to 2019, our carbon intensity has decreased by 49% as of 30 June 2025.
The above demonstrates the tangible impact of green bonds on the performance of Etica Transizione Climatica, despite limitations arising from data providers.
The contribution of this fund to the transition is further highlighted by: the significant percentage of renewable energy in the portfolio’s energy mix (I.e. 80%), the very low transition risk and the high carbon risk rating for the companies in the portfolio.
Climate Impact in Brief
Updated December 2024
The analysis outlines the climate performance calculated on the portfolio at the year-end of 2024 and compares it with the index MSCI World ESG Universal Net Total Return (now MSCI World Universal Net Total Return) as a market benchmark (also referred to as “the benchmark”) on the same date. It is divided into the following sections: carbon metrics, scenario analysis, transitional climate risks analysis, physical risks, additional insights, and conclusions.
- Carbon metrics
- Etica Transizione Climatica, Y-o-Y changes
- Scenario Analysis
- Transitional climate risks analysis
- Physical risks
- Additional insights
- Conclusions
- Sovereign bonds
Carbon metrics
The carbon metrics used in the Equity and Corporate Bonds analysis are the following ones and are explicitly recommended by the TCFD:
- Relative Carbon Footprint: defined as the total scope 1 and scope 2 GHG emissions of the portfolio, directly attributable to the investor through its ownership share in companies’ total market value (also defined as “Emissions Exposure”), per million EUR invested. It is measured in tCO2e/EUR million invested.
- Carbon intensity: defined as the total scope 1 and 2 GHG emission intensity of the portfolio (based on issuers’ revenues), directly attributable to the investor through its ownership share in the companies’ total market value. It is measured in tCO2e/EUR million revenue.
- The Weighted Average Carbon Intensity (WACI): expresses scope 1 and 2 GHG emission intensity (based on issuers’ revenues), proportional to the issuers’ weight in the portfolio. Hence, this does not take the ownership share into account. It is measured in tCO2e/EUR million revenue.
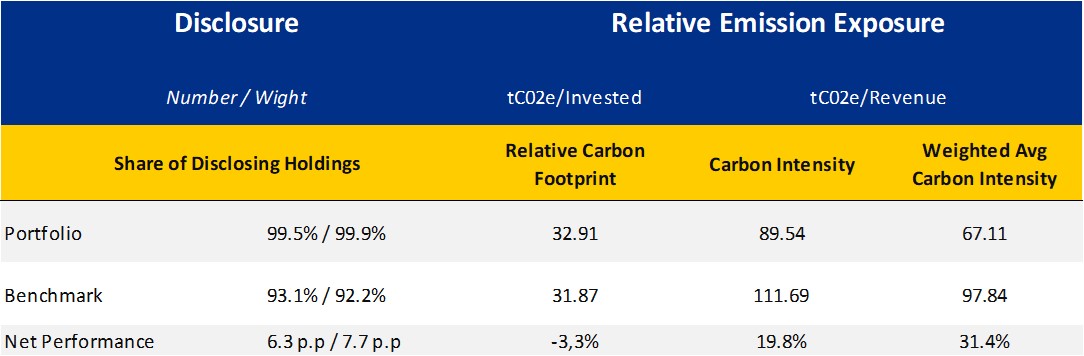
Figure 1 – Portfolio Overview, Climate Impact Assessment Transizione Climatica end 2024.
This is a positive overall result for the Etica Transizione Climatica fund.
The funds outperform the benchmark in terms of both carbon intensity and WACI. However, we perform slightly worse in terms of the relative carbon footprint. The Relative Carbon Footprint takes into account absolute exposure to emissions in relation to total invested value. This means that some of the issuers in the portfolio have higher absolute emissions than the benchmark. This is not surprising, given the benchmark’s high exposure to lower-emitting sectors, such as financial services and IT.
Despite the impact of some ‘heavy’ issuers, the weighted average and intensity in relation to revenues is lower. This is partly because, even in energy-intensive sectors such as materials, selected issuers are more efficient than their peers in the benchmark
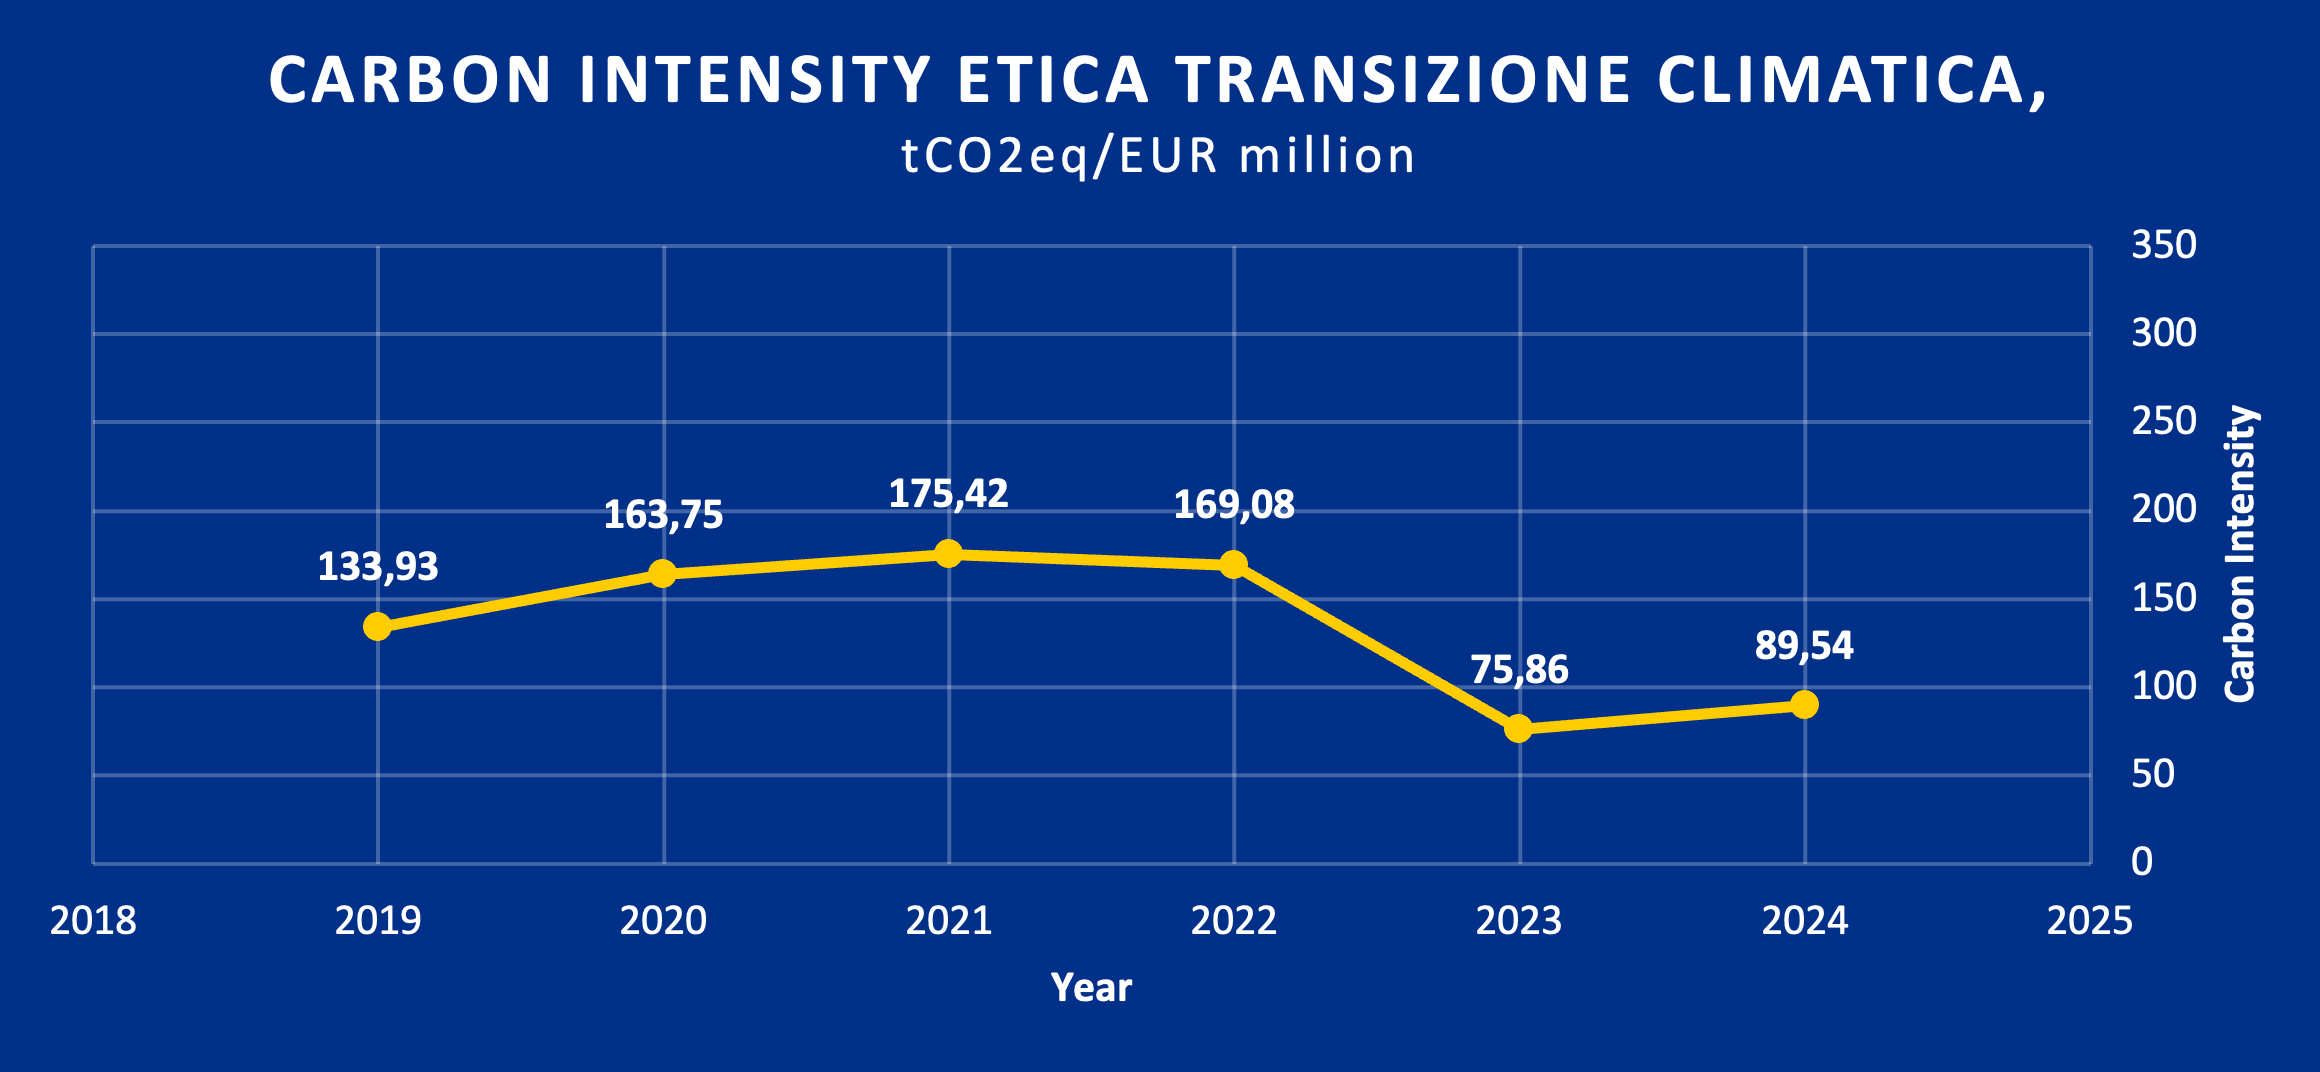
Despite this, the performance is worse compared to last year, with a 18% increase in carbon intensity. However, we achieved a 33% improvement compared to the first year of analysis (2019).
The main reason for this increase can be attributed to the material sector.
Below is a breakdown of the sectors contributing to the portfolio’s emissions and their respective weights. Please note that, although the materials sector accounts for 6% of the total weight, it accounts for 56% of the total portfolio emissions.
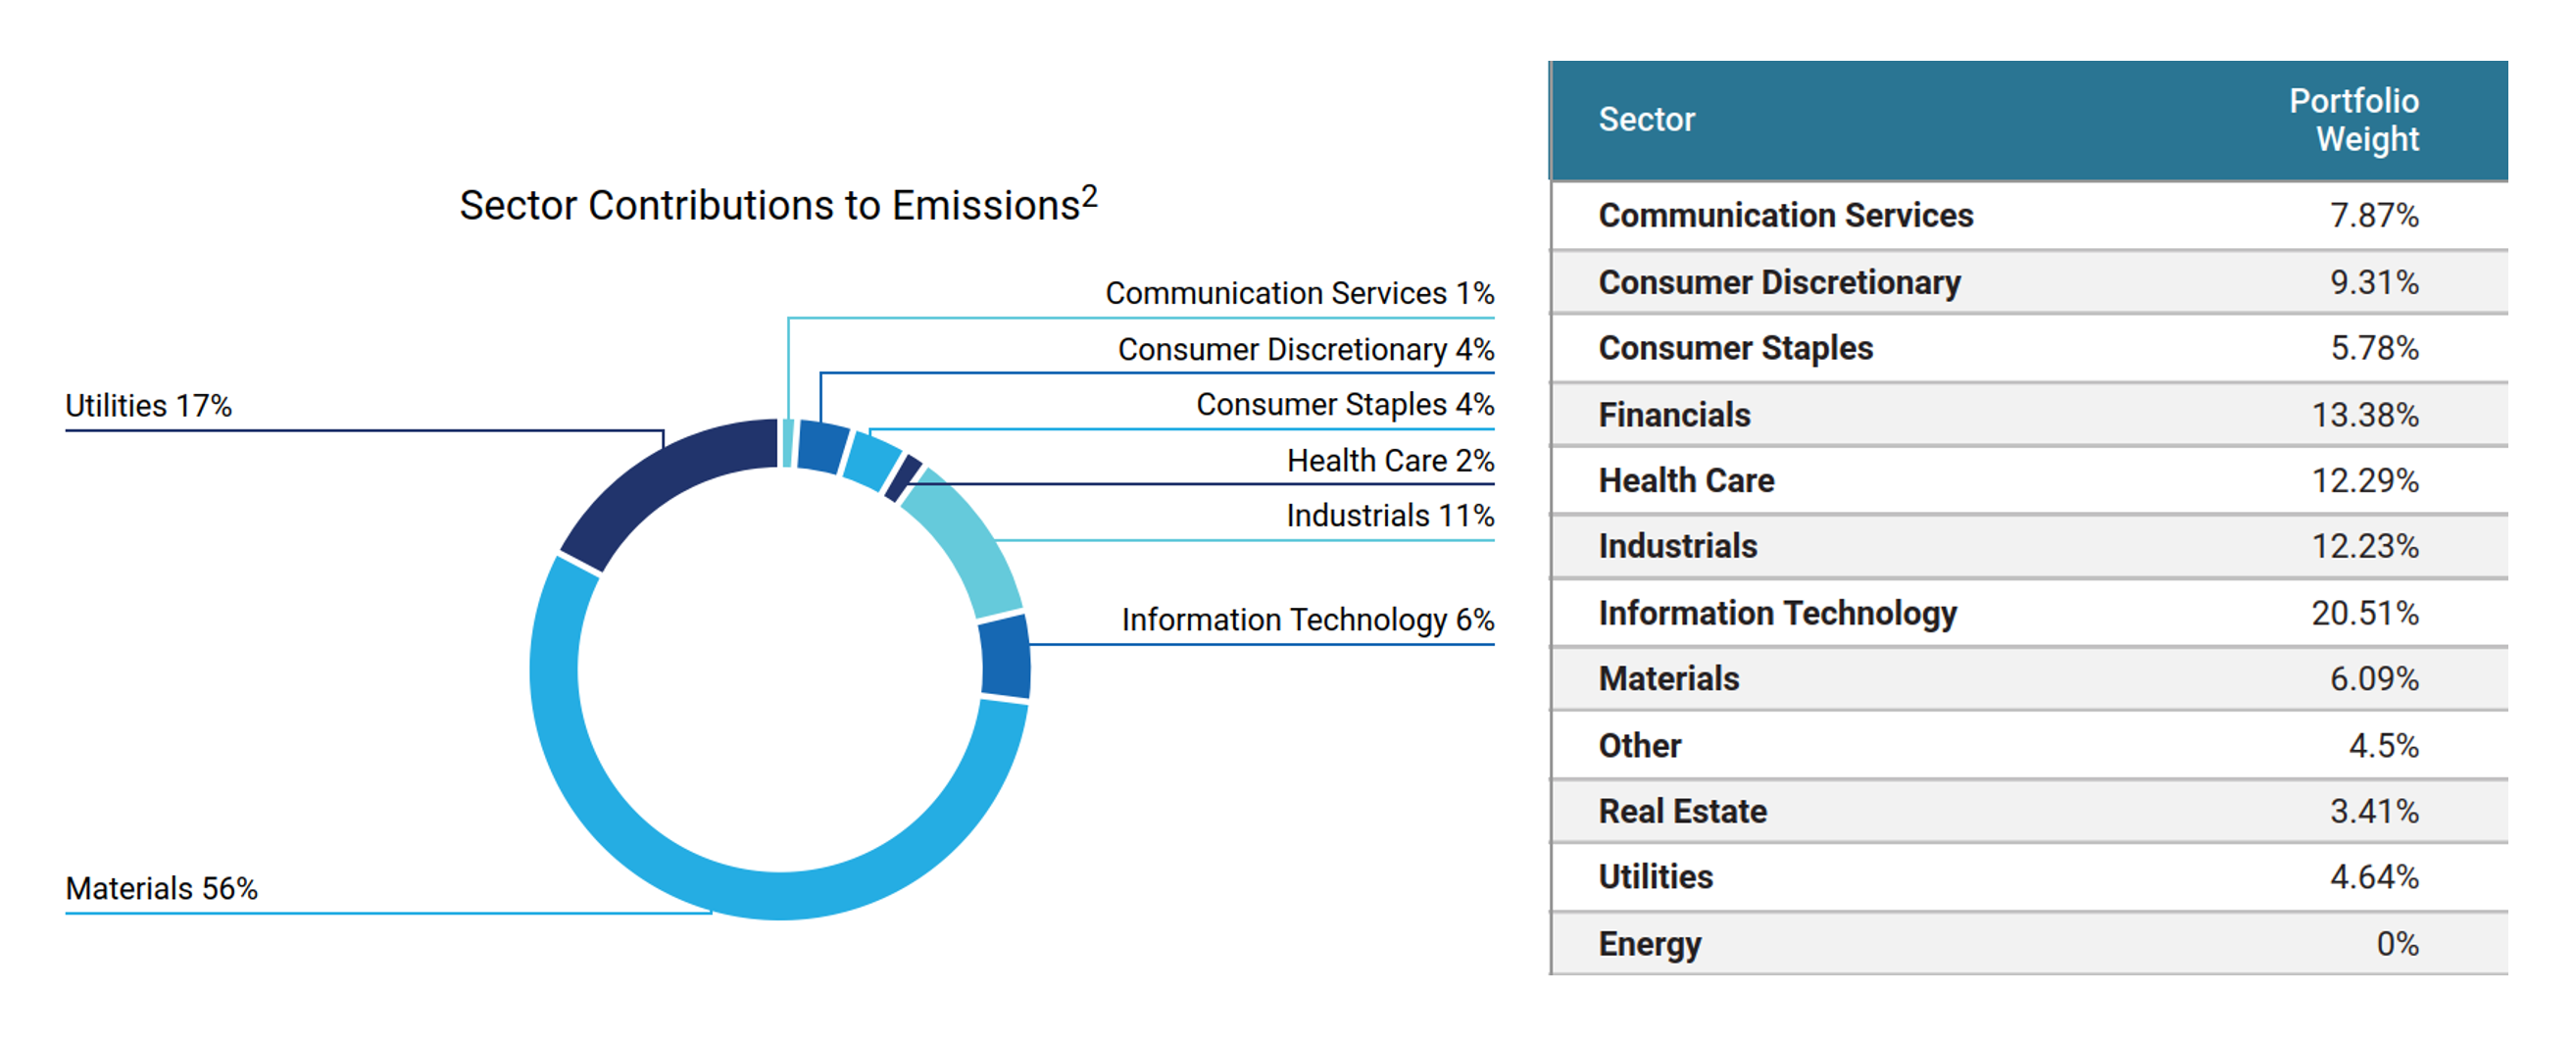
Figure 3 – the sectors contributing to the portfolio’s emissions and their weight.
Between the end of 2023 and the end of 2024, the number of companies in the materials sector in our portfolio doubled leading to a significant increase in emissions.
This increase in issuers is primarily driven by financial considerations.
Nevertheless, the methodology remains robust, as evidenced by the decrease compared to 2019.
After the selection process, less than 10% of the total companies in this sector remain, and these demonstrate strong issuer selection.
Etica Transizione Climatica, Y-o-Y changes
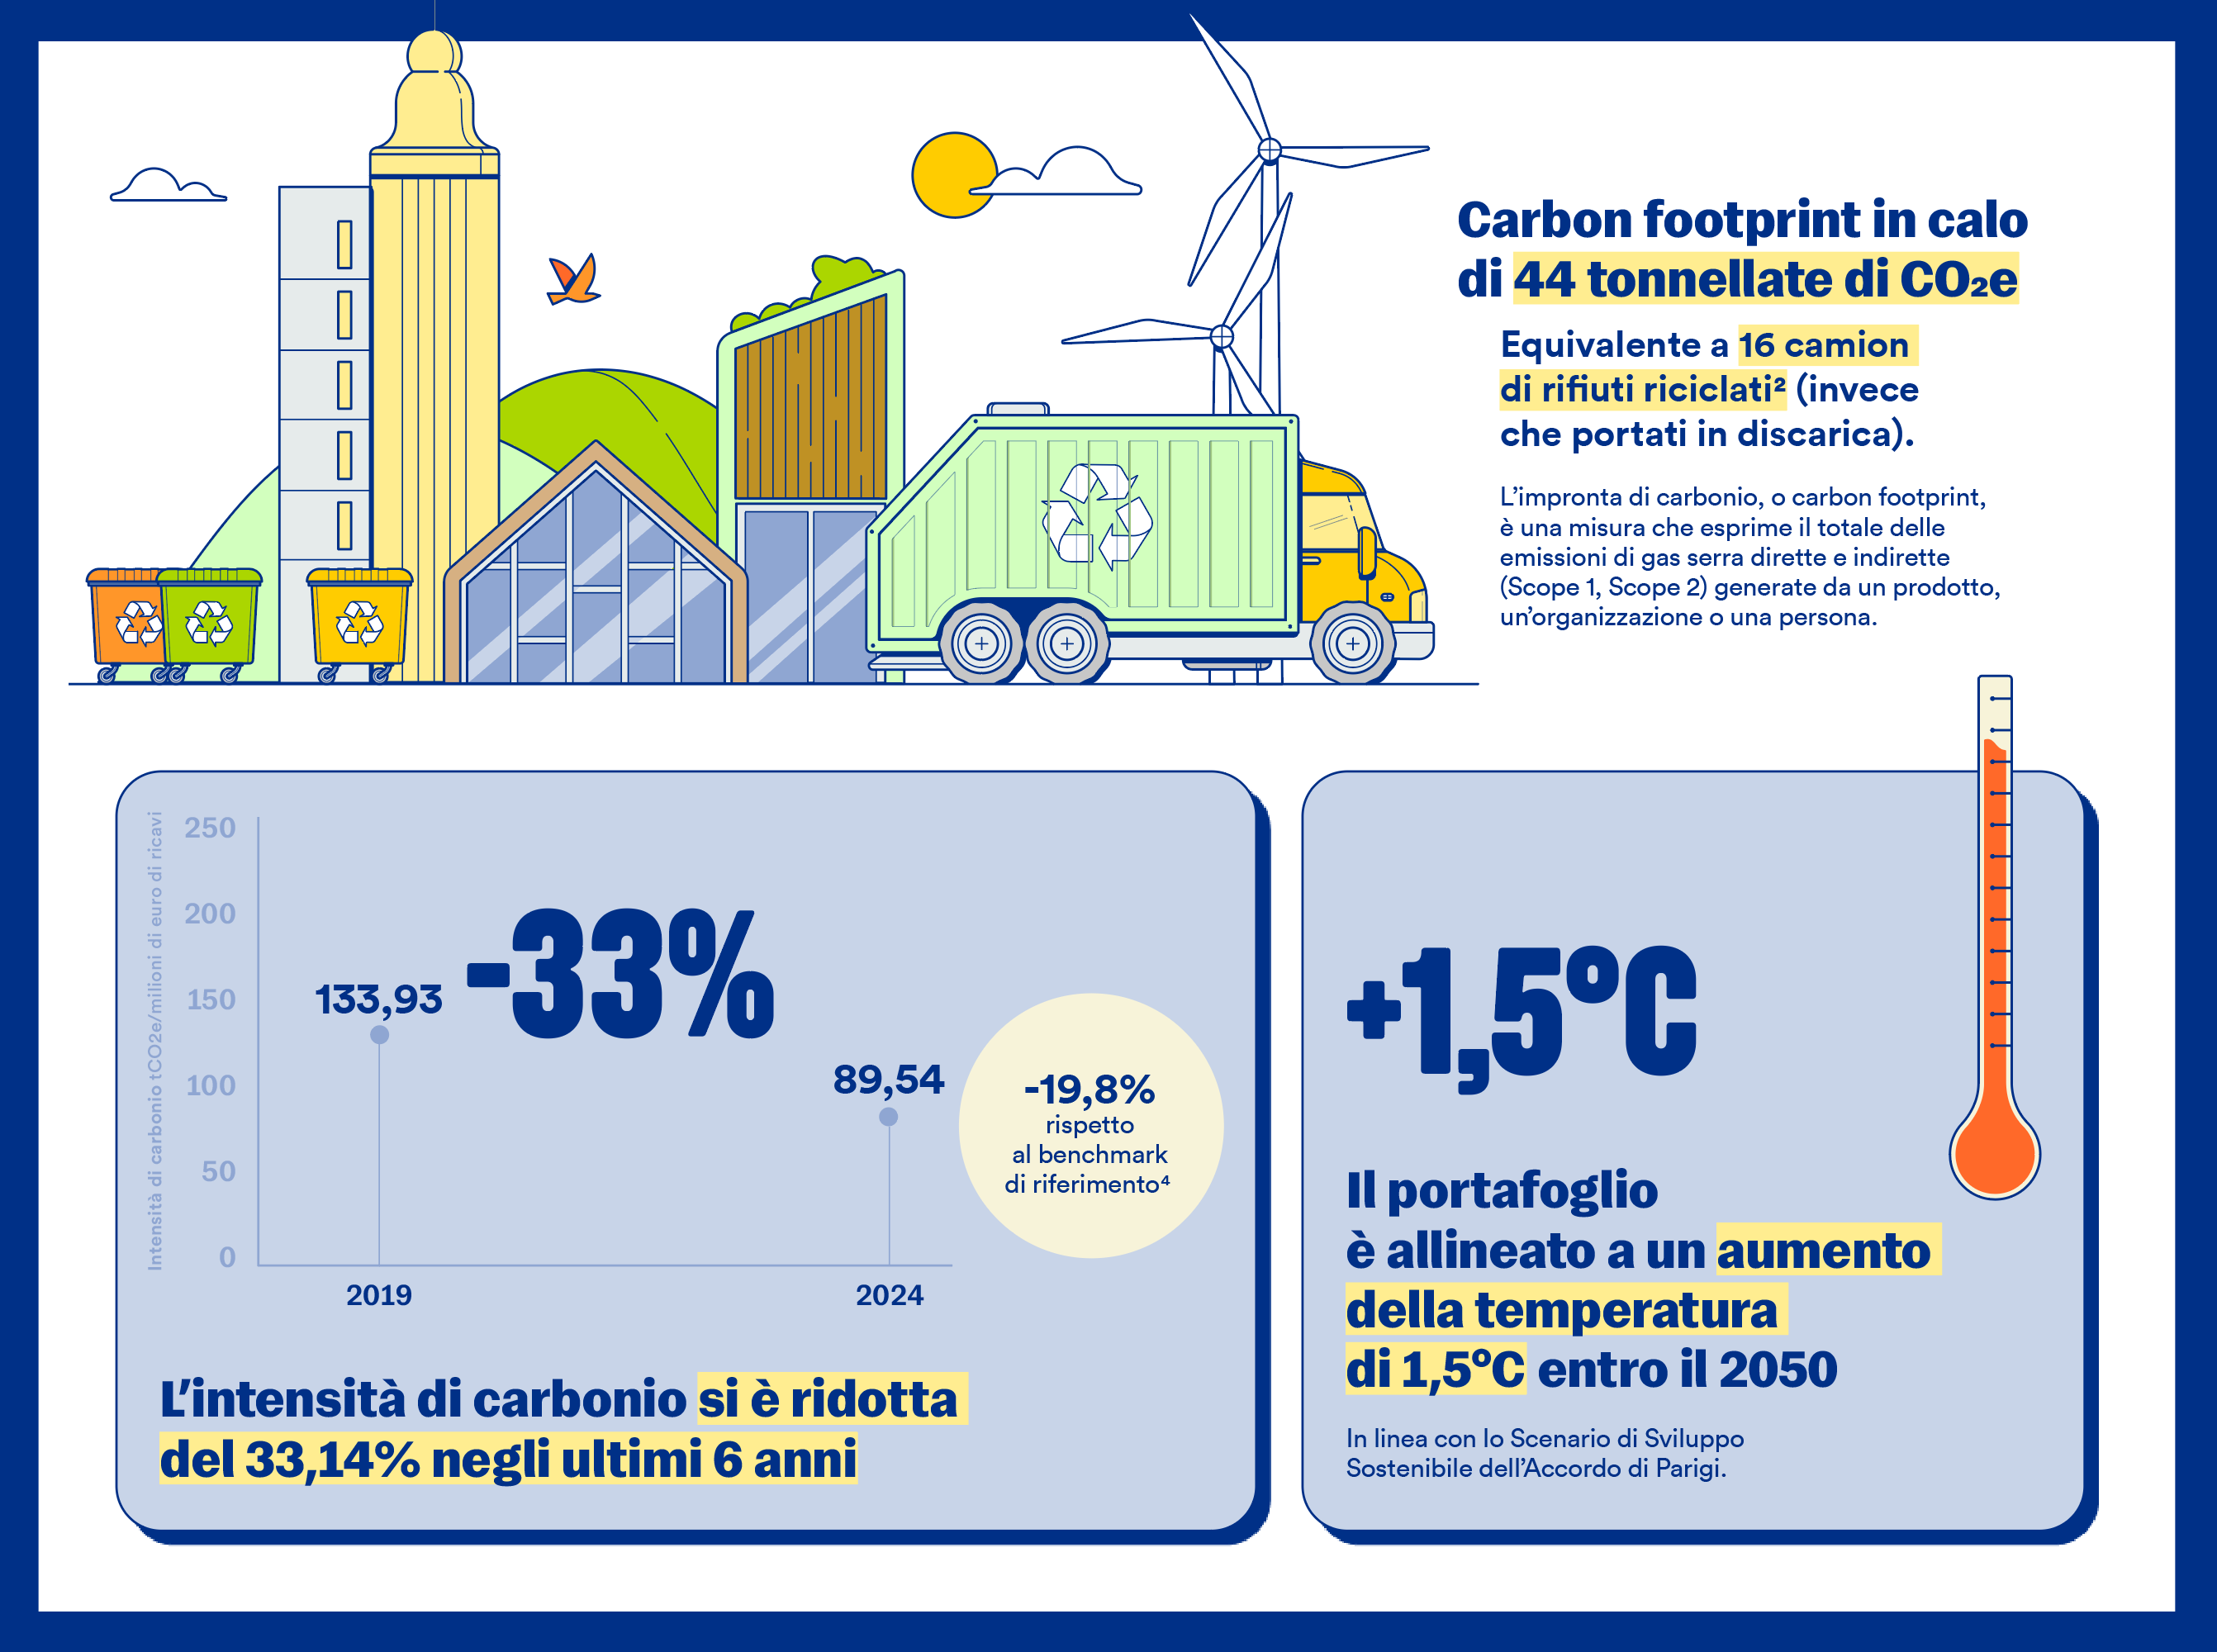
The table below shows the progress made in reducing emissions in the Etica Transizione Climatica portfolio since 2019, as measured against the three core TCFD metrics.
Please note that we have achieved:
- -57.97% relative carbon footprint;
- -33.14% carbon intensity;
- -27.16% WACI.
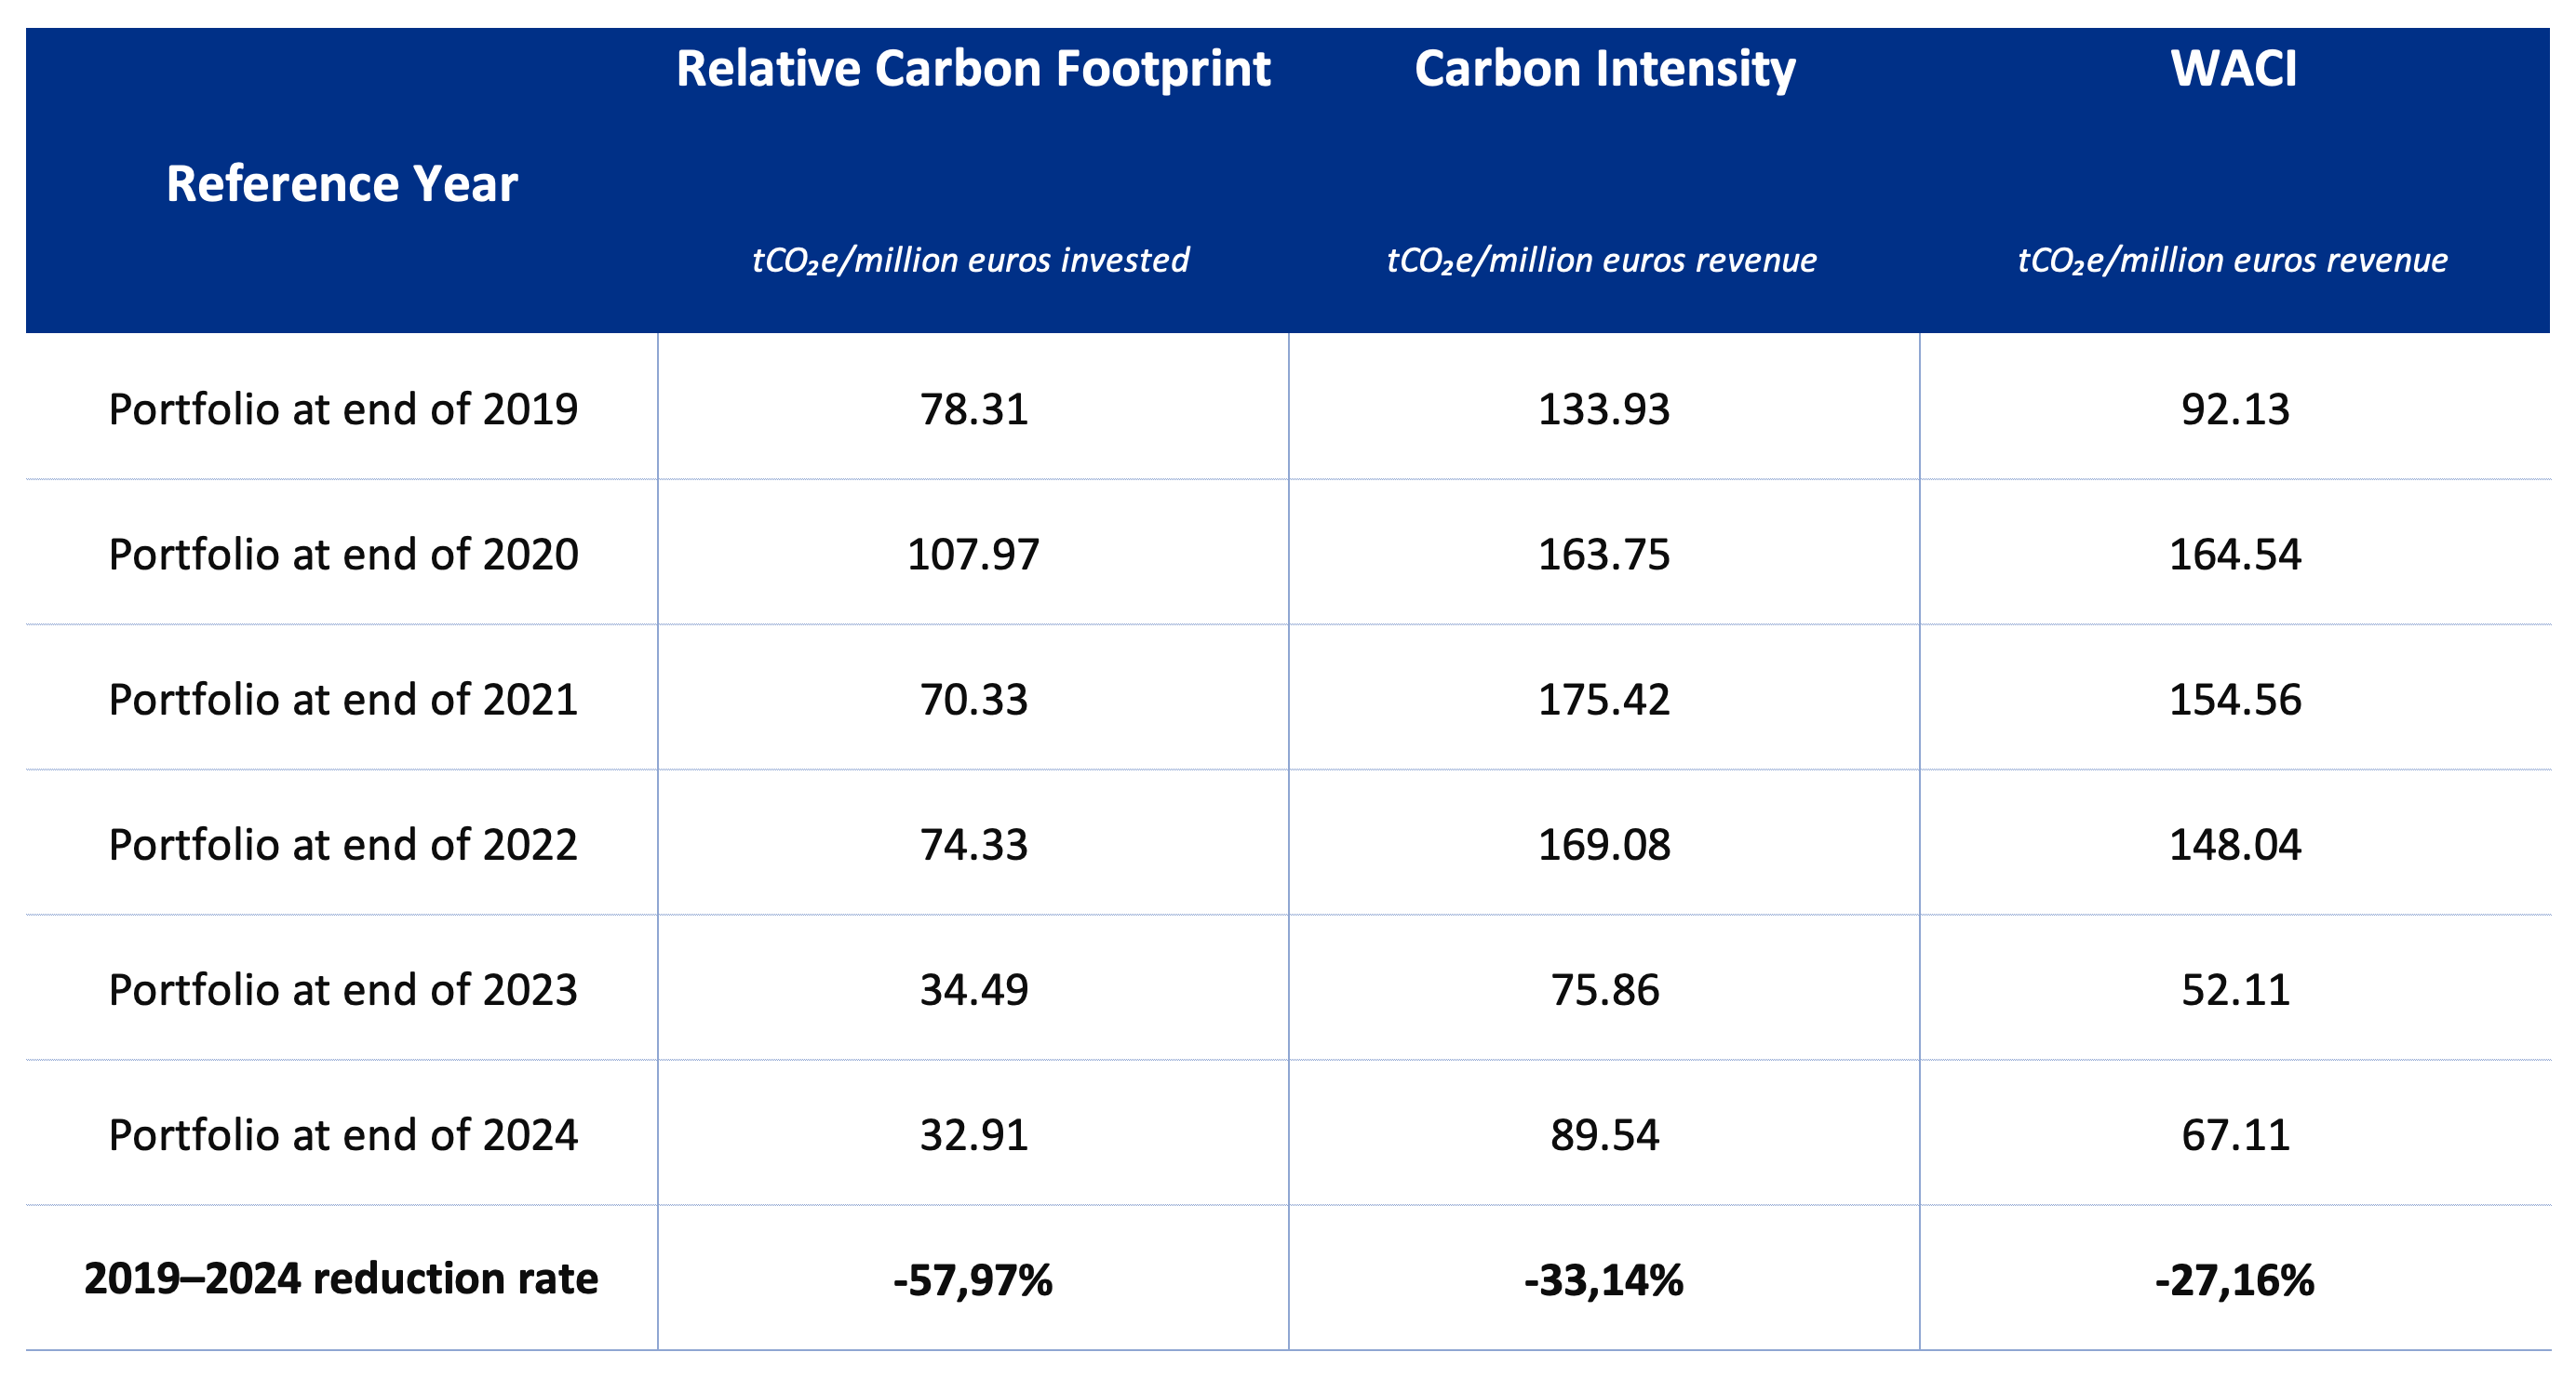
Despite the increase in 2024, the overall results show a significant reduction in emissions compared to 2019.
Scenario Analysis
The purpose of the scenario analysis is to examine the current and future emission intensity from the direct and indirect emissions of a company (GHG scope 1&2) to see which climate scenario it is aligned with, until 2050. Each company’s carbon budget is defined based on its current and estimated future market share.
The scenario analysis compares current and future portfolio’s GHG emissions with the carbon budget estimated in different IEA scenarios: Sustainable Development Scenario (SDS)[3], Announced Pledges Scenario (APS) and Stated Policies Scenario (STEPS)[4]. Each scenario is tied to a carbon budget, i.e. a limited amount of fossil carbon that can be combusted worldwide to remain within a certain temperature. The carbon budget changes depending on the scenario, with the Sustainable Development Scenario being the most ambitious one, consistent with a global temperature increase well below 2°C by 2100, compared to pre-industrial levels.
The analysis shows that the current state of the portfolio is in line with a 2050 SDS scenario. This means that, for the first time, the Etica Transizione Climatica has a potential temperature increase of 1.5°C.
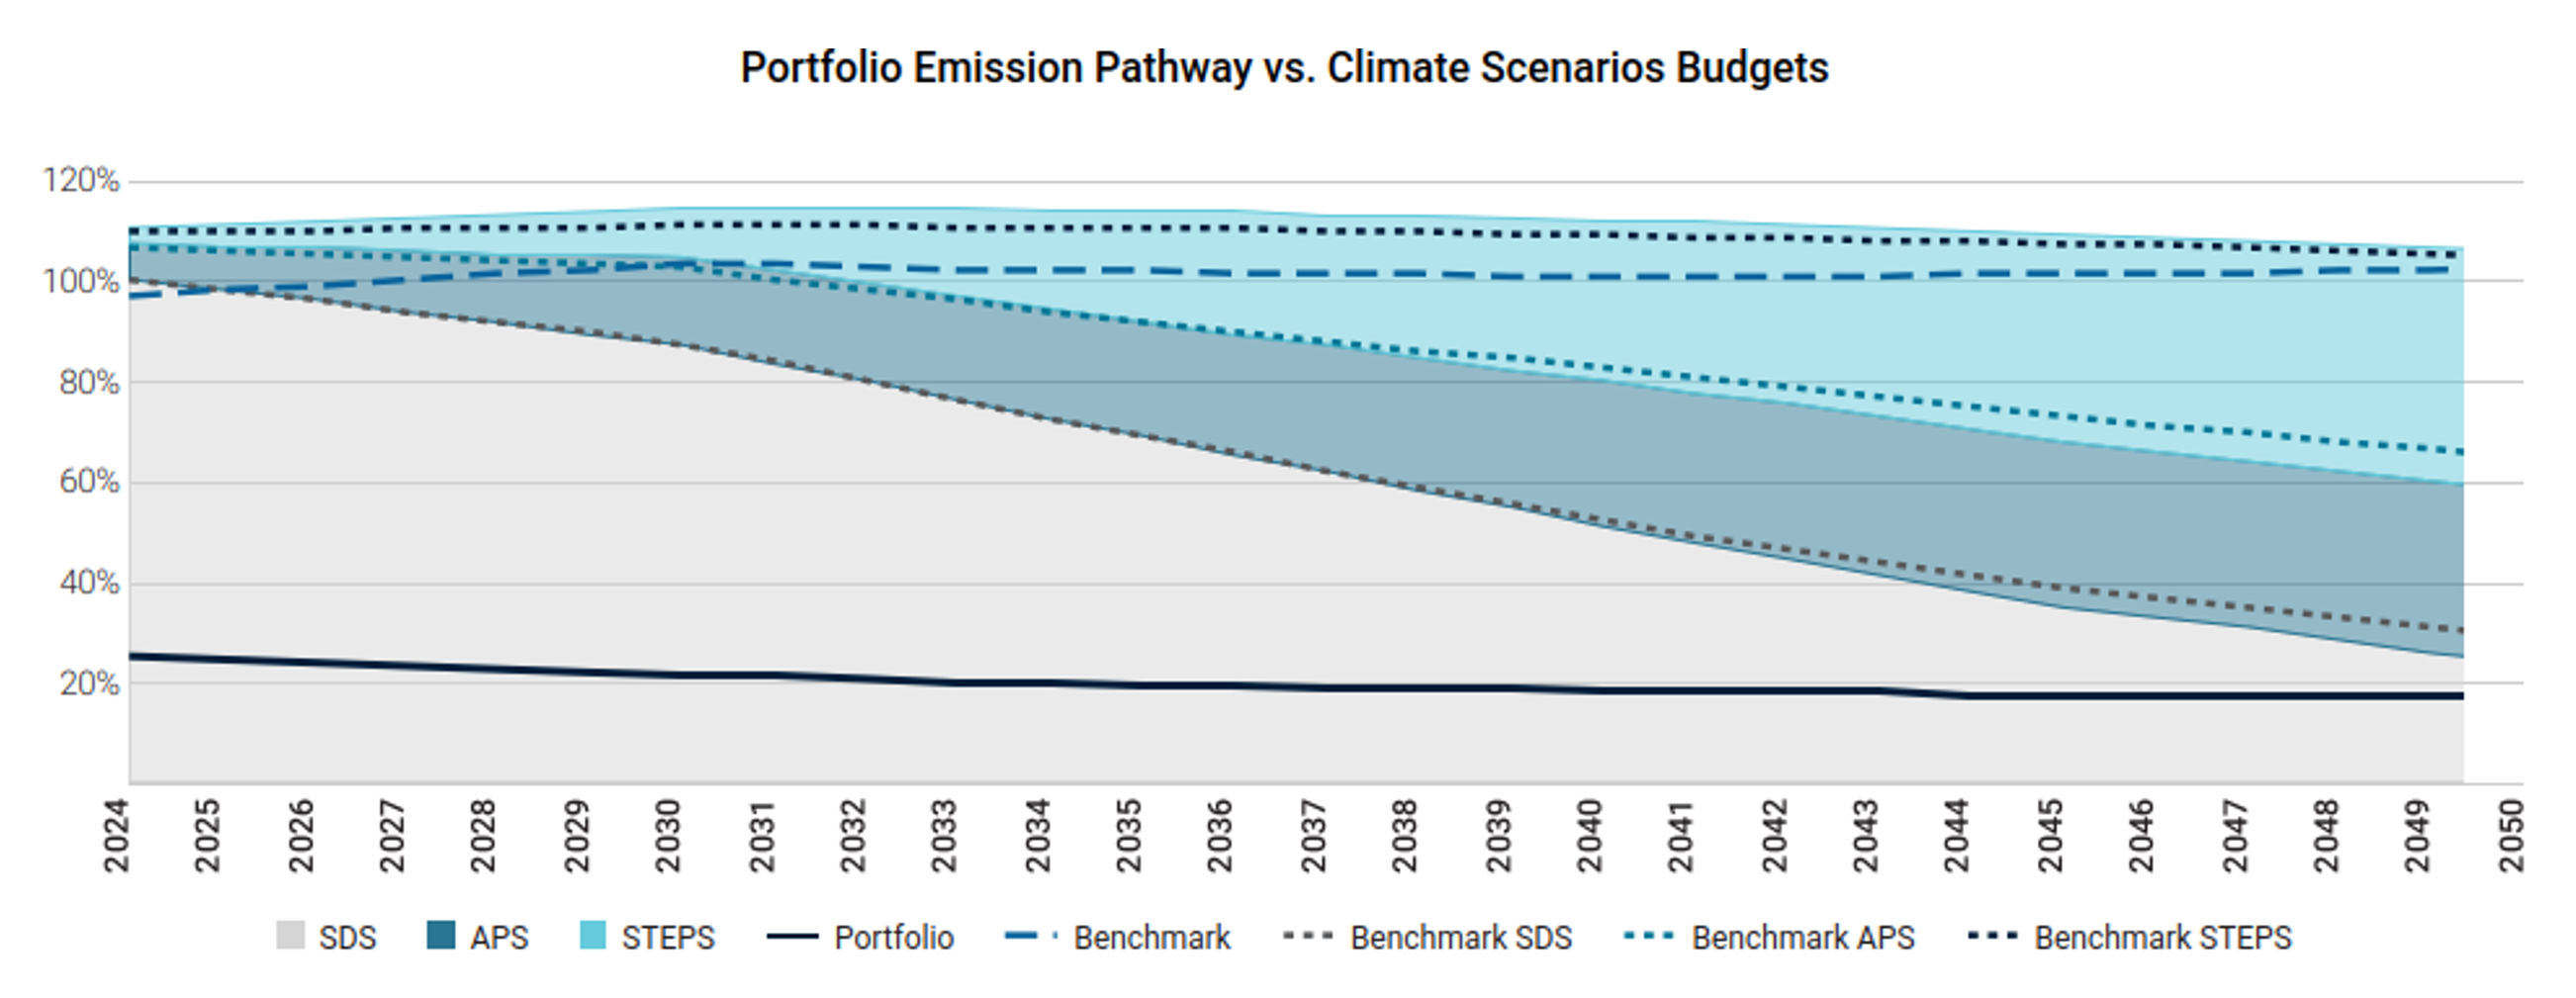
Figure 4 – Aligment Analysis for Etica Transizione Climatica, ISS Climate Impact Report 2025.
Conversely, the benchmark exceeds the budget of the SDS scenario in 2026 and is associated with a temperature increase of 2.7°C by 2050.
The better performance of the portfolio compared to the benchmark is explained by two factors, linked to the sectorial allocation and the single stock selection:
- The exclusion of most fossil activities from the portfolio
According to Etica’s investment policy, there are no investments in companies operating in the Energy sector[5]. - A higher number of companies with a commitment to reduce emissions
As of 31.12.2024, according to ISS, 90% of the portfolio’s value is committed to international climate goals and demonstrates future progress, against the 73% of the benchmark. Specifically, 71% of portfolio’s value (65% in the TCFD Report 2024) is covered by a GHG reduction target approved by the Science-Based Targets initiative (SBTi), against 52% of the benchmark. Note that only 3% of companies in the overall portfolio have no target on GHG emissions
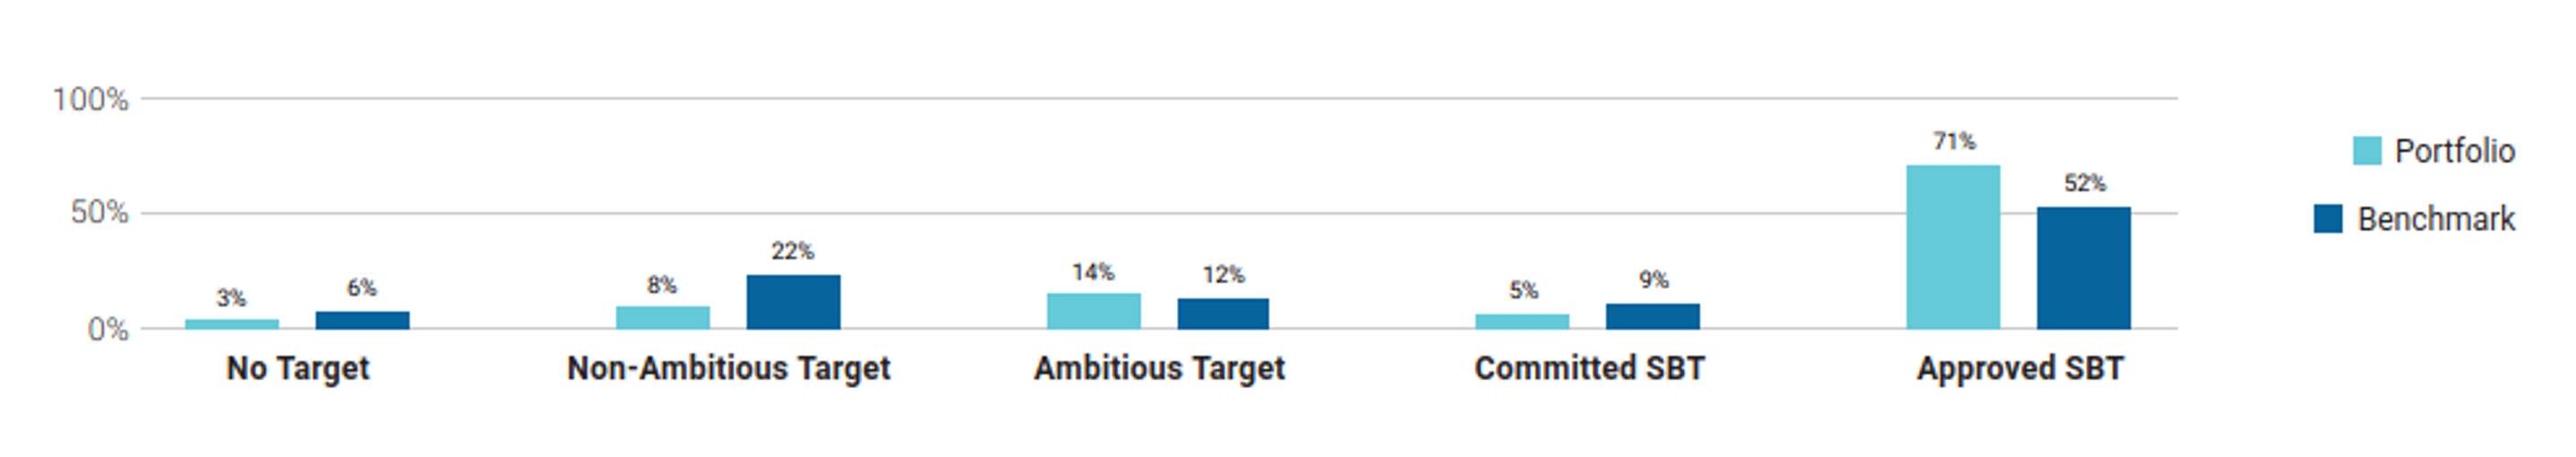
Figure 5 – Climate Target Assessment, portfolio vs benchmark.
Transitional climate risks analysis
ISS has developed a model that estimates the transition value at risk for portfolios based on the International Energy Agency’s (IEA) net zero scenario.
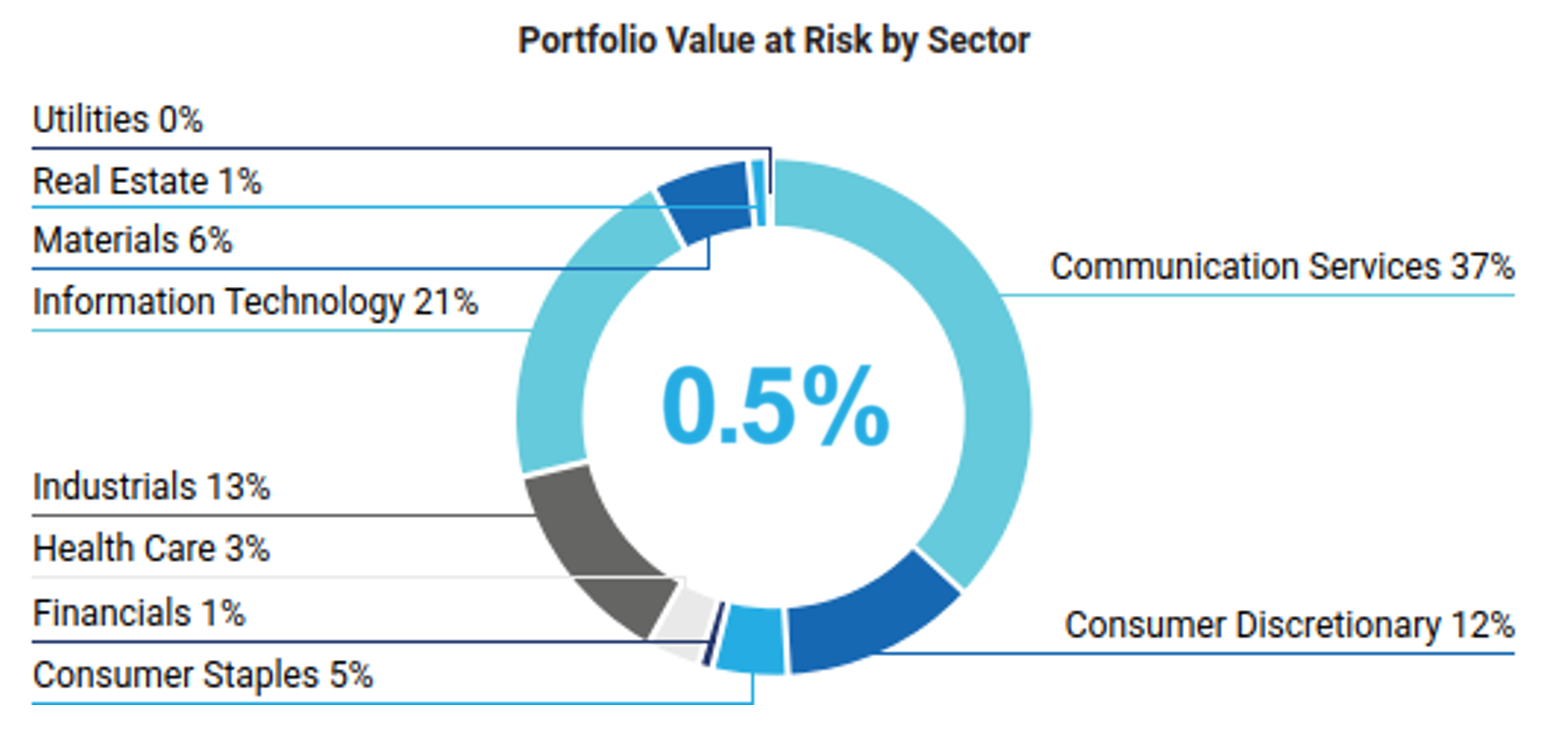
For Etica Transizione Climatica, this value is very low at only 38.7 million: less than 5% of the total analysed value is potentially exposed to transition risk.
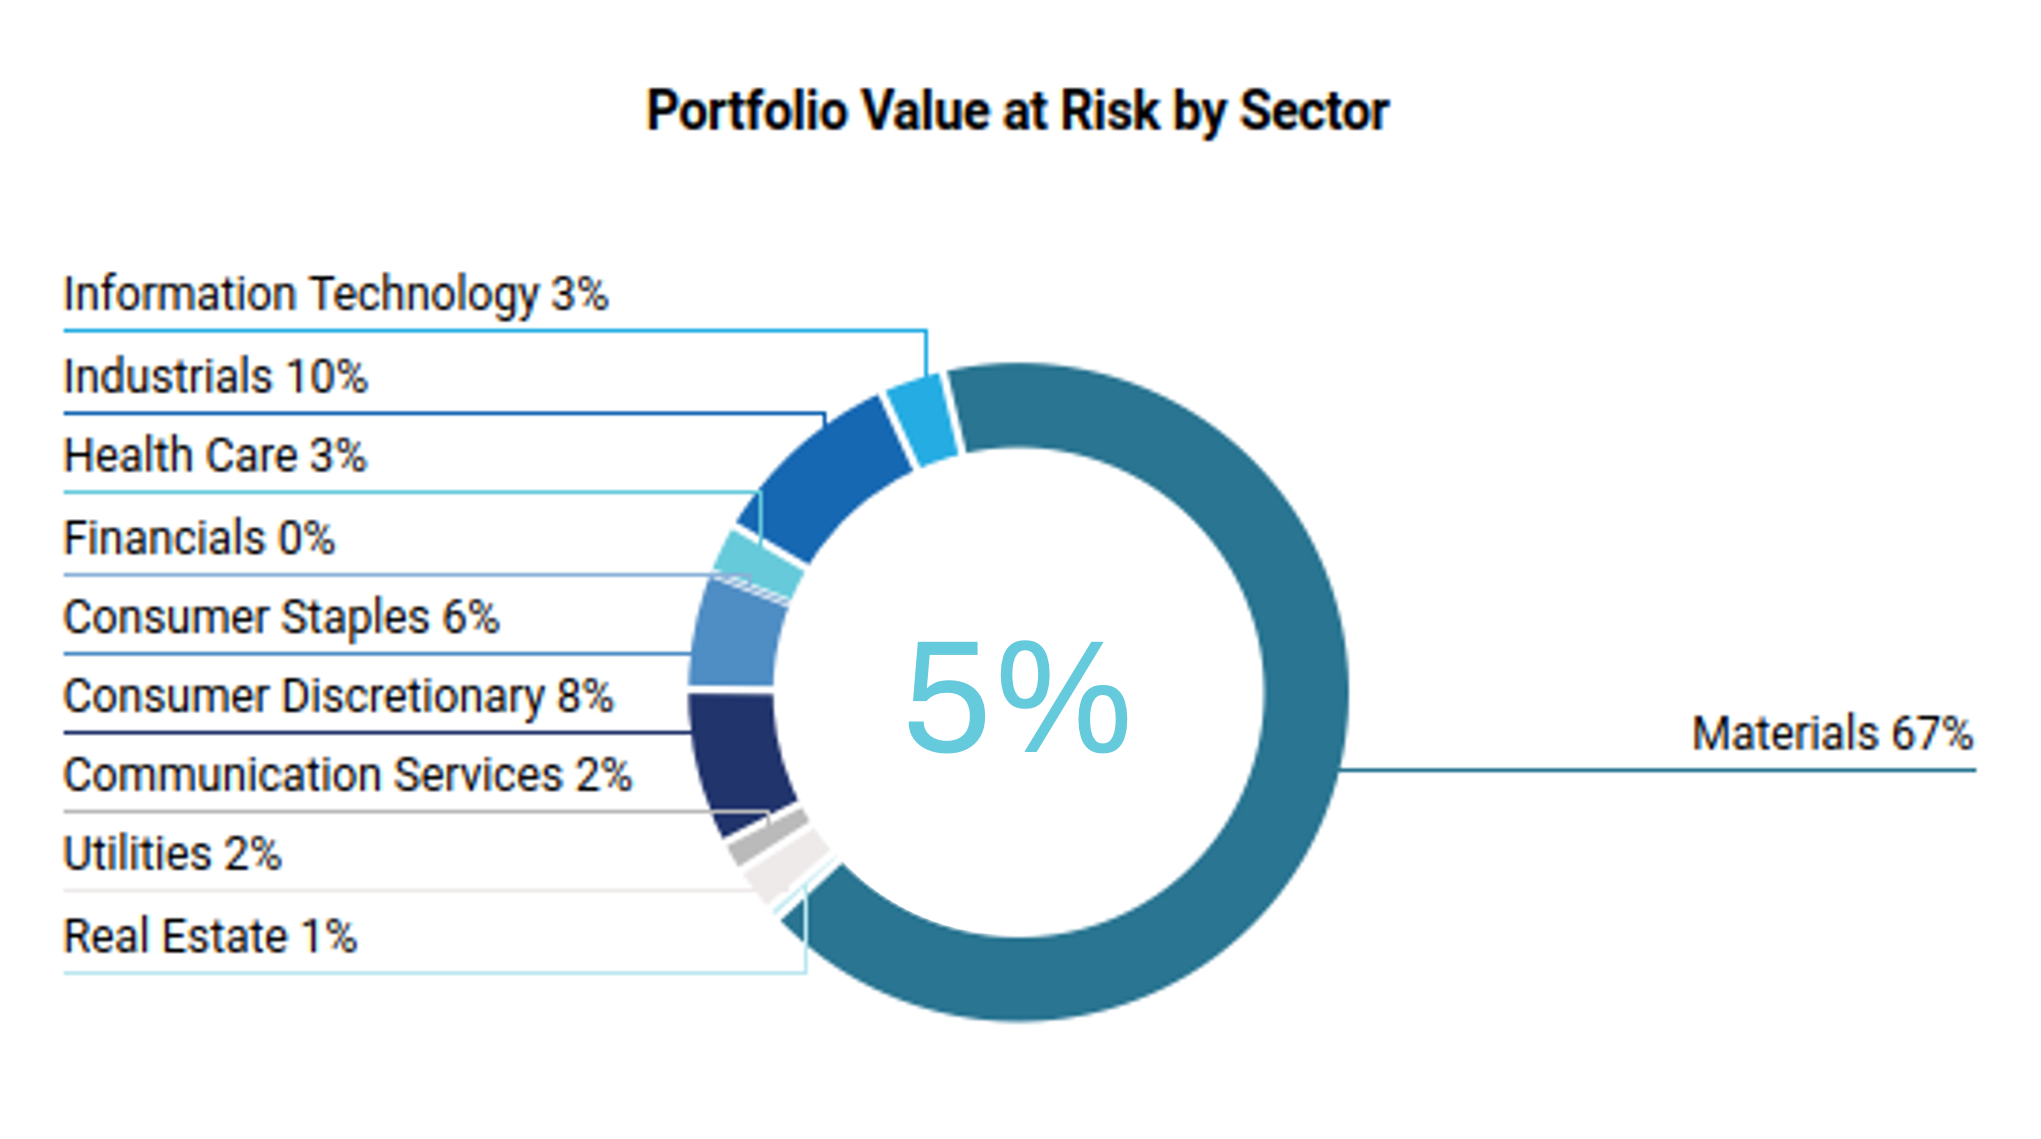
Figure 6 – Portfolio Transition Value at Risk by Sector Based on NZE2050 scenario.
As expected, the most exposed to this risk are in the materials sector. Despite this, these issuers are associated with a positive carbon risk rating. This synthetic measure evaluates an issuer’s capacity to manage climate risk and seize opportunities.
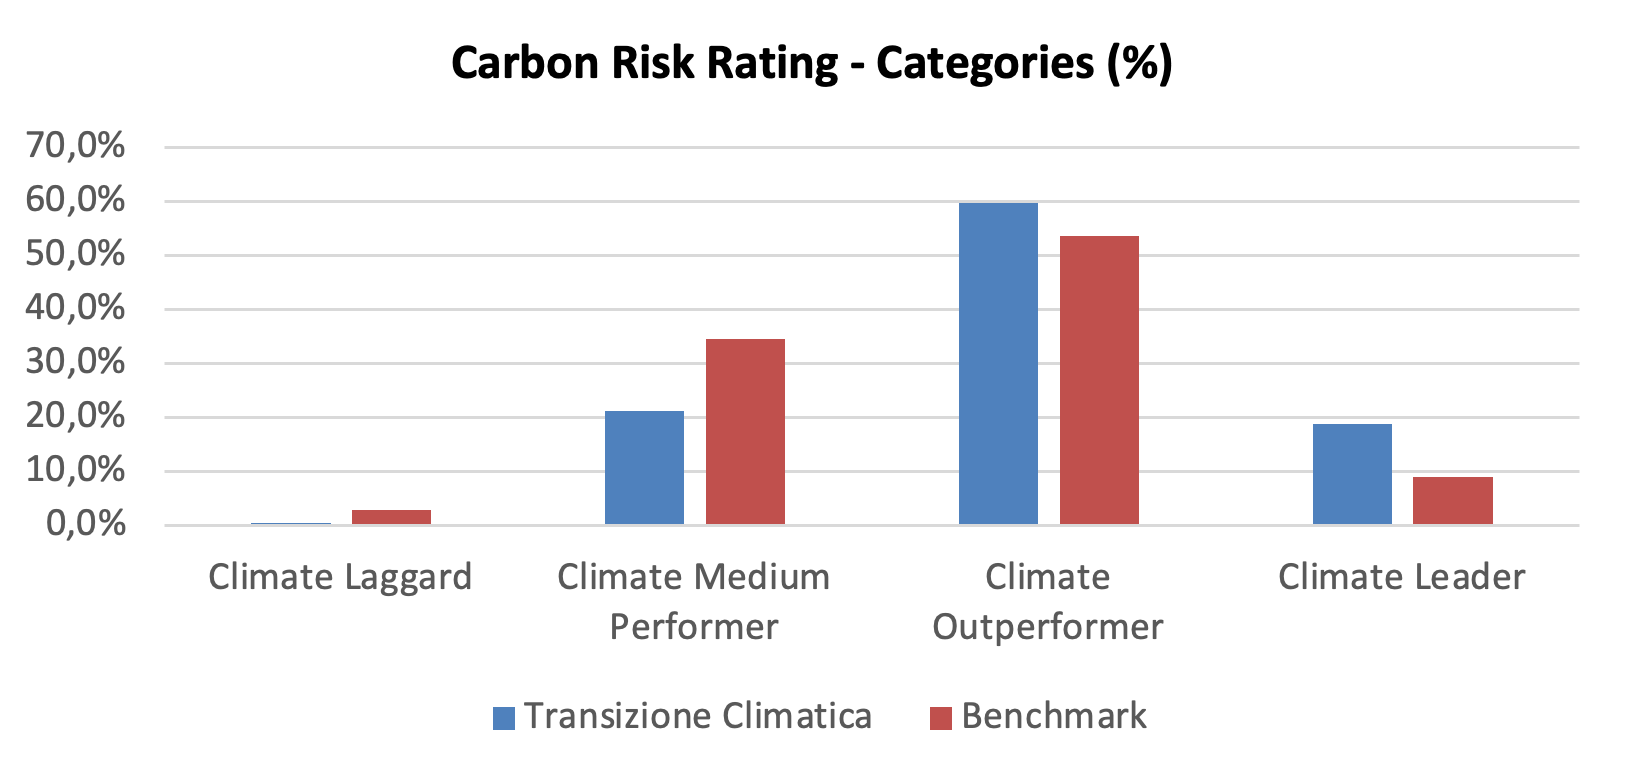
The portfolio’s performance exceeds that of the benchmark, with a greater proportion of issuers classified as ‘outperformers’ or ‘leaders’. This demonstrates the invested companies’ robust management of climate-related risks and opportunities.
Unconventional and controversial energy extraction, such as fracking and Arctic drilling, is a key focus for investors from both a transition and a reputation risk perspective.
Etica Transizione Climatica has no direct exposure to such activities.
The transitional climate risks analysis dives also into the power generation mix of the portfolio.
Of the overall power generation installed capacity by companies in the portfolio, over 81% comes from renewables, against almost 18.31% from thermal power. This is a significant improvement on last year’s figure of 73%. This increase was due to issuers increasing their renewable energy output by 19,634 GWh compared to last year’s analysis, and to financial consideration to invest in EDP SA, which generates 85% of energy from renewable sources.
In addition, the portfolio also outperformed the benchmark, with the share of renewable energy capacity at around 25% and the share of thermal capacity at 50%.
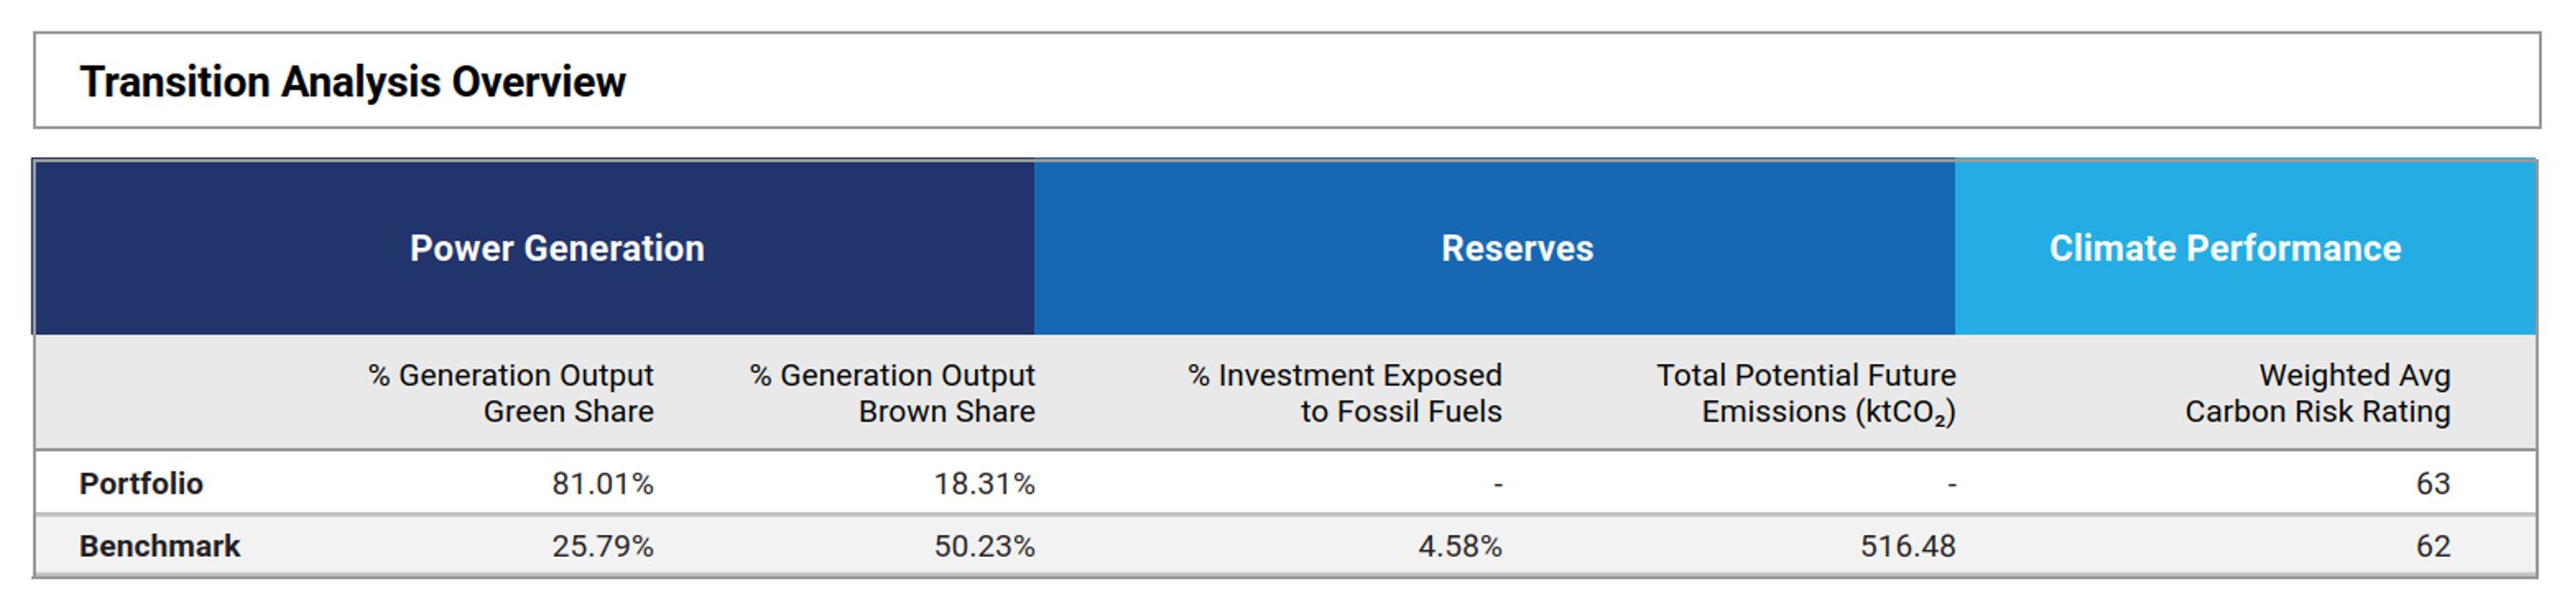
Figure 7 – Transitional climate risk analysis on Etica Transizione Climatica portfolio as of 31.12.2024.
Only five companies are involved in fossil fuels: A2A, EDP (New), Hera, Ørsted[6] and SSE Plc.
The four stable companies in the portfolio have reduced their thermal production by approximately 23.7%. Furthermore, these companies produced 48,918.5 GWh of renewable electricity, accounting for 33% of the portfolio’s renewable capacity. They therefore play a critical role in the energy transition.
Moreover, as shown in the table below, the emission intensity of these five companies is significantly lower than that of their peers.
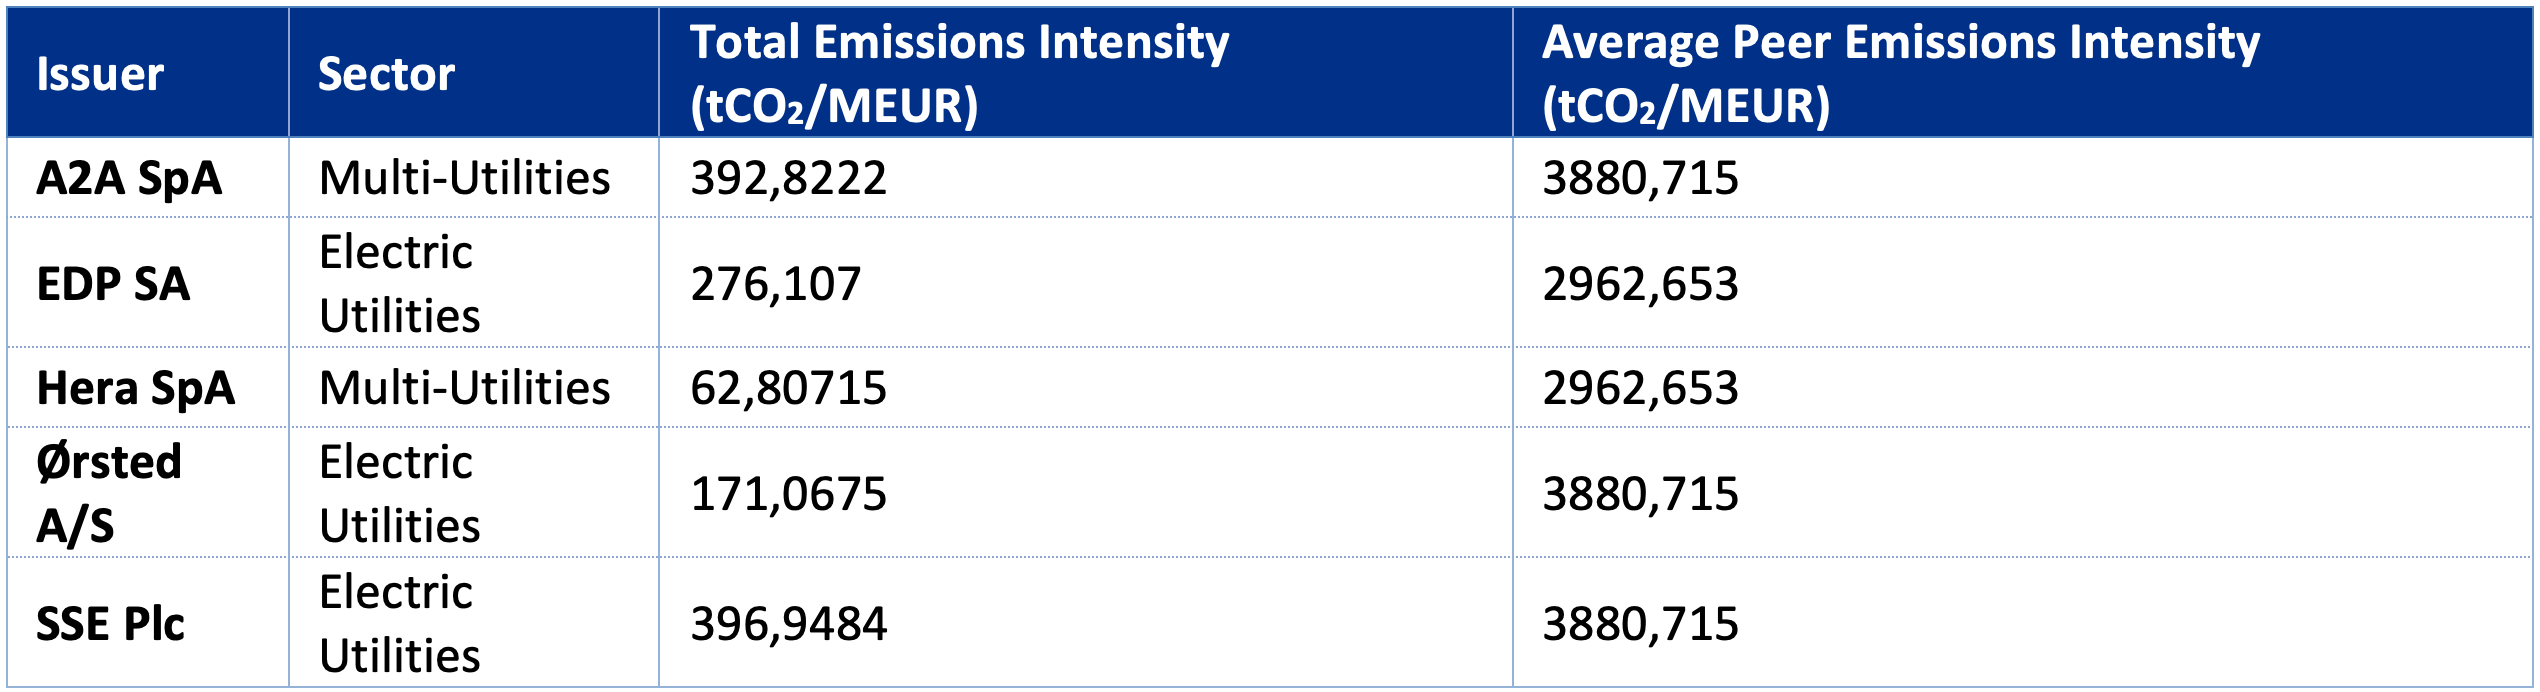
To highlight their important role in the transition, some of these utilities have also issued green bonds that contribute to the energy transition and environmental protection. These bonds represent 30% of the corporate green bonds in our portfolio at the end of 2024.
Finally, note that the portfolio’s current energy generation mix exhibits a higher proportion of renewables than the International Energy Agency’s Sustainable Development Scenario 2030, which anticipates 53% renewables by 2030 and 84% by 2050. Etica Transizione Climatica is also very close to achieving the 2050 target.
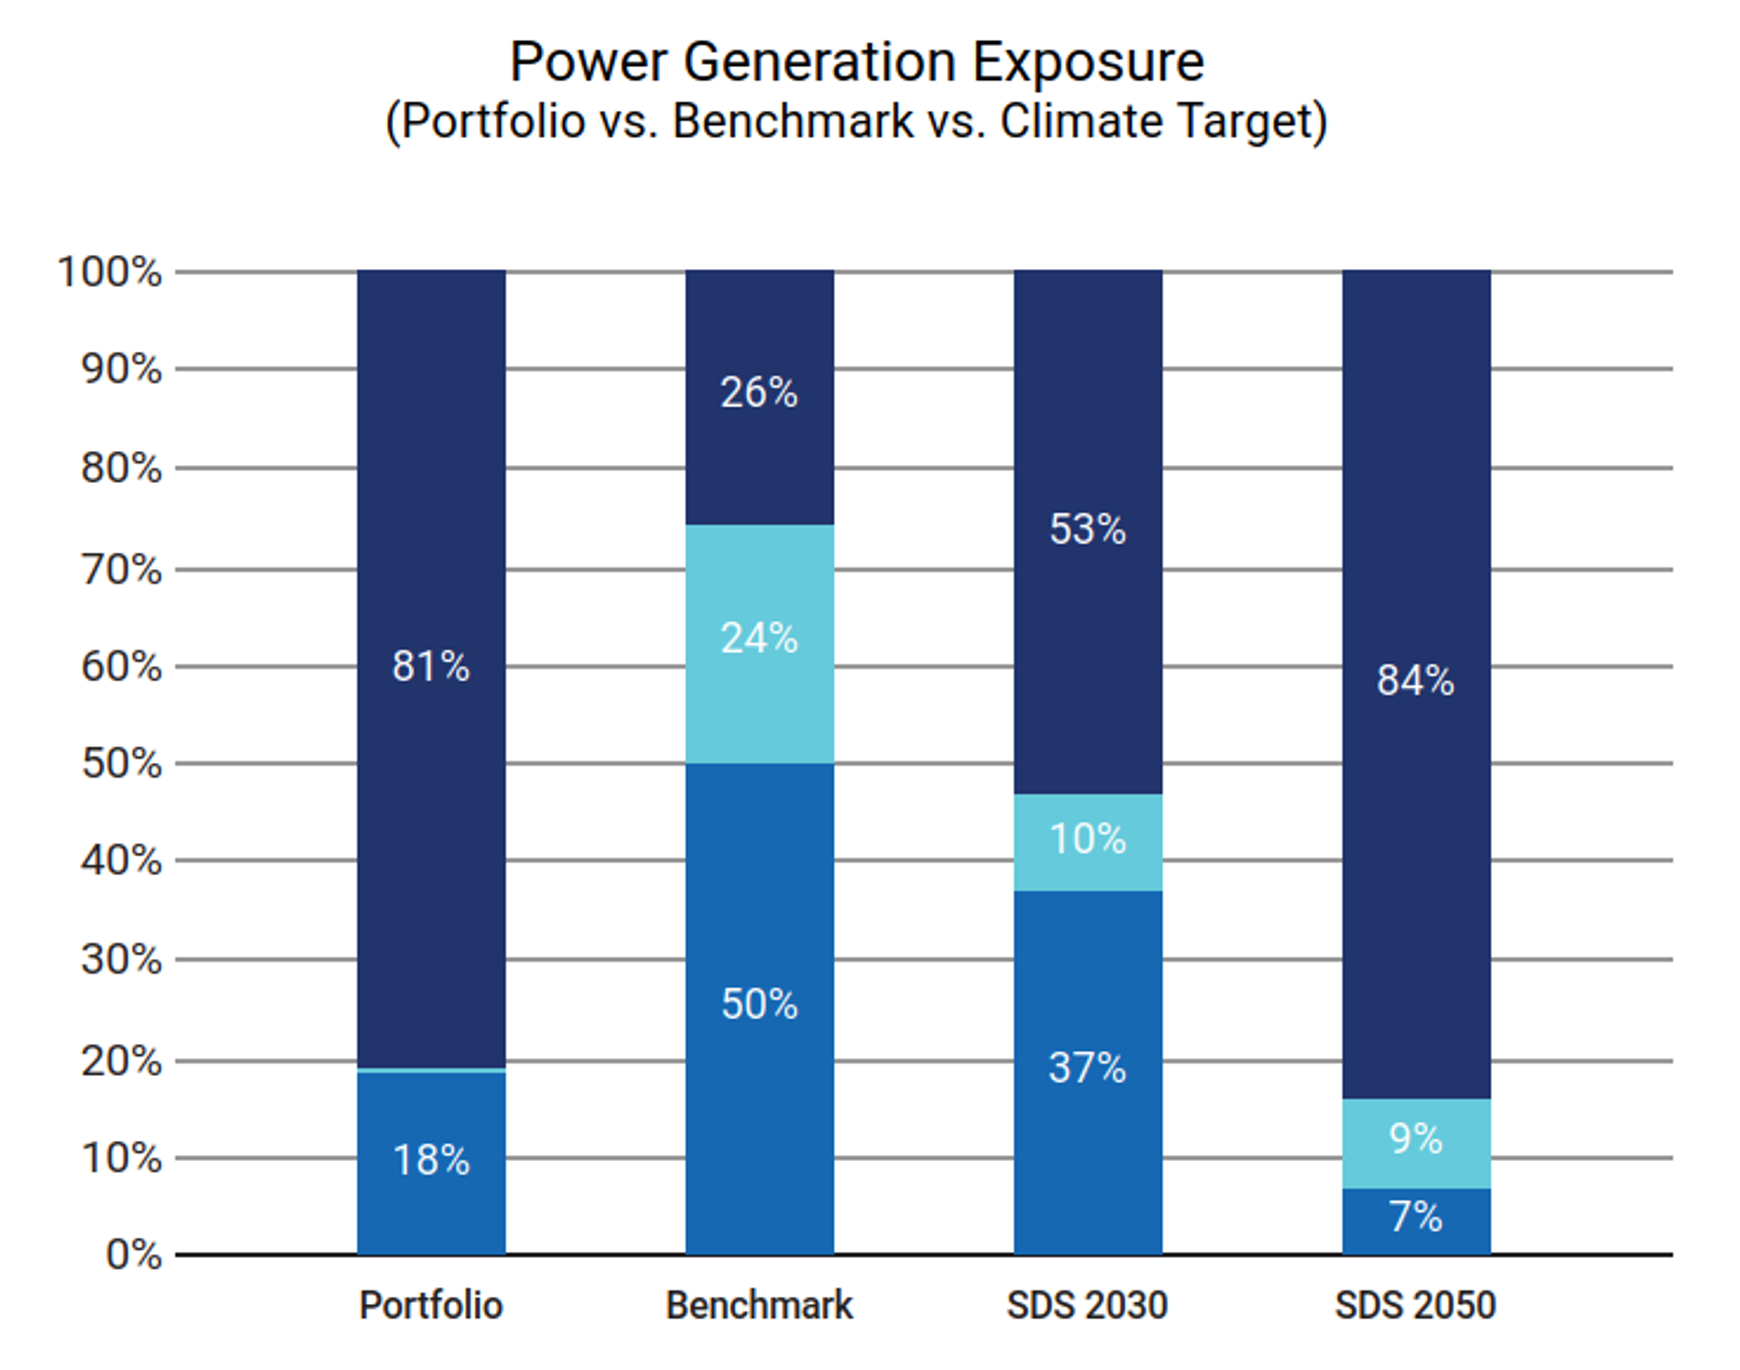
Figure 8 – Power Generation Exposure. Renewable energy is indicated by dark blue, while sky blue represents nuclear power and mid blue is for fossil fuels.
Physical risks
Even if the temperature increase is limited to 2°C, the climate system will change. This will include an increase in physical risks, such as floods, droughts and storms. This analysis evaluates the climate hazards that will have the greatest financial impact, considering how they might affect portfolio value[7].
In this scenario, the portfolio value at risk by 2050 is estimated to be 5.9 EUR million, with the Consumer Discretionary, Consumer Staples and Information technology being the most exposed ones. This represents a 0.7% loss in the overall fund value. The value at risk rises to over 9.13 EUR million if a worst-case scenario is employed, assuming a temperature increase over 3.2°C.
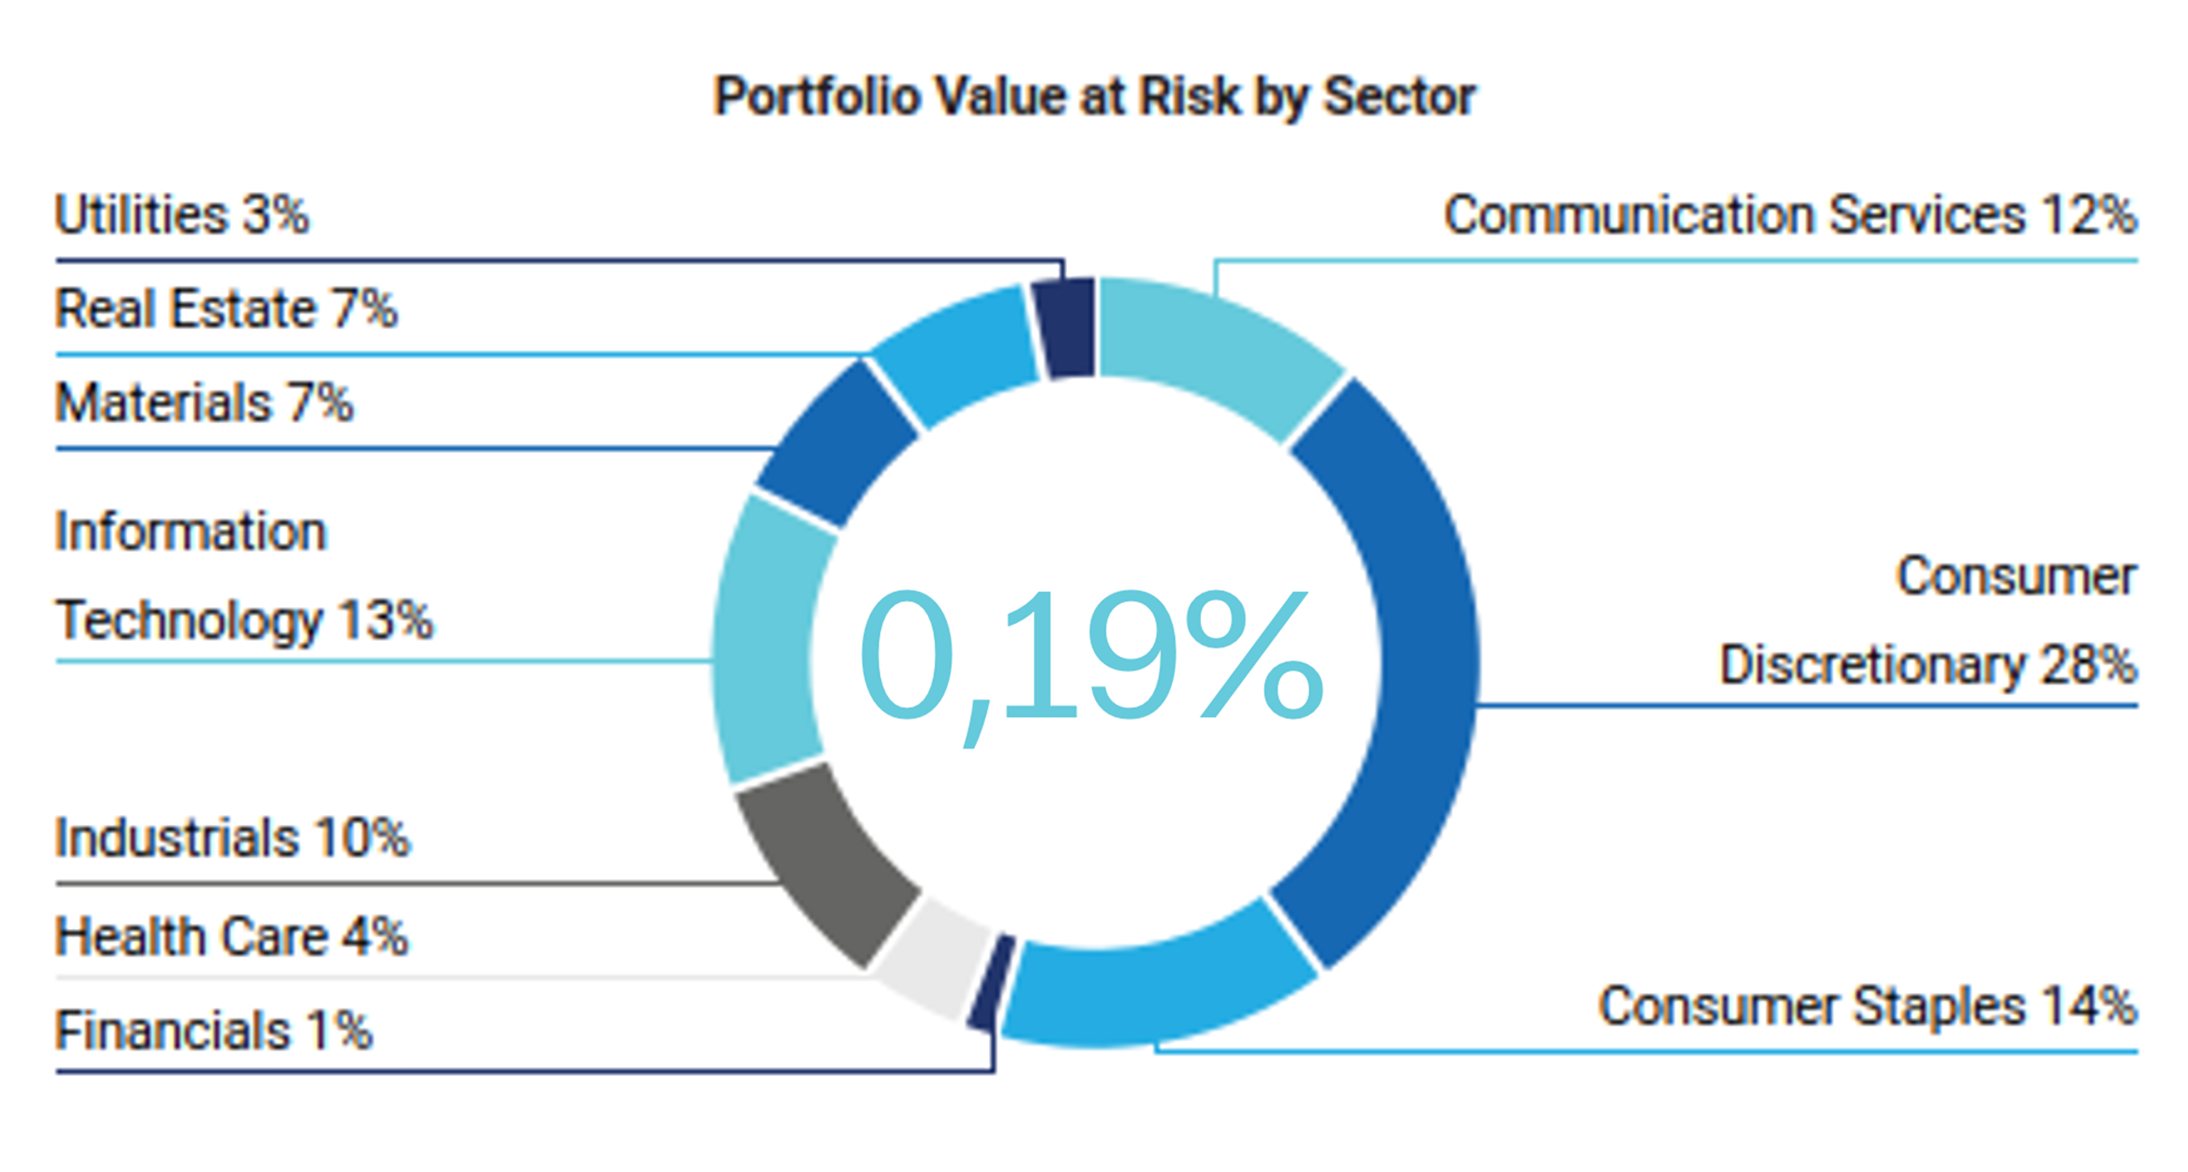
Figure 9 – Physical Risk Analysis, ETC value at risk.
However, based on the ISS assessment, only 7% of issuers have a weak physical risk management strategy and 55% have a robust strategy.
Note that only 7% of Etica’s companies are not covered, compared to 29% of the benchmark.
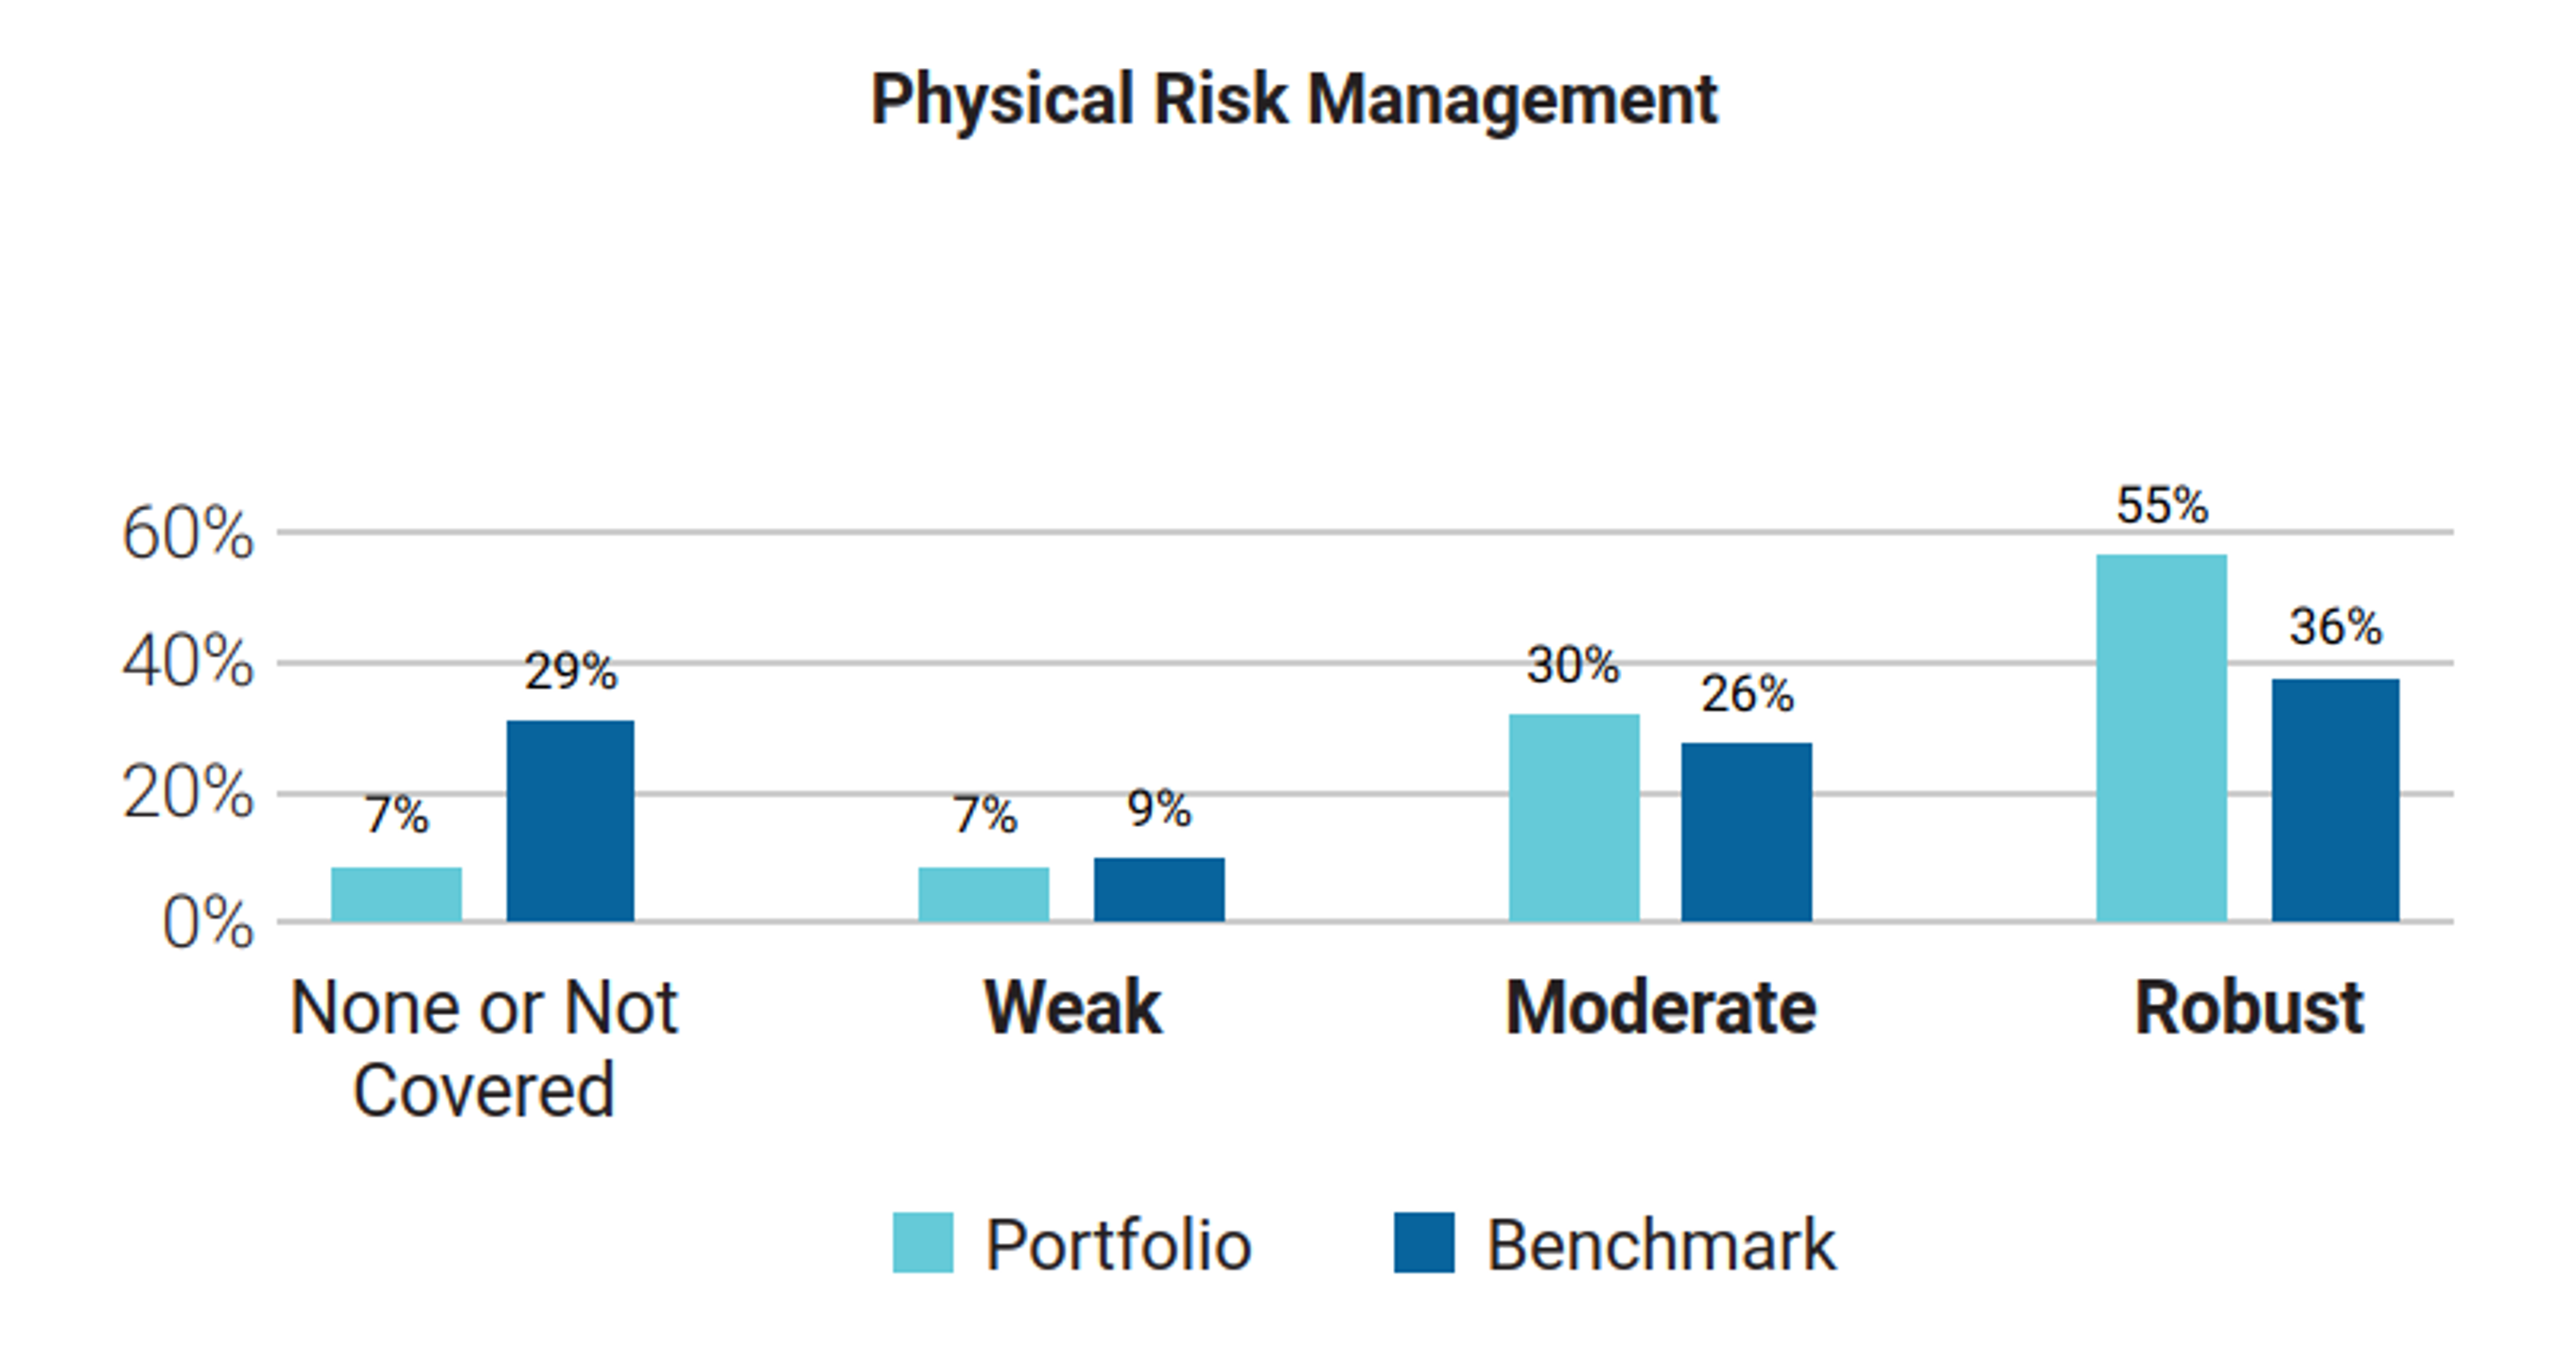
Figure 10 – Physical Risk Analysis, risk management portfolio vs benchmark.
Additional insights
- 1 – Comparison of results of Etica Transizione Climatica with Valori Responsabili portfolio
In December 2021, Etica adopted a stricter selection policy for companies involved in fossil fuels activities, including natural gas. In September 2022, the selection policy was further developed to include a specific climate impact assessment of companies involved in any fossil-related activities and those operating in Utilities, Materials and Industrial sectors with high emission intensity. The assessment is slightly different between Valori Responsabili and Etica Transizione Climatica, as a higher standard is set for Etica Transizione Climatica.
Nevertheless, the carbon intensity of the two funds is essentially the same.
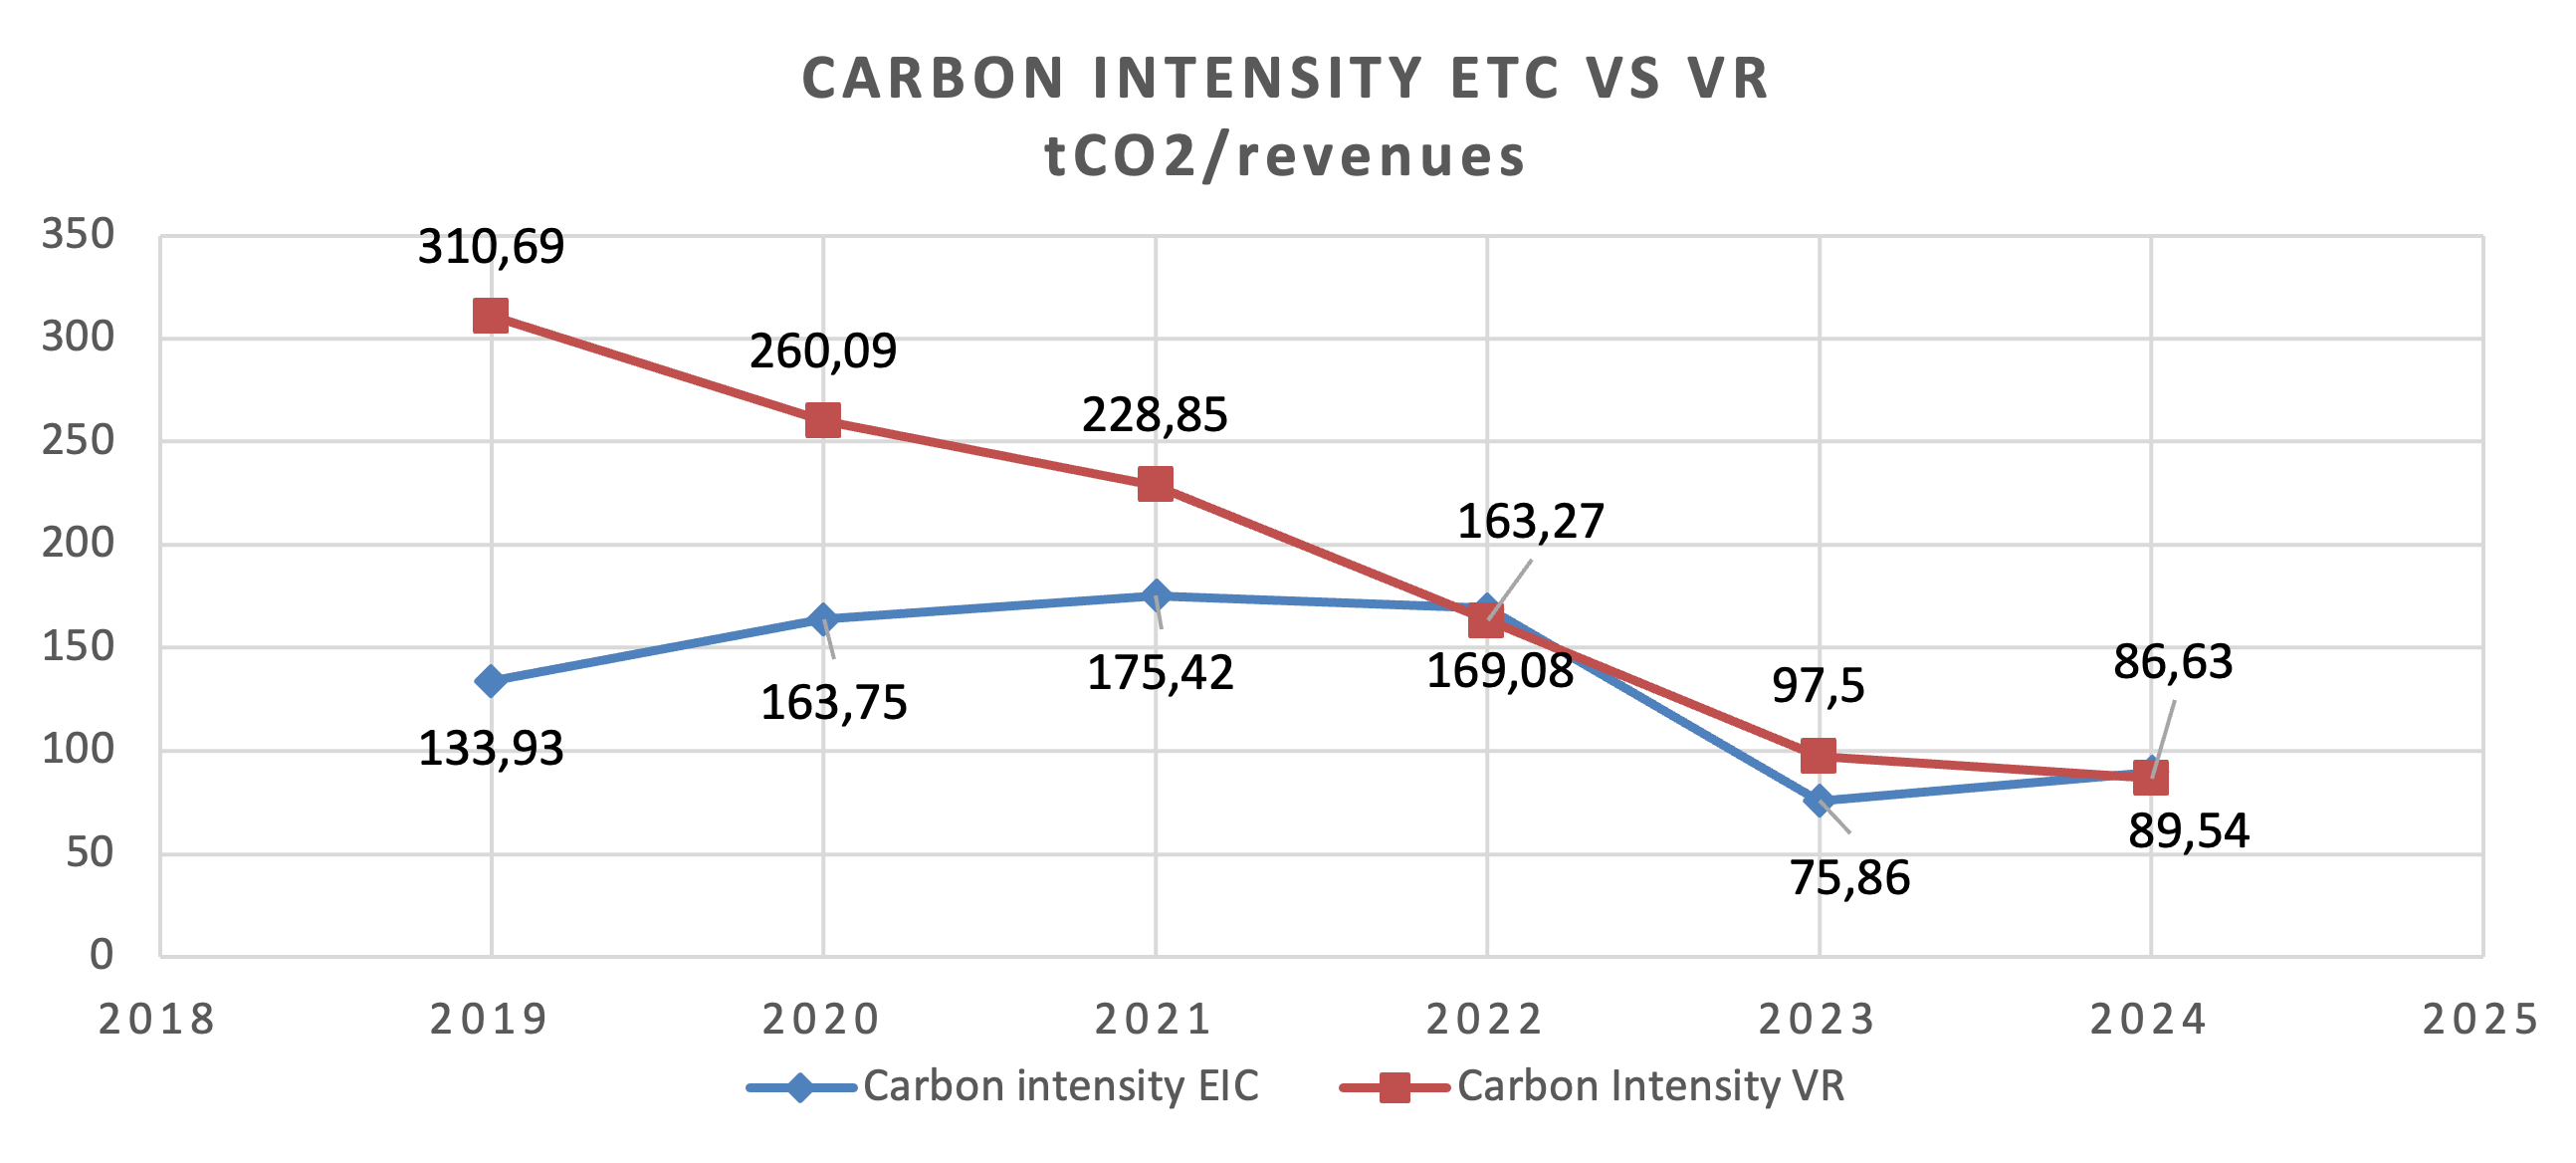
The reason for this lies in financial considerations that result in a different sector’s weight allocation, particularly in the IT sector. The IT sector is significantly underweighted in the ETC portfolio compared to the VR portfolio. Furthermore, the Materials sector has a greater weight.
- 2 – New scenario analysis including scope 3 emissions
Starting from this year, the ISS has provided updated net zero scenarios from the IEA that replace the SDS and include scope 3 emissions.
The net zero scenario comprises three ways of projecting emissions up to 2030 and 2050.
- Historical projections: the results of the issuer’s alignment or divergence versus the allocated carbon budget, projecting historical emissions.
- Target projections: the results of the issuer’s alignment or divergence versus the allocated carbon budget, projecting potential emissions based on the issuer’s target. If there is no target, the issuer is associated with the relative benchmark projection.
- Benchmark projections: the results of the issuer’s alignment or divergence versus the allocated carbon budget, projecting the potential emissions associated with each sector.
Below are the results of the first analysis.
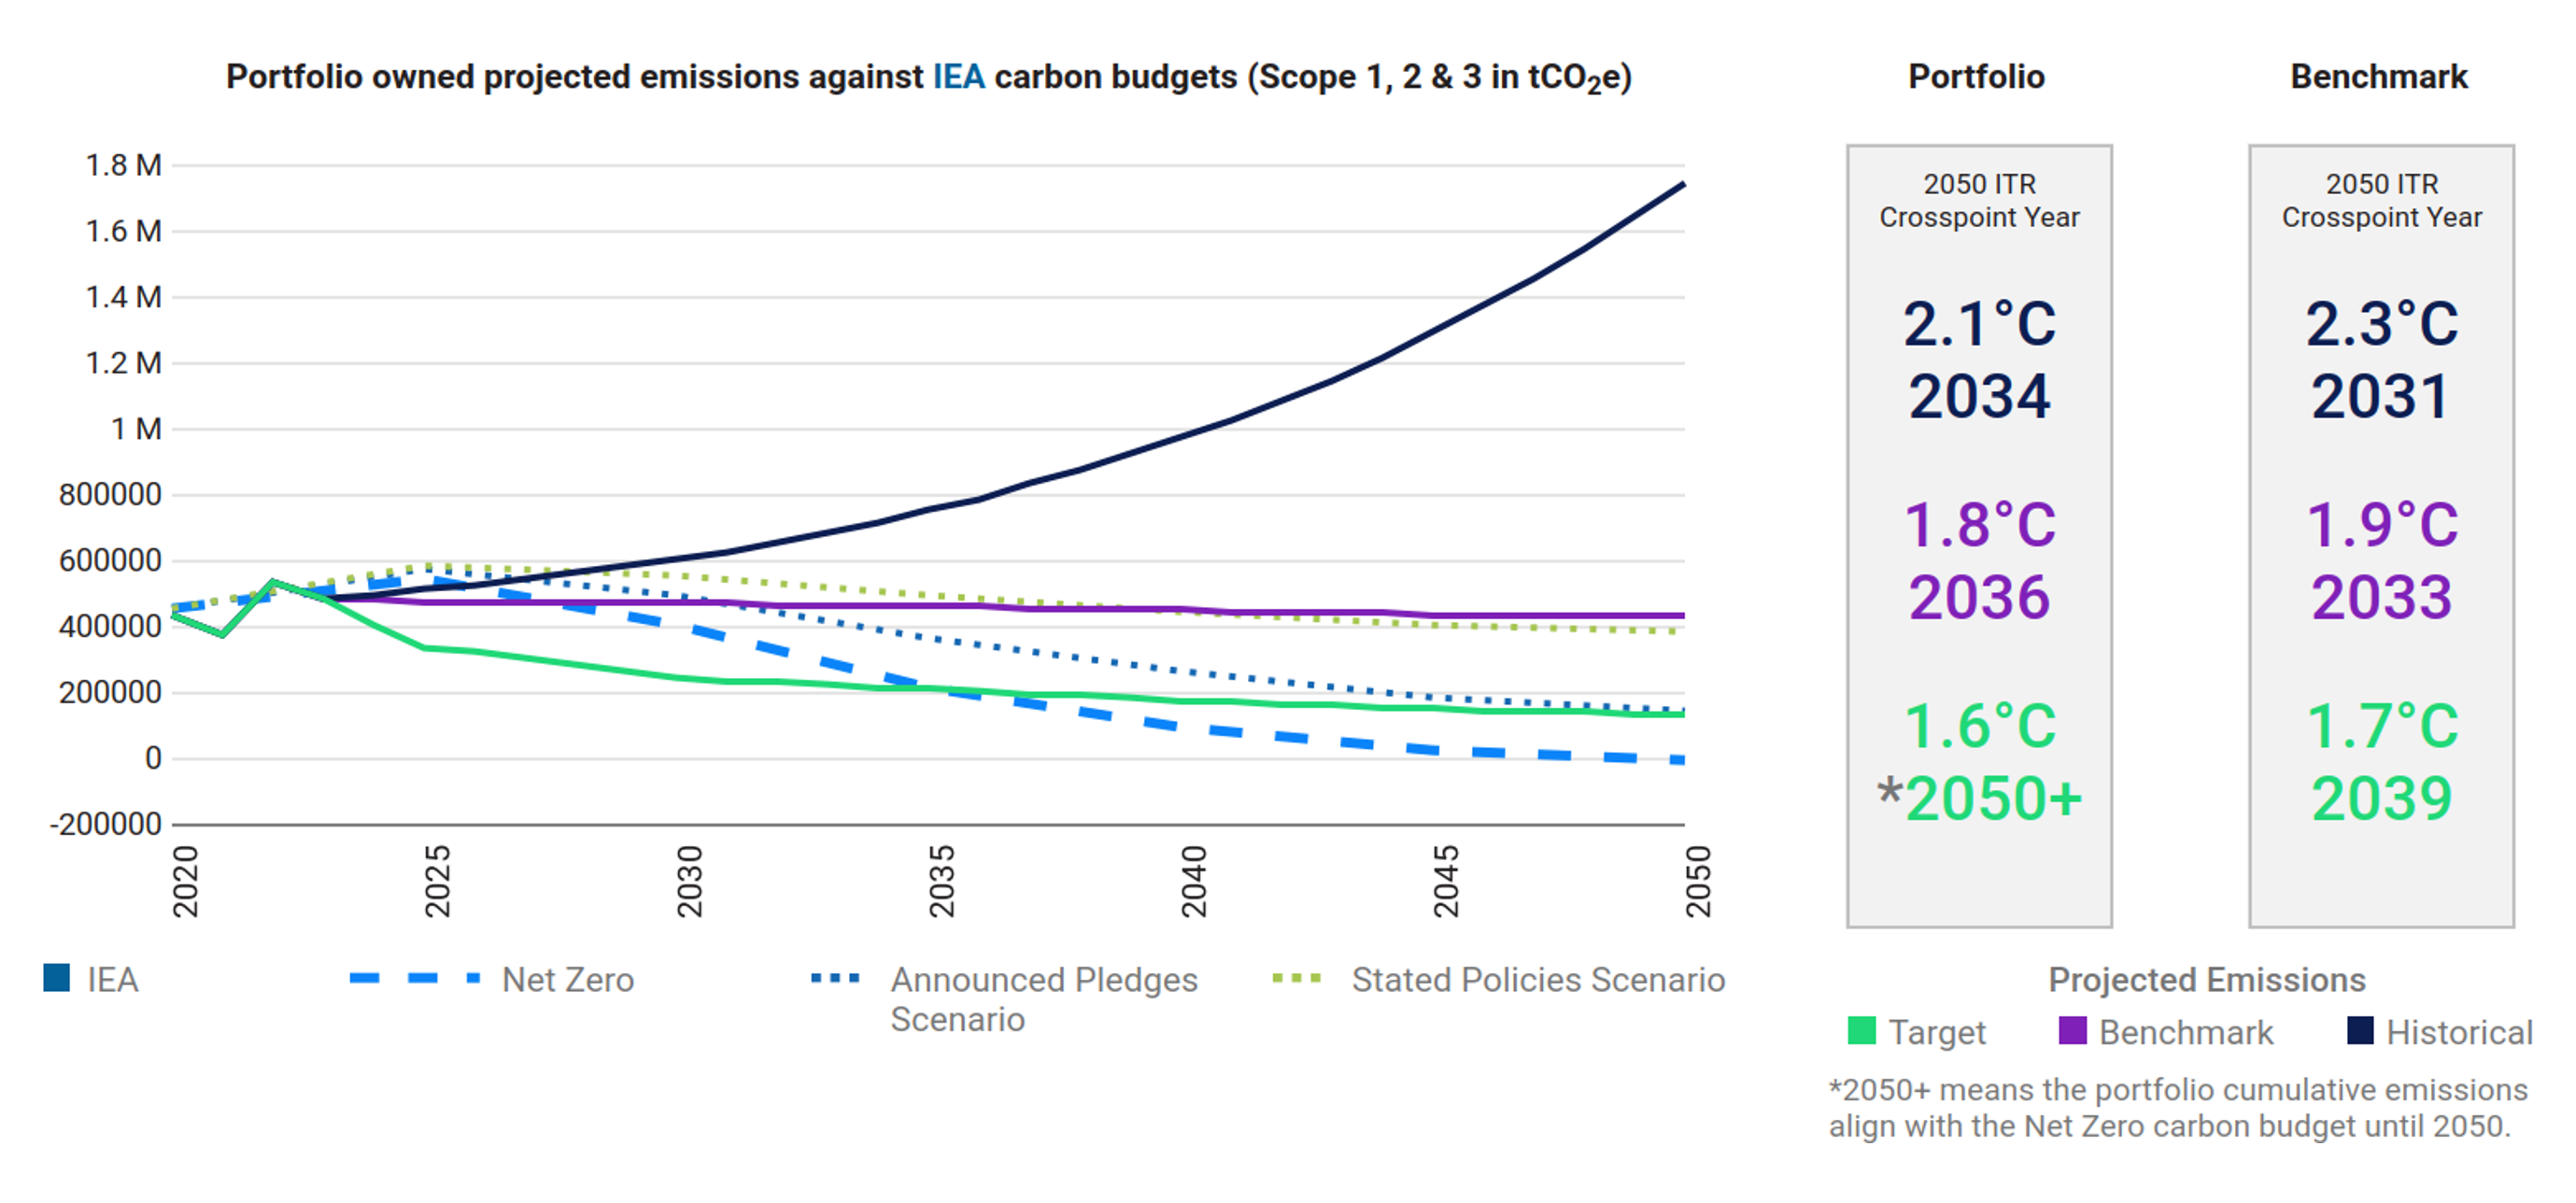
Figure 11 – IEA updated scenario analysis including scope 3 emissions.
The results are good overall, especially since the climate assessment in the Scenario Pillar currently doesn’t incorporate scope 3 emissions. Scope 3 emissions are only evaluated in the Target Pillar.
This is reflected in the scenario assessment above, which shows that the target projections are associated with a net-zero scenario.
The projected historical emissions are associated with an increase of 2.1°C. While this is not a fully satisfactory result, it should be noted that Scope 3 emissions are, by definition, beyond the control of companies, and being very close to the 2°C target of the Paris Agreement is a good achievement.
However, the portfolio continues to perform better than the benchmark under all three projections.
Conclusions
The portfolio shows positive results in terms of carbon metrics, performing better than the benchmark. Despite worse performance compared to last year, there has been a significant reduction in emissions compared to 2019:
- 58% reduction of carbon footprint;
- 33% reduction of carbon intensity;
- 27% reduction of WACI.
Furthermore, the fund continues to be aligned to a potential temperature increase of 1.5°C, with an overshoot in the carbon budget observed only in the conventional electricity subsector.
From a transitional perspective, the role of this fund is clear: over 81% of the overall power generation installed capacity of companies in the portfolio comes from renewables. This is a significant improvement on last year’s figure, and also very close to the IEA’s 2050 power generation exposure scenario.
The fund has also invested in green bonds issued by the utilities sector, highlighting its contribution to the transition.
Finally, transitional and physical risk remain very low, with robust risk management by companies.
Sovereign bonds
This Sovereign analysis compares the carbon emissions and other carbon related characteristics of the underlying portfolio with the benchmark. The tables below include absolute and relative figures for portfolio carbon emissions as well as intensity measures for both production and government emissions.
“Emission Exposure” section measures the carbon footprint of a sovereign portfolio. Scope 1 Emissions are in tCO₂e while Scope 2 and Scope 3 Emissions are only in CO2 Emissions.
Relative carbon footprint is defined as the total carbon emissions of the portfolio per million invested.
Carbon intensity is expressed as the weighted average carbon emissions per million of PPP adj GDP as a proxy of the carbon efficiency per unit of output.
To account for the different calculation possibilities as well as to offer various perspectives, ISS ESG provides data for the following two different sovereign emission categories:
- Production Emissions: Emission footprint of a country’s production with its imports according to the latest PCAF guidelines released in December 2022.
- Government Emissions: This approach takes into account that a government bond co-finances both direct emissions from the public sector and investments made by the government. This approach is no longer recommended by PCAF. However, ISS will still provide in the time being government emissions.
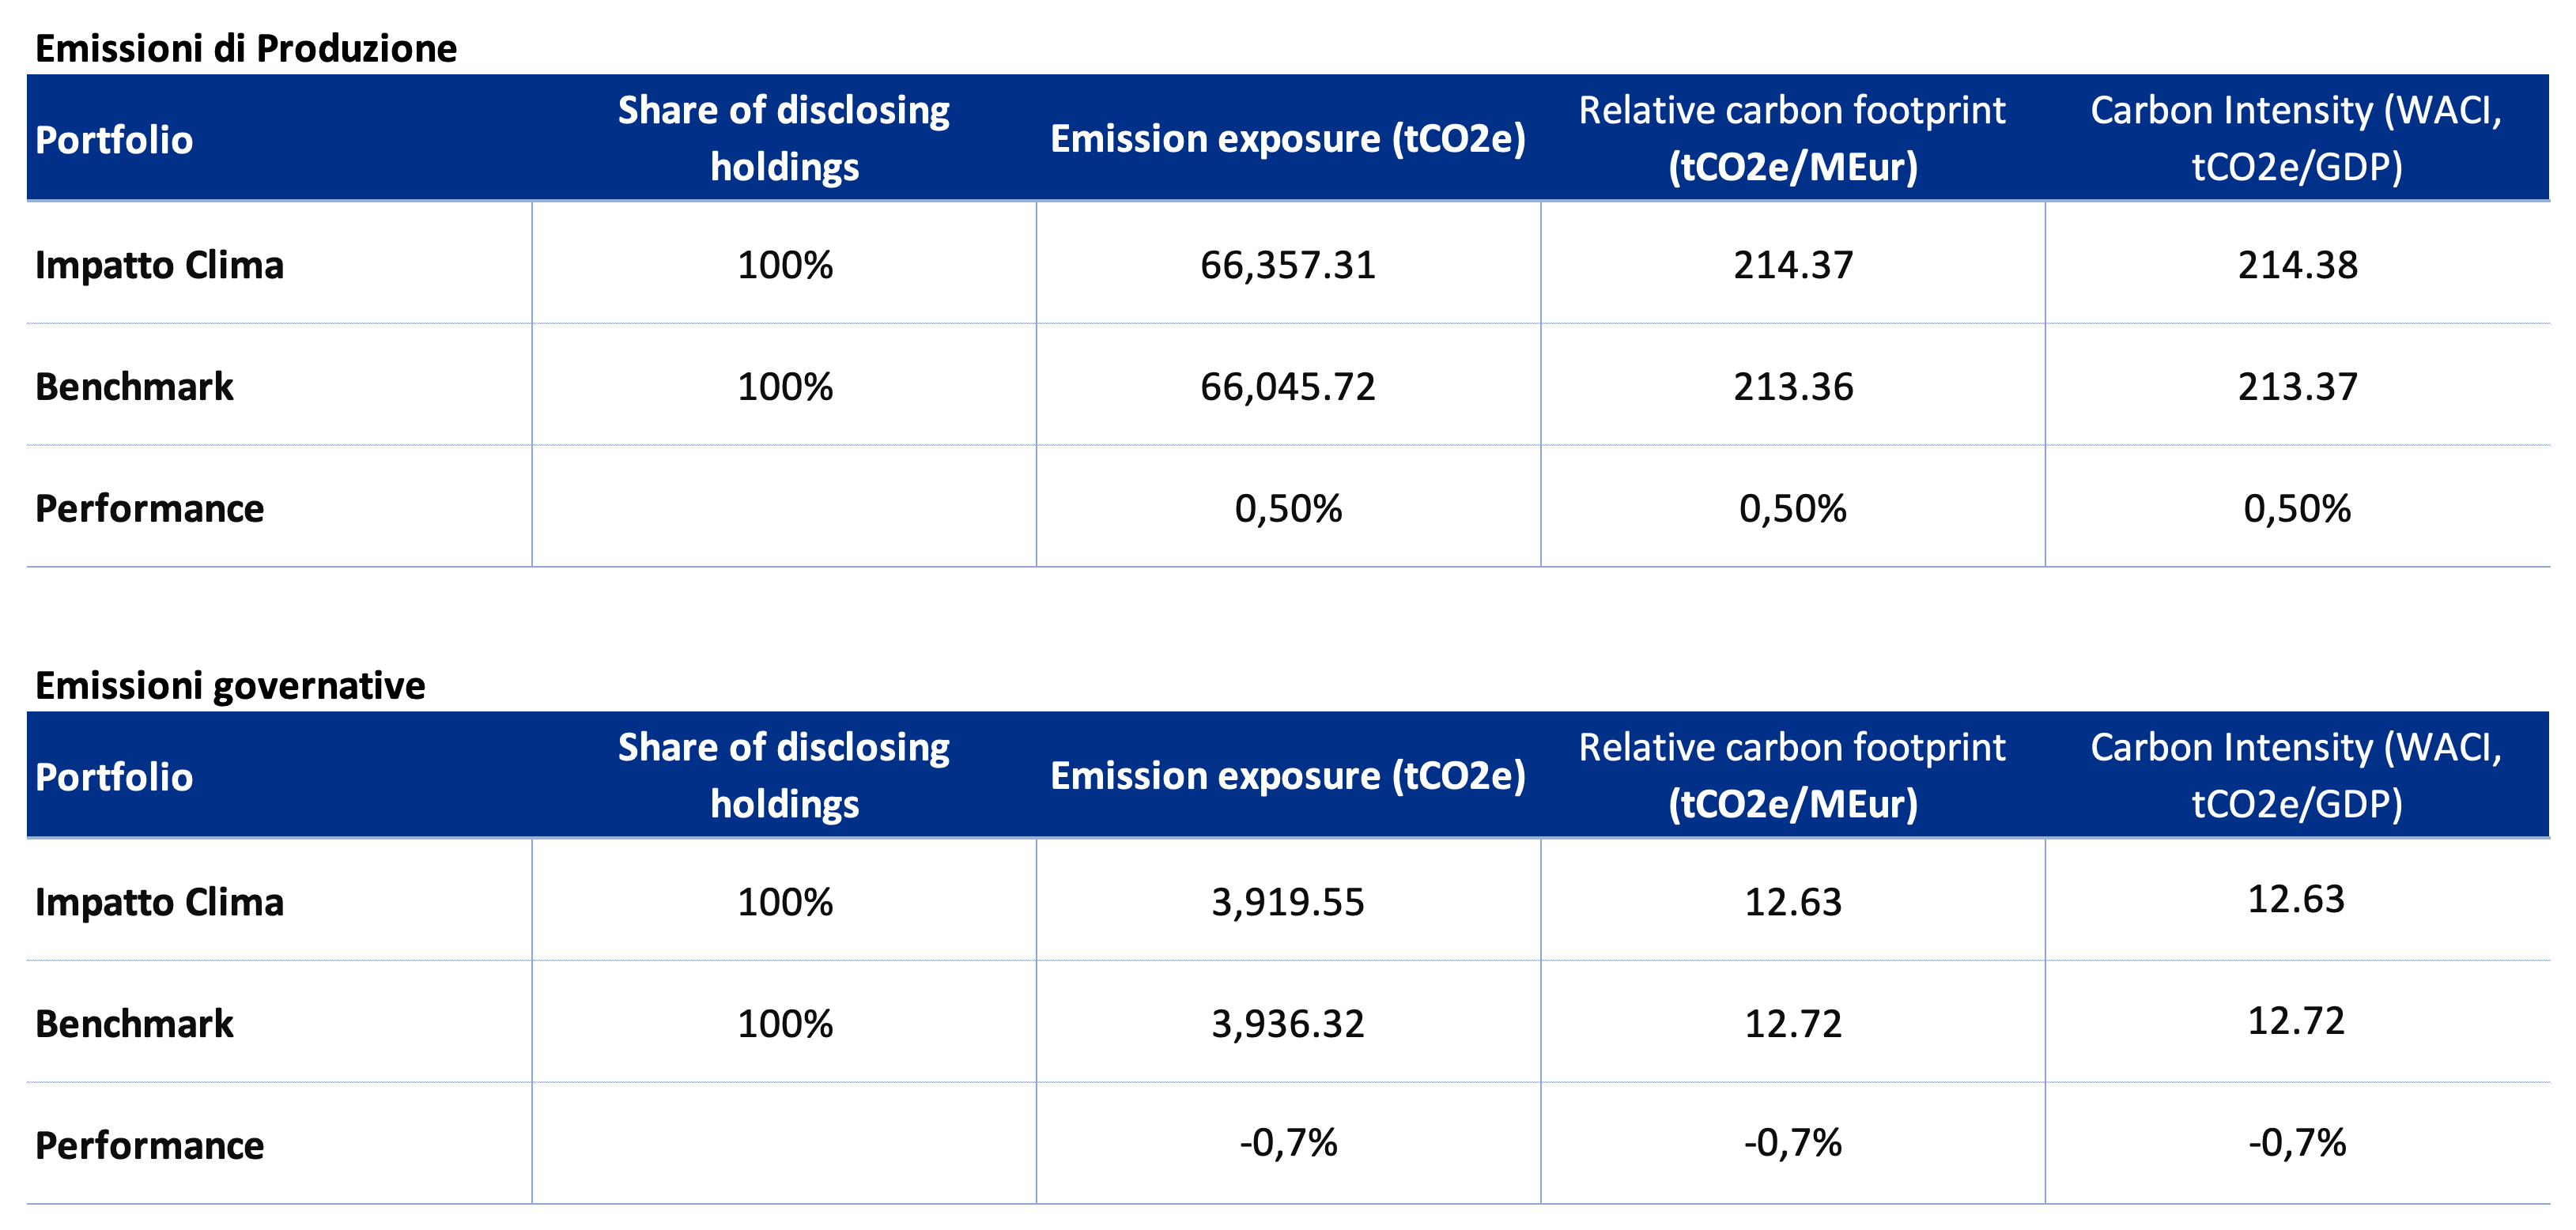
In general, the fund’s performance is in line with the benchmark and last year’s analysis.
This is because the composition of the sovereign portfolio has not changed significantly and remains in line with the benchmark composition and last year’s portfolio.
Please note that the methodology does not currently account for any strong climate selection for the sovereign issuer.
Furthermore, this analysis does not consider the type of bond but only assesses the climate performance of individual countries.
The type of bond consideration could be an area for improvement in the 2026 analysis.
Climate Impact in Brief
Reference
[1] https://www.issgovernance.com/esg/
[2] Launched after the 2015 Paris Agreement by the Financial Stability Board (FSB), the Task Force on Climate-related Financial Disclosure (TCFD – https://www.fsb-tcfd.org/) considers climate transparency as a crucial factor for the stability of financial markets. The objective of the TCFD is therefore to improve climate transparency in financial markets through recommendations on disclosure. These recommendations provide a “consistent framework that improves the ease of both producing and using climate-related financial disclosures”. The TCFD aims to create a unique standard for both corporate and investment disclosure, understanding that local regulatory frameworks may require different compliance levels. By October 12, 2023, the TCFD had fulfilled its mission and disbanded, although it remains a valid guideline for assessing and reporting on climate-related risks.
[3] The Sustainable Development Scenario is not more developed in the World Energy Outlook 2022 by the International Energy Agency. However, to guarantee comparability with previous years, this edition of the report still relies on it.
[4] Details on the scenarios and on underlying assumptions are available at World Energy Model – Analysis – IEA
[5] Etica does not invest in companies in the following BICS sectors: Oil Exploration & Production, Integrated Oils, Oil & Gas Services & Equipment, Oil, Gas & Coal, Pipeline, Mining Services, Precious Metal Mining, Coal Operations and Other.
[6] We only have green bonds issued by Ørsted, meaning we finance only the company’s green energy production.
[7] ISS employs a model to estimate potential value losses arising from changes in share price due to physical climate risks by 2050, computing the Value at Risk (VaR) of each issuer.
This is a marketing communication.
Marketing communication by Etica SGR S.p.A. Investors should only make an investment decision after fully understanding the overall characteristics and level of risk exposure involved, by carefully reading the KID and the Prospectus of the individual funds. These documents – along with information on sustainability aspects pursuant to Regulation (EU) 2019/2088 – are available on the website www.eticasgr.com. The recipients of this message bear full and sole responsibility for the use of the information contained in this communication, as well as for any investment decisions possibly made on the basis of it, since any use of this information as a support for investment decisions is not permitted and is entirely at the investor’s own risk.

 – SICAV")
 – Valori Responsabili")