
This document is a commented summary of the Climate Impact Report released by the company ISS ESG[1] based on its proprietary methodology, concerning the holdings of Etica Sgr’s Fund Etica Valori Responsabili (also referred to as “the portfolio”). The report includes metrics aligned with the guidelines of the Task Force on Climate-related Financial Disclosures (TCFD[2]).
All asset classes have been analysed according to the TCFD recommendations, grouped as follows: Equity Portfolio and Corporate Bonds Portfolio together and Sovereign Bonds Portfolio.
The analysis outlines the climate performance calculated on the portfolio at the year-end of 2024 and compares it with the index MSCI World ESG Universal Net Total Return (now MSCI World Universal Net Total Return) as a market benchmark (also referred to as “the benchmark”) on the same date.
- Carbon metrics
- Comparison with Valori Responsabili portfolio y-o-y
- Scenario Analysis
- Transitional climate risks analysis
- Physical risks
- Conclusions
- Sovereign bonds
Carbon metrics
The carbon metrics used in the Equity and Corporate Bonds analysis are the following ones and are explicitly recommended by the TCFD:
- Relative Carbon Footprint: defined as the total scope 1 and scope 2 GHG emissions of the portfolio, directly attributable to the investor through its ownership share in companies’ total market value (also defined as “Emissions Exposure”), per million EUR invested. It is measured in tCO2e/EUR million invested.
- Carbon intensity: defined as the total scope 1 and 2 GHG emission intensity of the portfolio (based on issuers’ revenues), directly attributable to the investor through its ownership share in the companies’ total market value. It is measured in tCO2e/EUR million revenue.
- The Weighted Average Carbon Intensity (WACI): expresses scope 1 and 2 GHG emission intensity (based on issuers’ revenues), proportional to the issuers’ weight in the portfolio. Hence, this does not take the ownership share into account. It is measured in tCO2e/EUR million revenue.
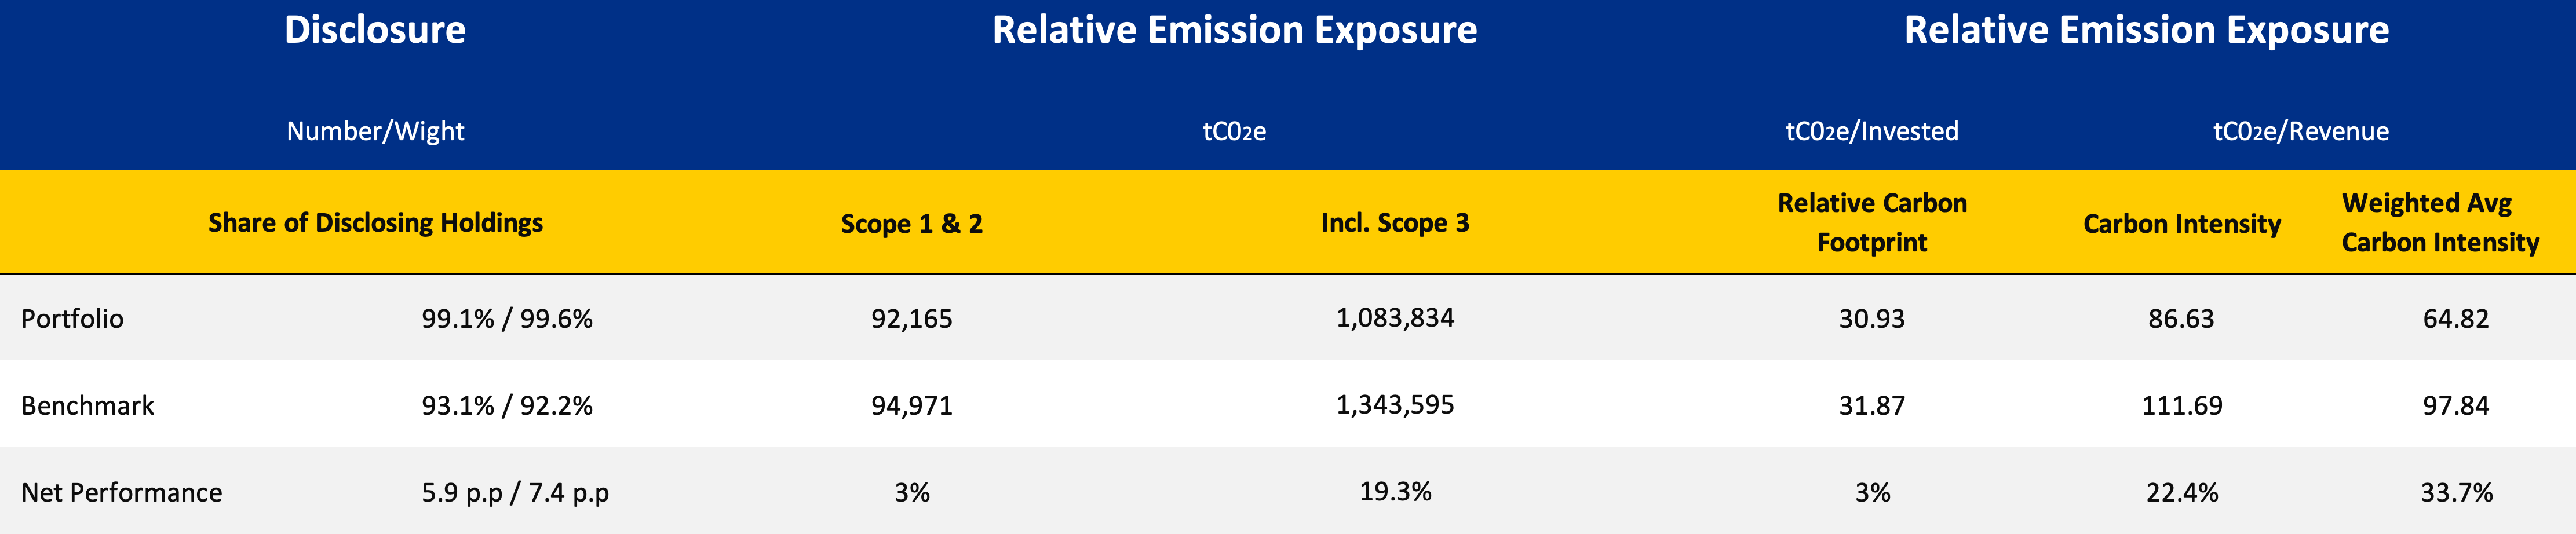
Figure 1 – Portfolio Overview, Climate Impact Assessment Valori Responsabili end 2024.
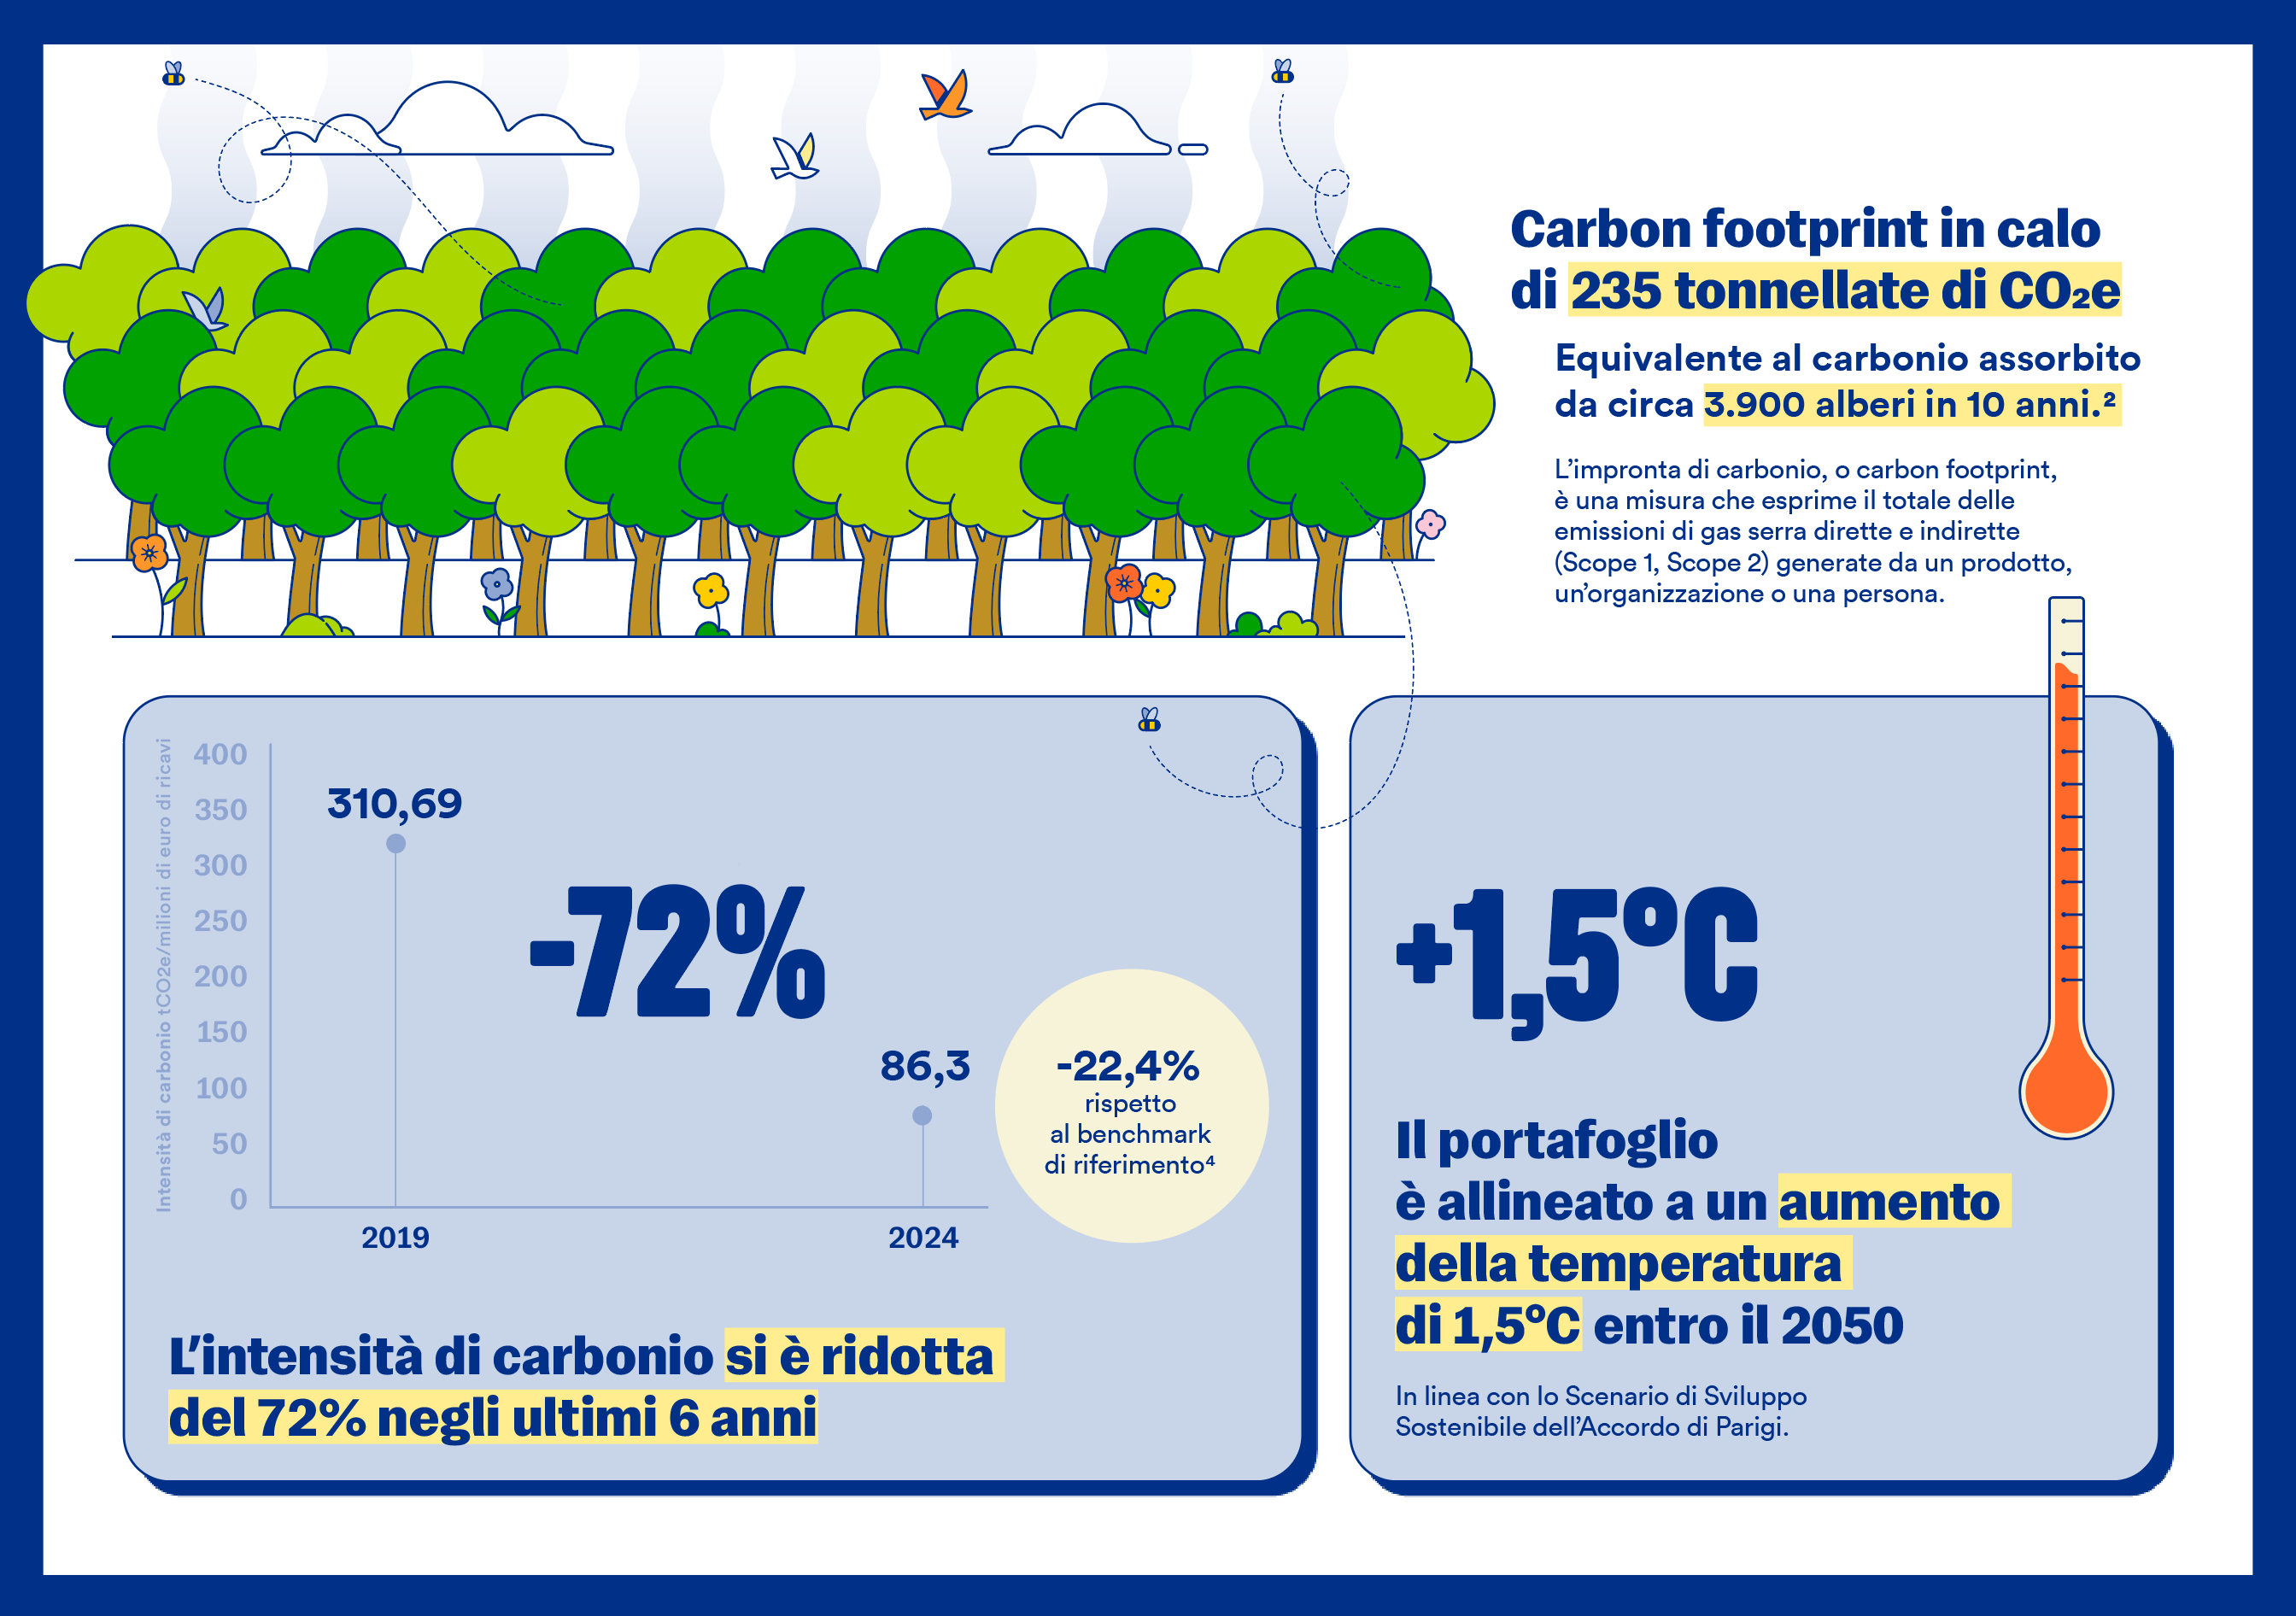
Overall, the relative carbon footprint of the portfolio amounts to 30.93 tCO2e/EUR million, which appears to be 3% lower than in the benchmark. The carbon intensity is 86.63 tCO2e/EUR million, 22,4% lower than the benchmark. The weighted average carbon intensity is 64,82 tCO2e/EUR million, 34% lower than the benchmark. Note that 99,1% of entities included in the portfolio disclose their scope 1 and scope 2 GHG emissions, compared to 93,1% in the benchmark.
This is a positive result for Etica, representing an improvement on last year’s performance. The main reasons for these ongoing improvements are the same as in previous years, which confirms the robustness of the Etica selection methodology.
Main reasons for the improvements:
- 1 – Change in portfolio composition due to Etica Sgr’s selection methodology and to asset manager’s considerations
In December 2021, Etica adopted a stricter selection policy for companies involved in fossil fuels activities. In September 2022, the selection policy was further developed to include a specific climate assessment of companies involved in any fossil-related activities and those operating in Utilities, Materials and Industrial sectors. The assessments differ slightly between Valori Responsabili and Etica Transizione Climatica because the latter has a higher threshold.
From a climate perspective, the selection methodology has not changed in 2024.
However, the portfolio has changed due to regular updates to the universe and financial considerations.
These two elements combined to produce an emission intensity of 14,084 tCO₂ per unit of revenue for new emitters, which is 2,613 tCO₂ per unit of revenue lower than in the 2024 issuers analysis.
When analysing how emissions are allocated, the impact of Etica’s decision becomes even clearer.
The table below shows the sectors with the highest emissions in the analysis, the comparative weight of each issuer in each sector between the portfolio and the benchmark, and the effects of sector allocation and issuer selection. A positive (green) figure of 3% indicates that the issuer has less GHG exposure in the portfolio than in the benchmark. A portfolio with a larger proportion of assets allocated to an emissions-intensive sector will ultimately have a higher exposure to GHG emissions. However, this can be offset by selecting less emissions-intensive issuers from that sector.
In particular, the methodological choice not to invest in the energy sector and to apply rigorous climate evaluations to companies involved in fossil fuels (mainly from the utilities sector) addresses these results.
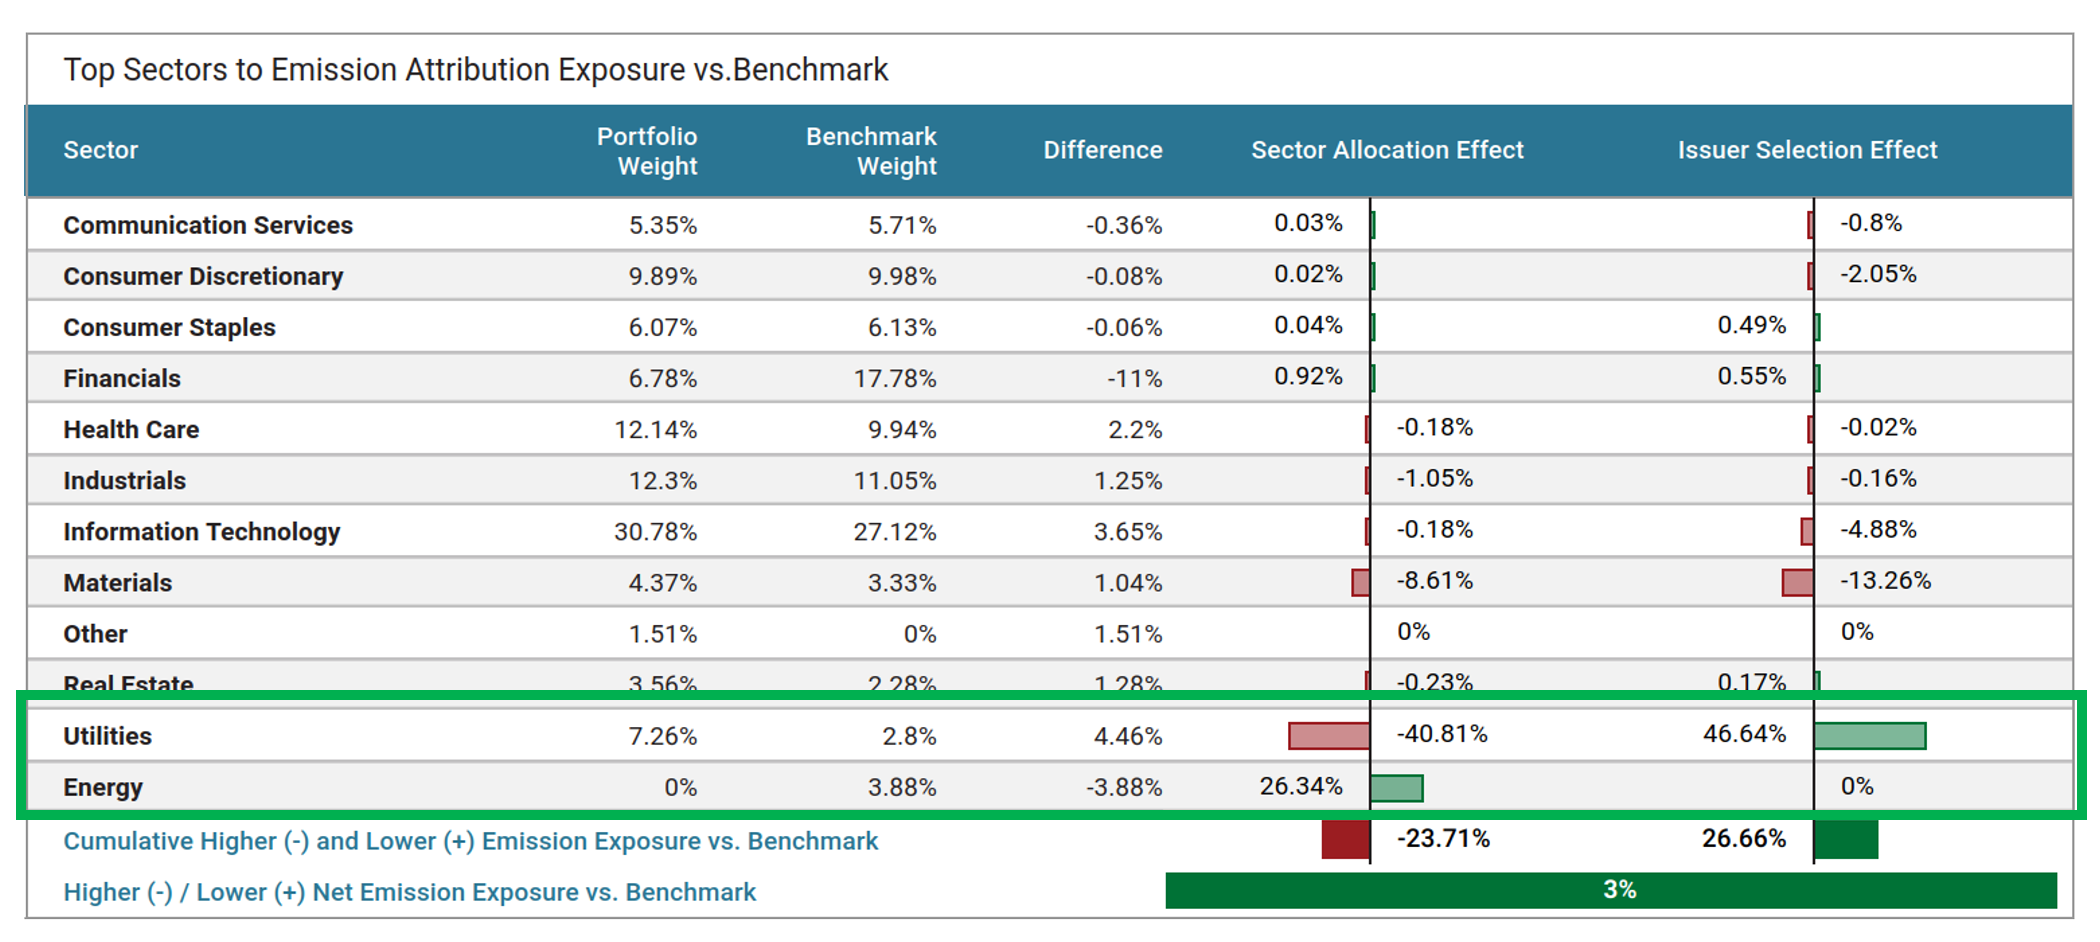
Figure 2 – Emission attribution analysis: top sectors versus emission attribution portfolio vs. benchmark.
This results in continued portfolio emission reduction due to the robustness of the methodology.
- 2 – Improvement of issuers’ emission intensity
The main driver of decarbonisation this year is issuers improving their emissions. However, this means that methodological changes have led to the selection of the most virtuous issuers from a climate perspective.
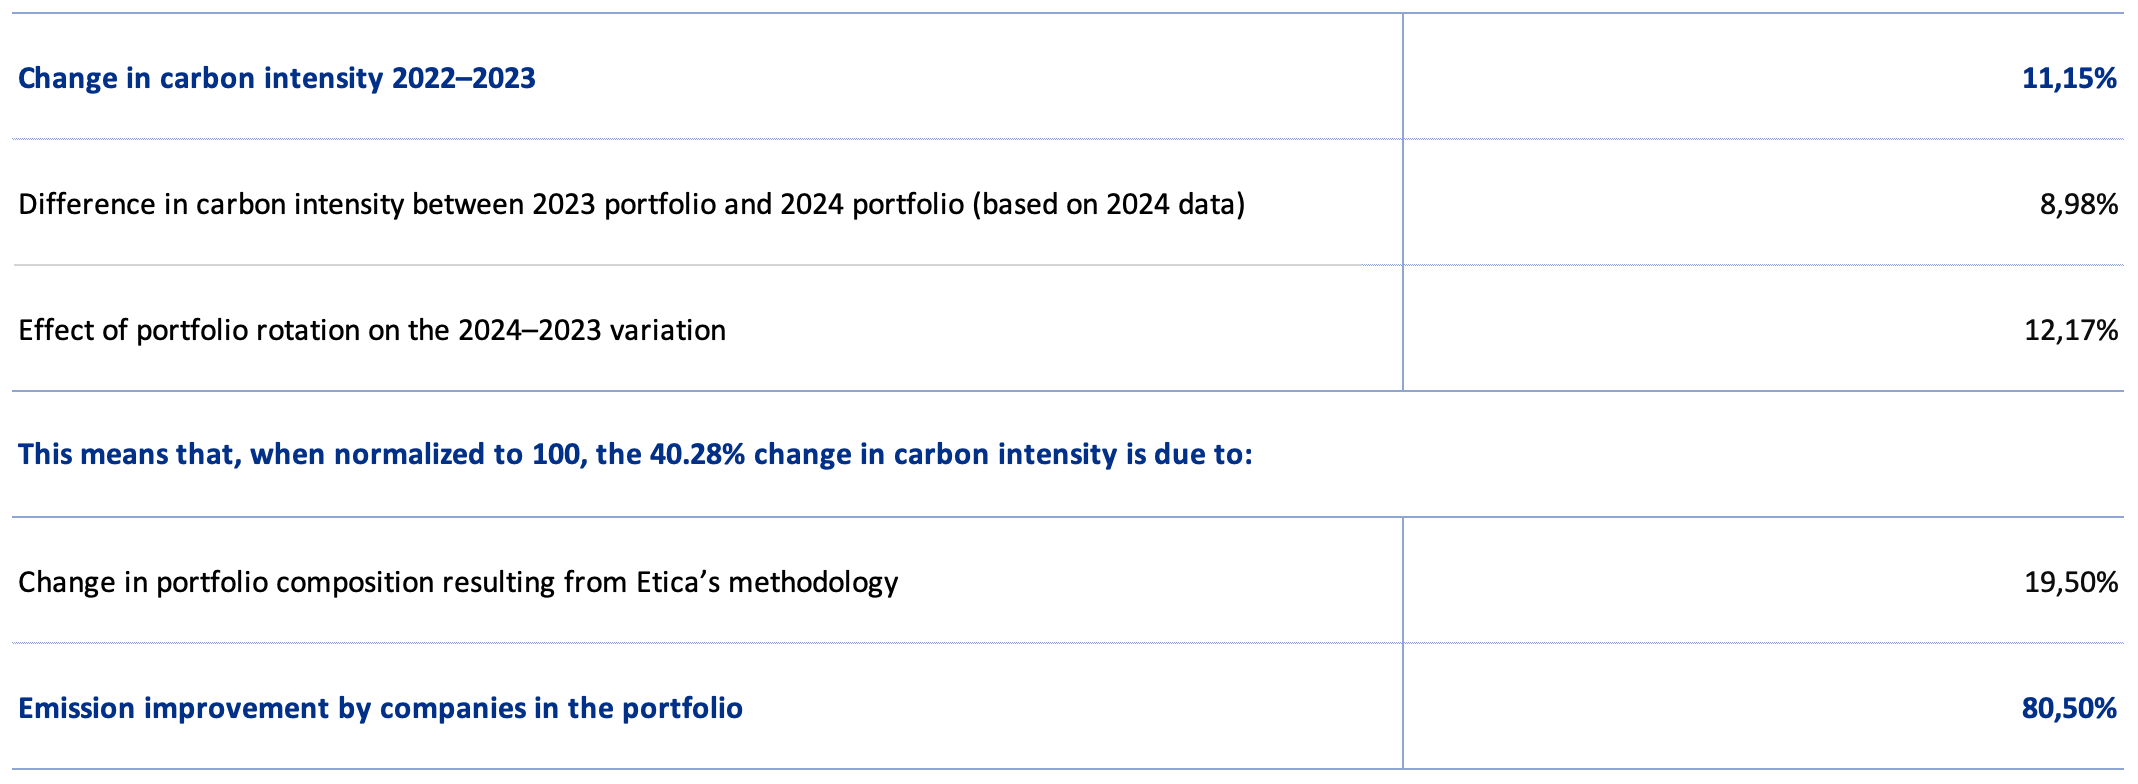
This can be verified by comparing the portfolios at the end of 2023 and 2024 using the latest available data for both, i.e. 2024 data. This will isolate the specific effects of the selection changes that affected the composition of the portfolio.
The portfolio’s carbon intensity at the end of 2023 was 97.5 tCO2e/MEUR and that of the same portfolio with the latest available data (2024) is 89.47 tCO2e/MEUR. Therefore it can be computed that:
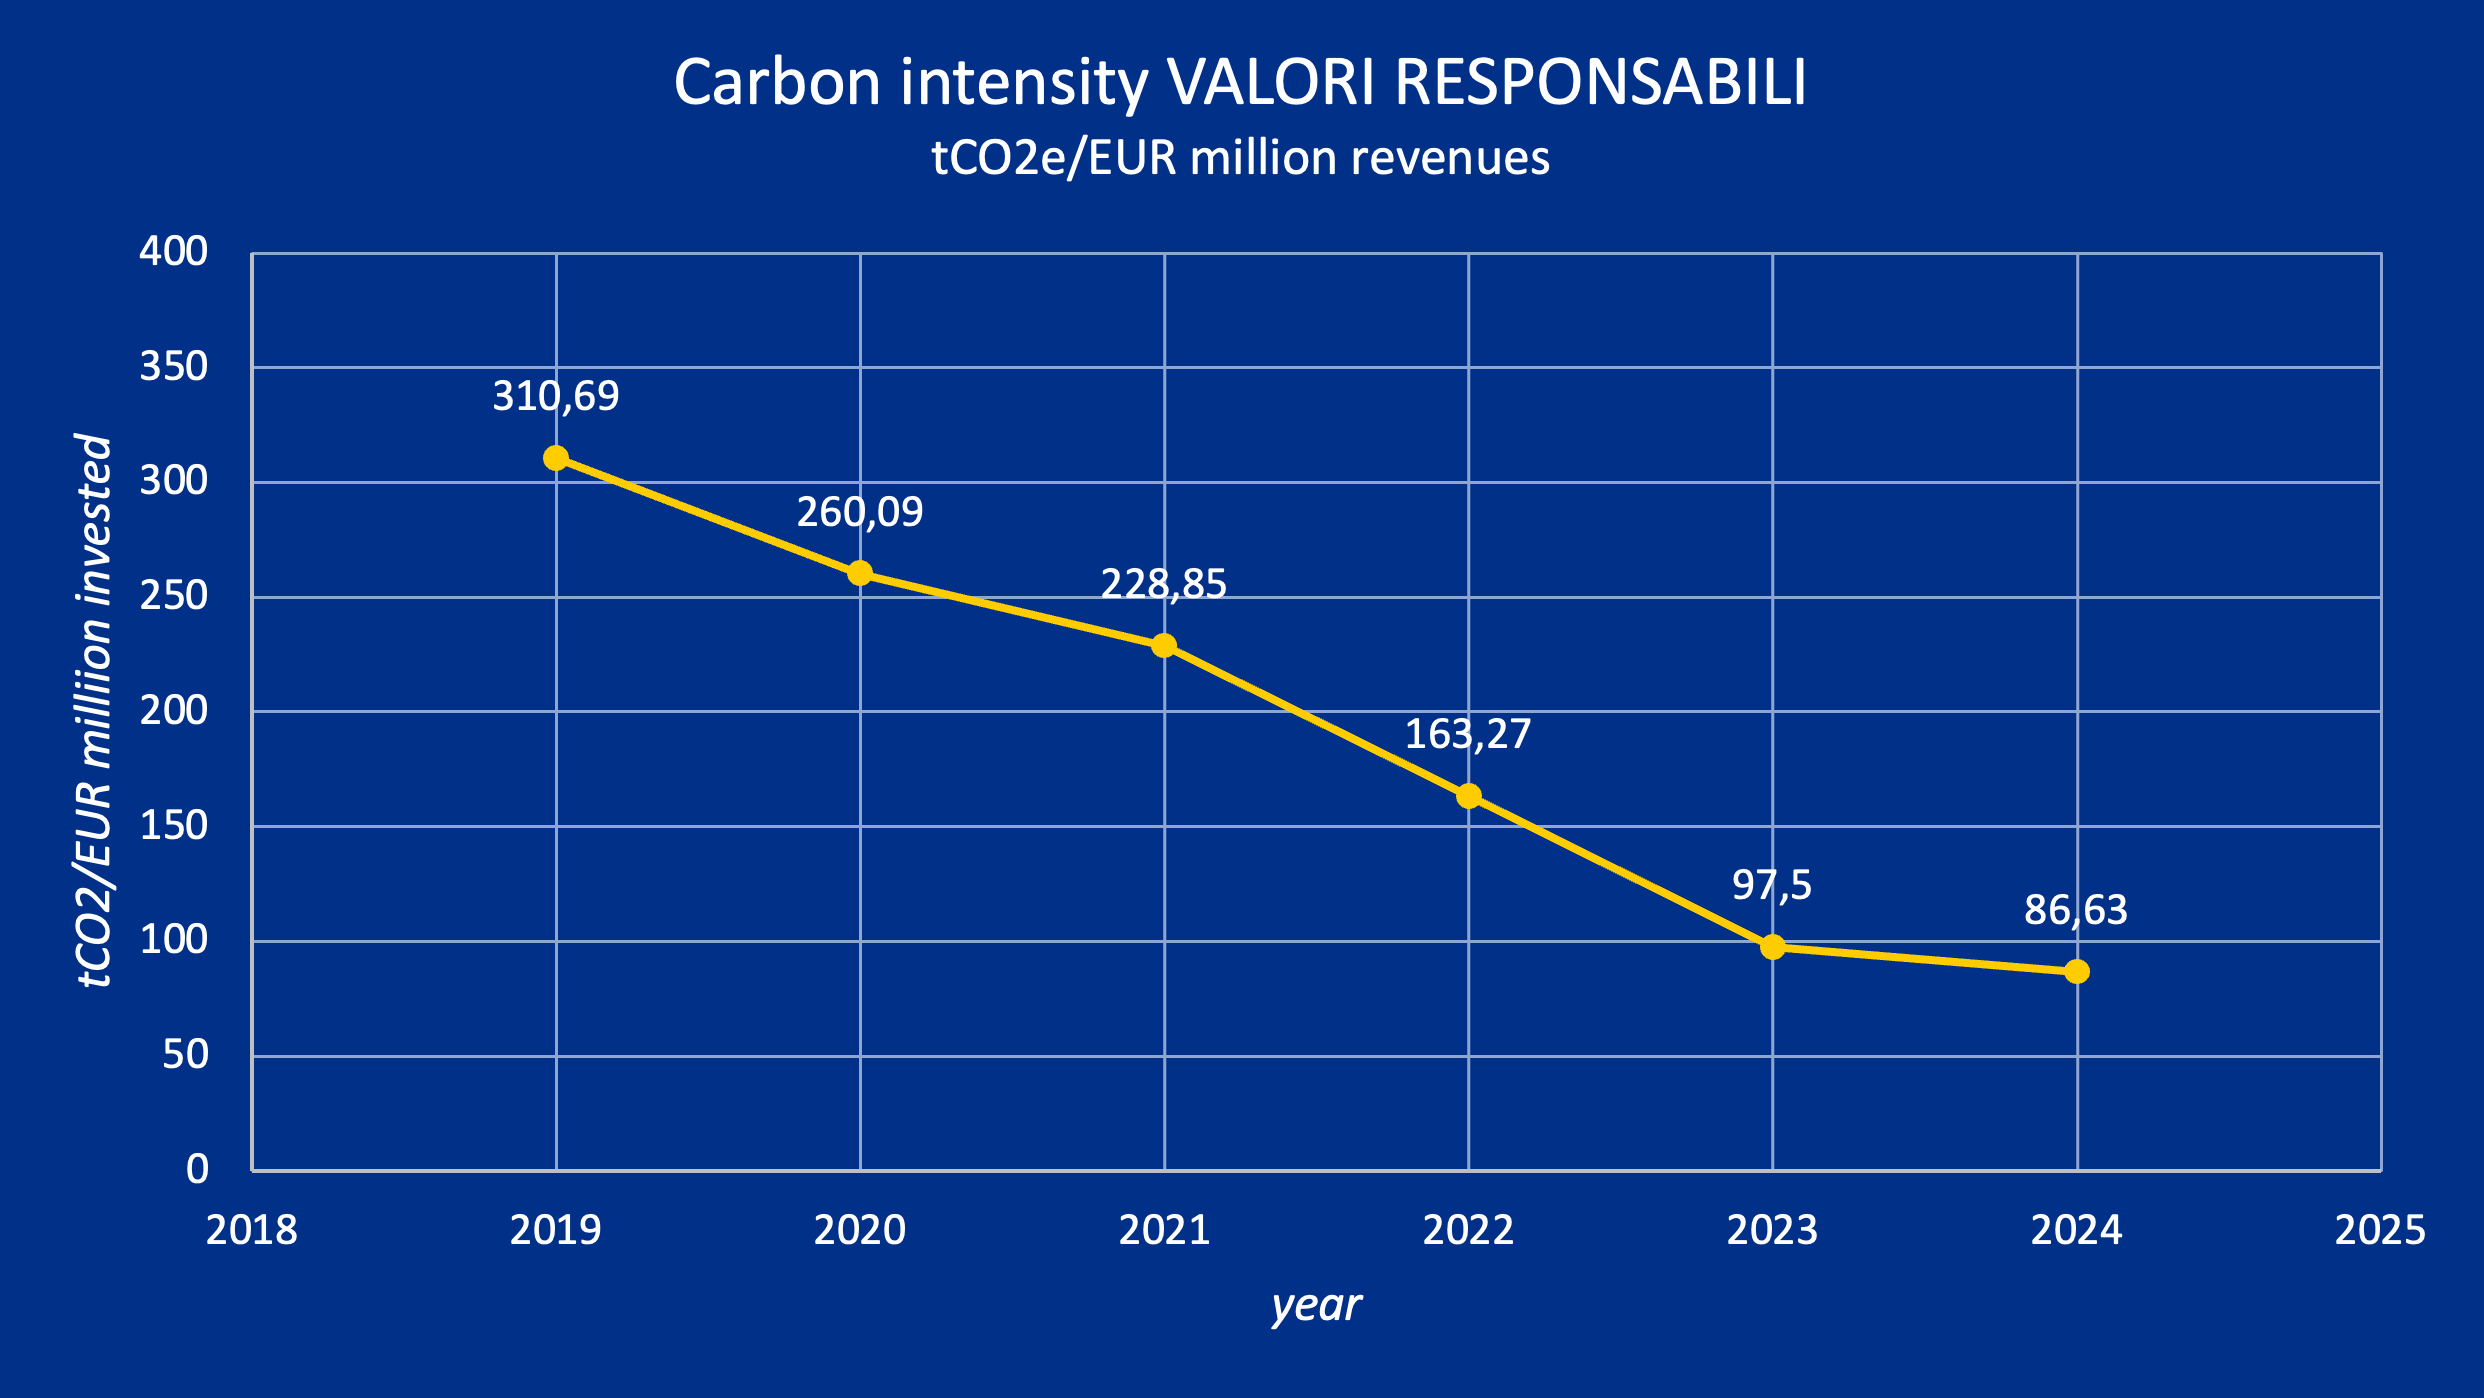
Comparison with Valori Responsabili portfolio y-o-y
As of June 2023, the new climate assessment has been fully applied to Valori Responsabili and no more changes were applied in 2024. This has resulted in a modest yet consistent reduction in 2024 emissions.
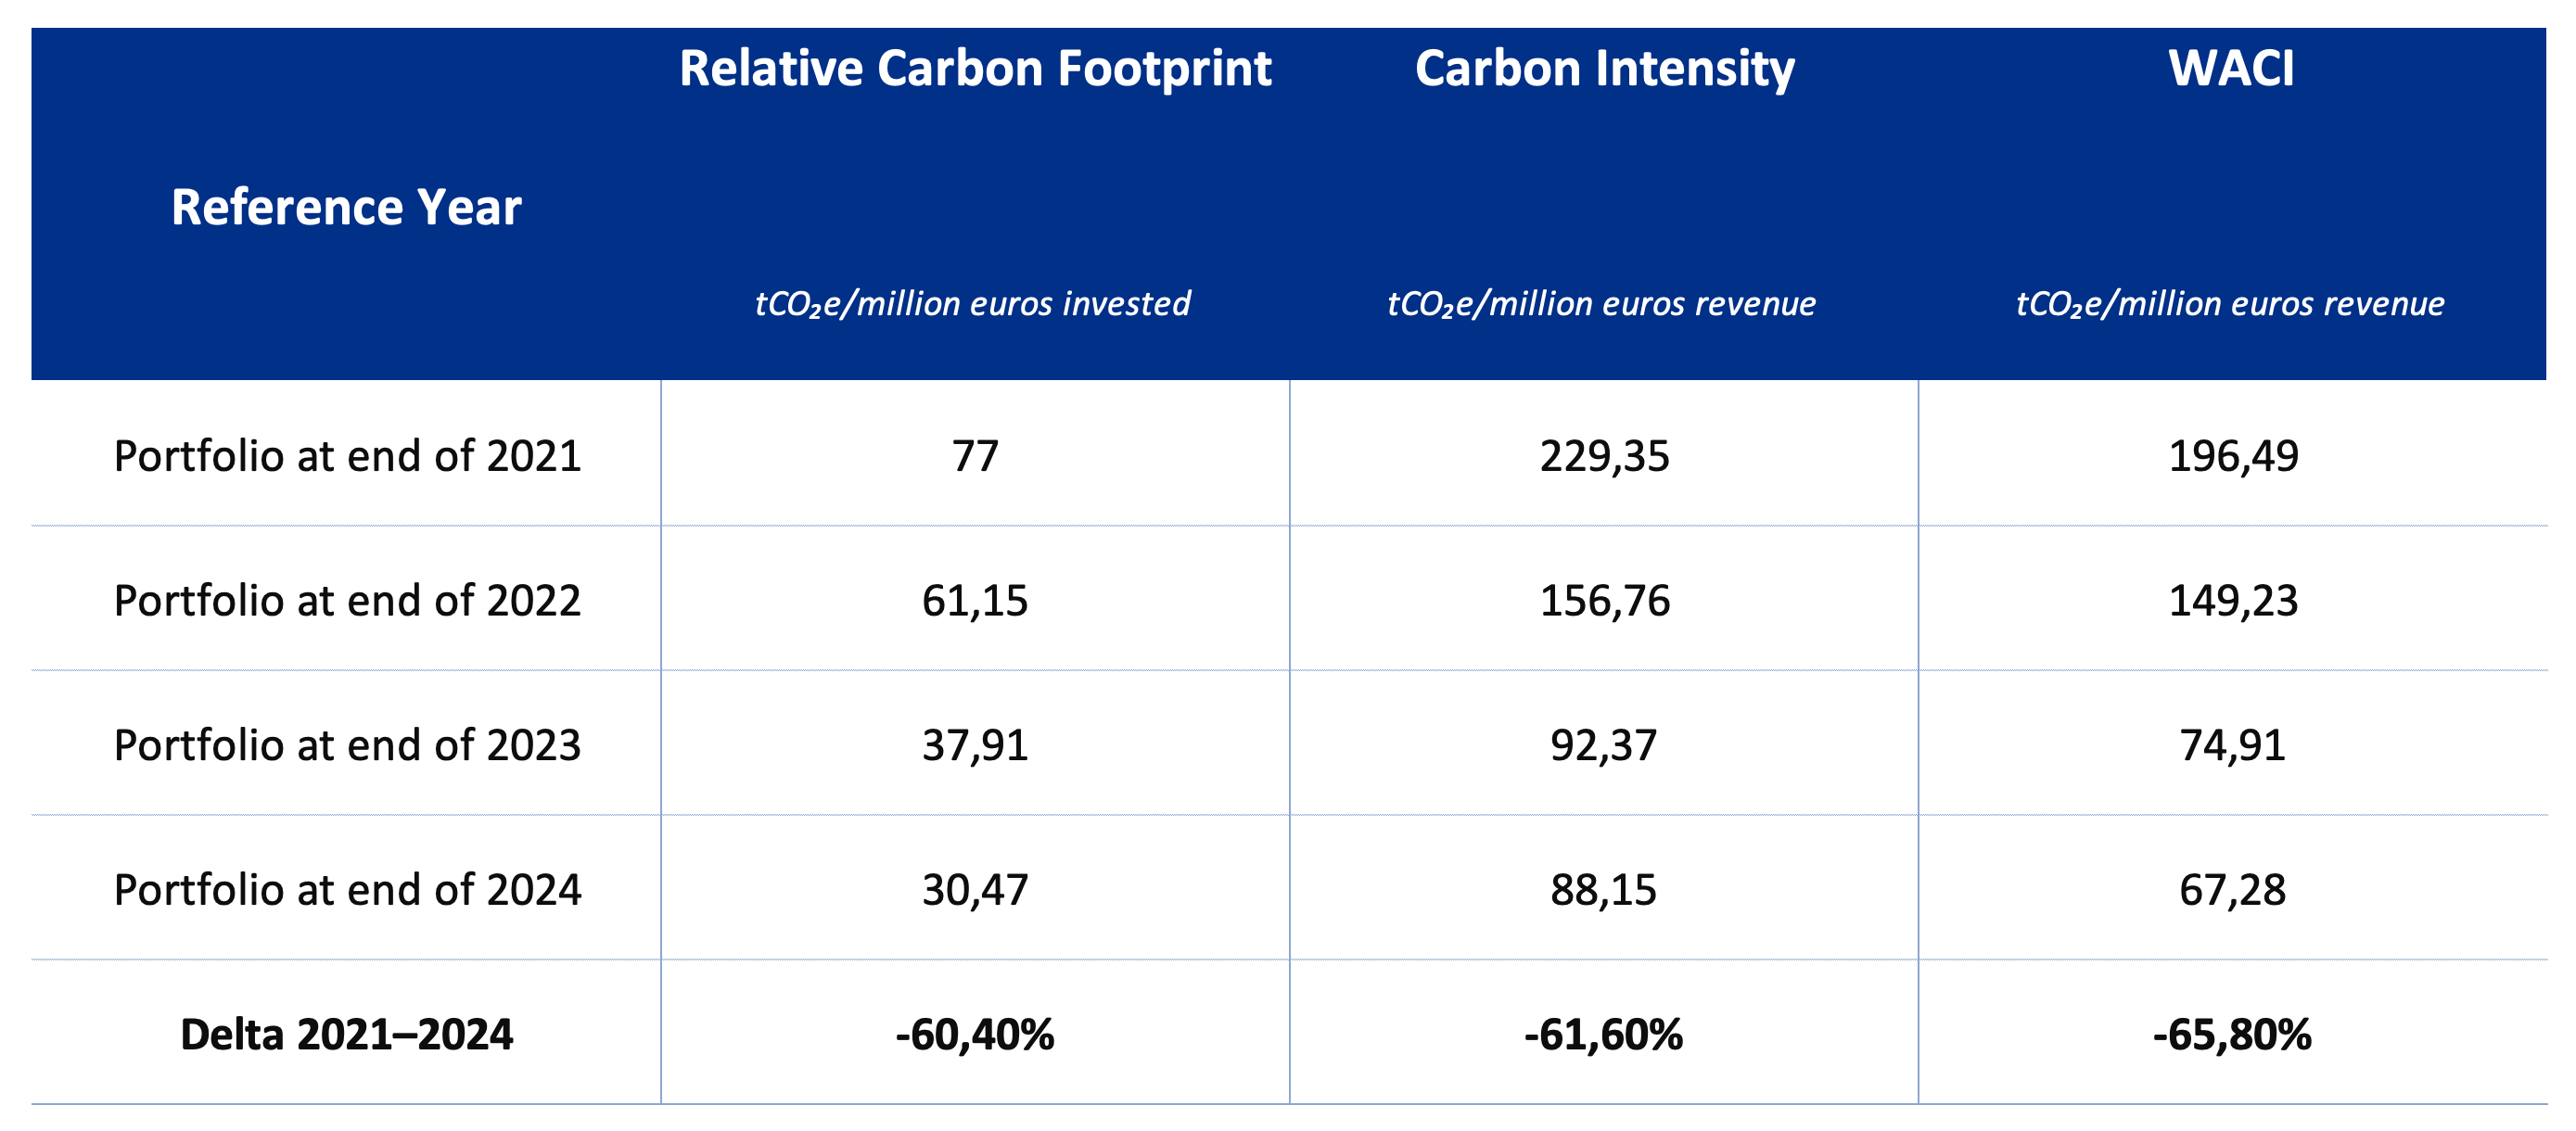
The table below shows the reduction rate over time.
In particular, note that, compared to the first assessment year in 2019:
- The relative carbon footprint decreased by 88%;
- The decrease in carbon intensity of 72%;
- The WACI decreased by 79%.
As stated above this results in continued portfolio emission reduction due to the robustness of the methodology.
Scenario Analysis
The purpose of the scenario analysis is to examine the current and future emission intensity from the direct and indirect emissions of a company (GHG scope 1&2) to see which climate scenario it is aligned with, until 2050. Each company’s carbon budget is defined based on its current and estimated future market share.
The scenario analysis compares the current and future portfolio’s GHG emissions with the carbon budget estimated in different IEA scenarios: Sustainable Development Scenario (SDS)[3], Announced Pledges Scenario (APS) and Stated Policies Scenario (STEPS)[4]. Each scenario is tied to a carbon budget, i.e. a limited amount of fossil carbon that can be combusted worldwide to remain within a certain temperature. The carbon budget changes depending on the scenario, with the Sustainable Development Scenario being the most ambitious one, consistent with a global temperature increase well below 2°C by 2100, compared to pre-industrial levels.
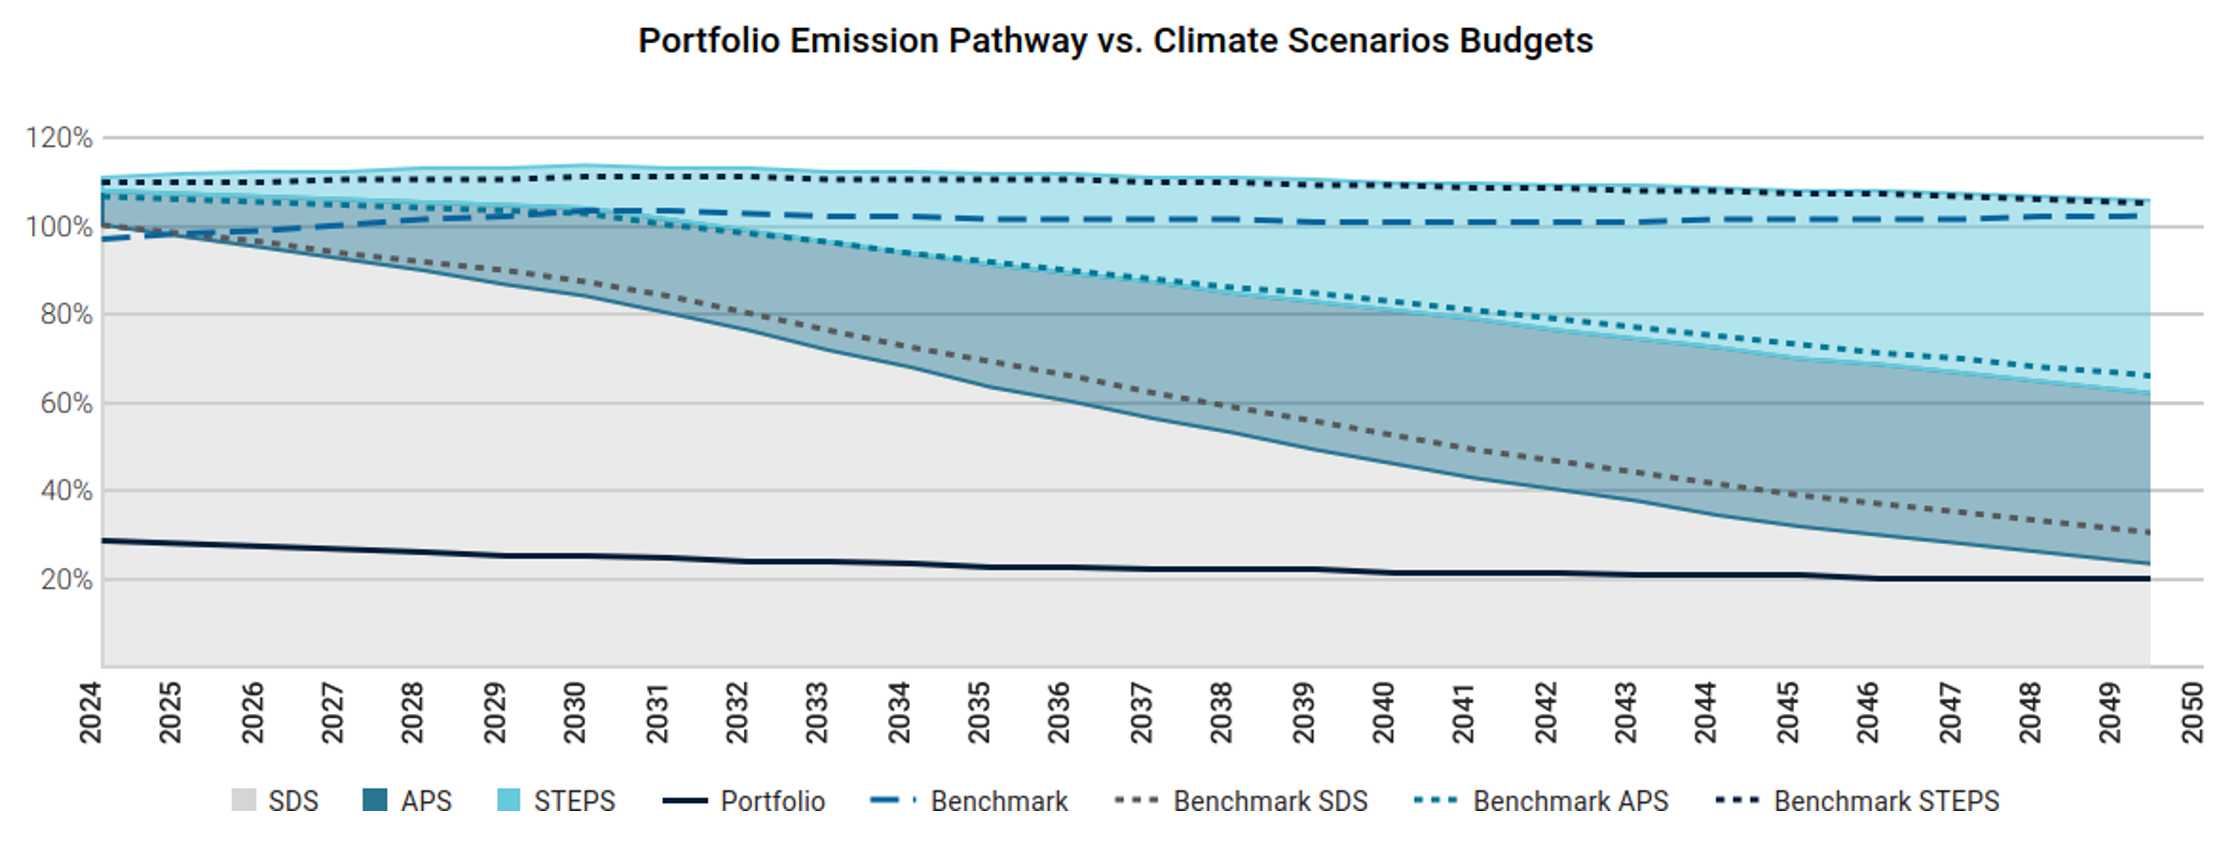
Figure 3 – Valori Responsabili Temperature Alignment Analysis, ISS Climate Impact Assessment 2025.
The analysis shows that the current state of the portfolio is consistent with a 2050 SDS scenario.
This means that, for the second time, the Etica Valori Responsabili has a potential temperature increase of 1.5°C.
The analysis carried out in 2022 showed that Etica’s portfolio was associated with a temperature increase of 1.7°C by 2050. In 2023, our portfolios were associated with a potential temperature increase of 1.5°C for the first time, and the Etica Valori Responsabili portfolio maintained this positive trajectory in 2024.
Conversely, the benchmark exceeds the budget of the SDS scenario in 2026 and is associated with a temperature increase of 2.7°C by 2050.
The portfolio’s better performance against the benchmark is explained by:
- The exclusion of most fossil activities from the portfolio
According to Etica’s investment policy, there are no investments in companies operating in the Energy sector[5].
- A higher number of companies with a commitment to reduce emissions
As of 31.12.2024, according to ISS, 87% of the portfolio’s value is committed to international climate goals and demonstrates future progress, against 73% of the benchmark. Specifically, 76% of the portfolio’s value (65% in the TCFD Report 2023) is covered by a GHG reduction target approved by the Science-Based Targets initiative (SBTi), against 52% of the benchmark.
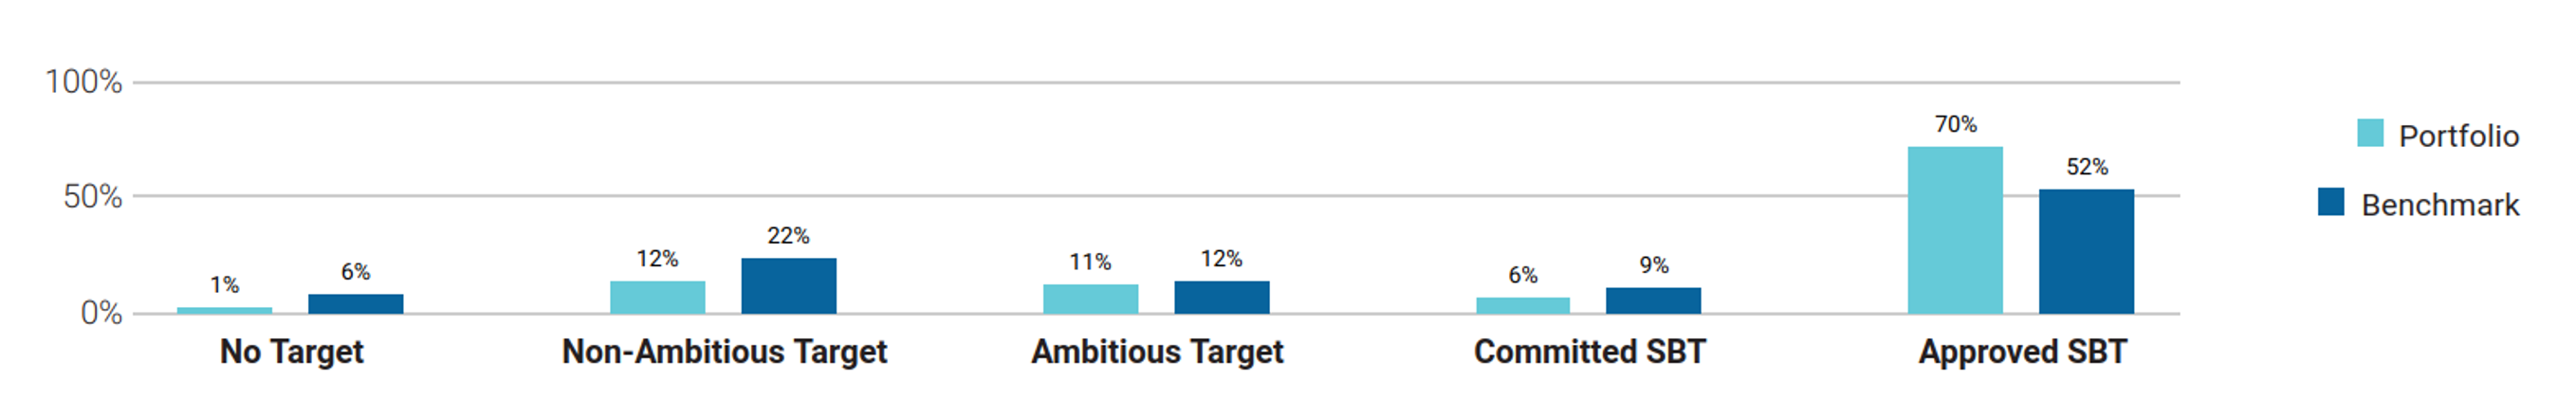
Figure 4 – VR Climate Targets Assessment, ISS Climate Impact Assesment 2025.
Transitional climate risks analysis
The transitional climate risks analysis dives also into the power generation mix of the portfolio.
Approx. 85% of the overall power generation capacity of companies in the portfolio comes from renewables, whereas only 14.2% comes from thermal power. This represents an improvement in last year’s figure of 74.96%.
Despite some portfolio utilities maintaining brown production, this sector plays a crucial role in the transition, accounting for 91% of the Etica Green Portfolio’s production. Furthermore, thermal energy production by utilities decreased by about a quarter compared to the 2024 analysis.
The portfolio also outperformed the benchmark, which has a renewable energy capacity share of around 25% and a thermal capacity share of almost 50%.
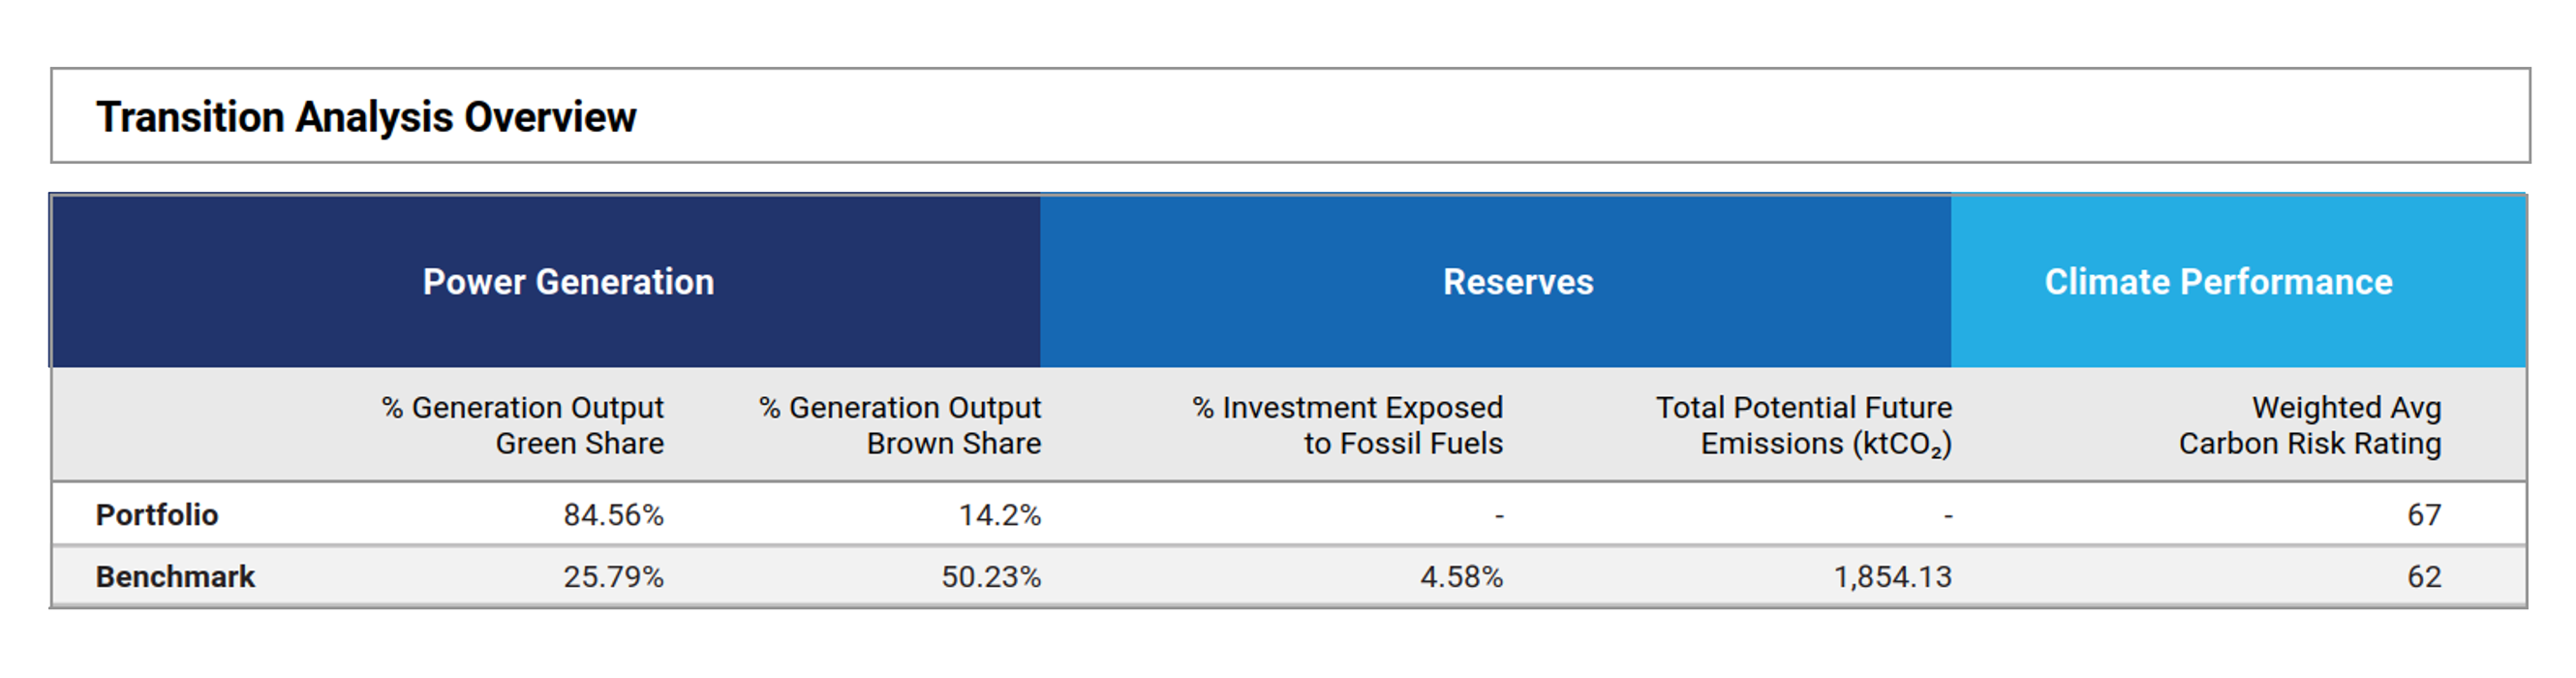
Figure 5 – portfolio power generation (green/brown share) vs benchmarck.
There is no exposure to fossil fuels, nor do any of the companies have fossil fuel reserves. This means that Valori Responsabili has no potential future emissions, whereas the benchmark is associated with 1,951,743 tCO₂ of future emissions.
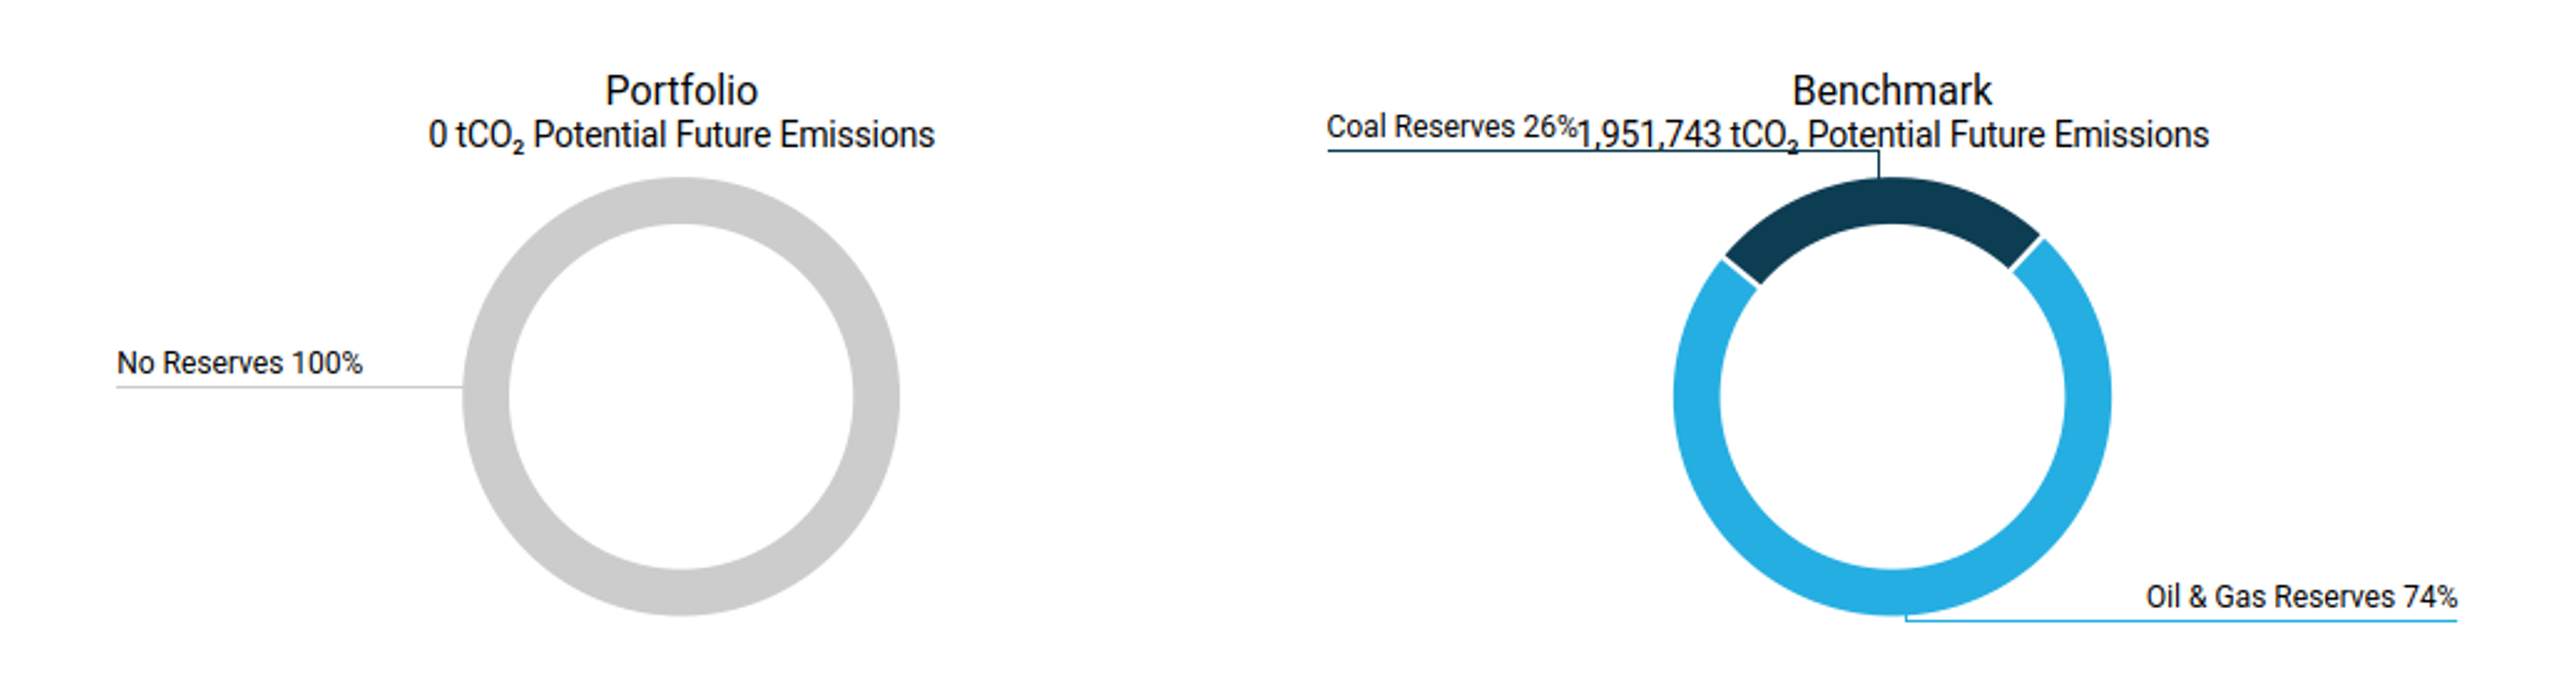
Figure 6 – potential future GHG emissions associated with companies with fossil reserves.
Physical risks
Even if the temperature increase is limited to 2°C, the climate system will change. This will include an increase in physical risks, such as floods, droughts and storms. This analysis evaluates the climate hazards that will have the greatest financial impact, considering how they might affect portfolio value[6].
At the end of 2024, the potential loss of value for Etica Valori Responsabili amounted to 18.8 million euros: less than 0.60% of the analysed portfolio value.
Even in the worst-case scenario, this value remains below 1% of the total analysed portfolio value.
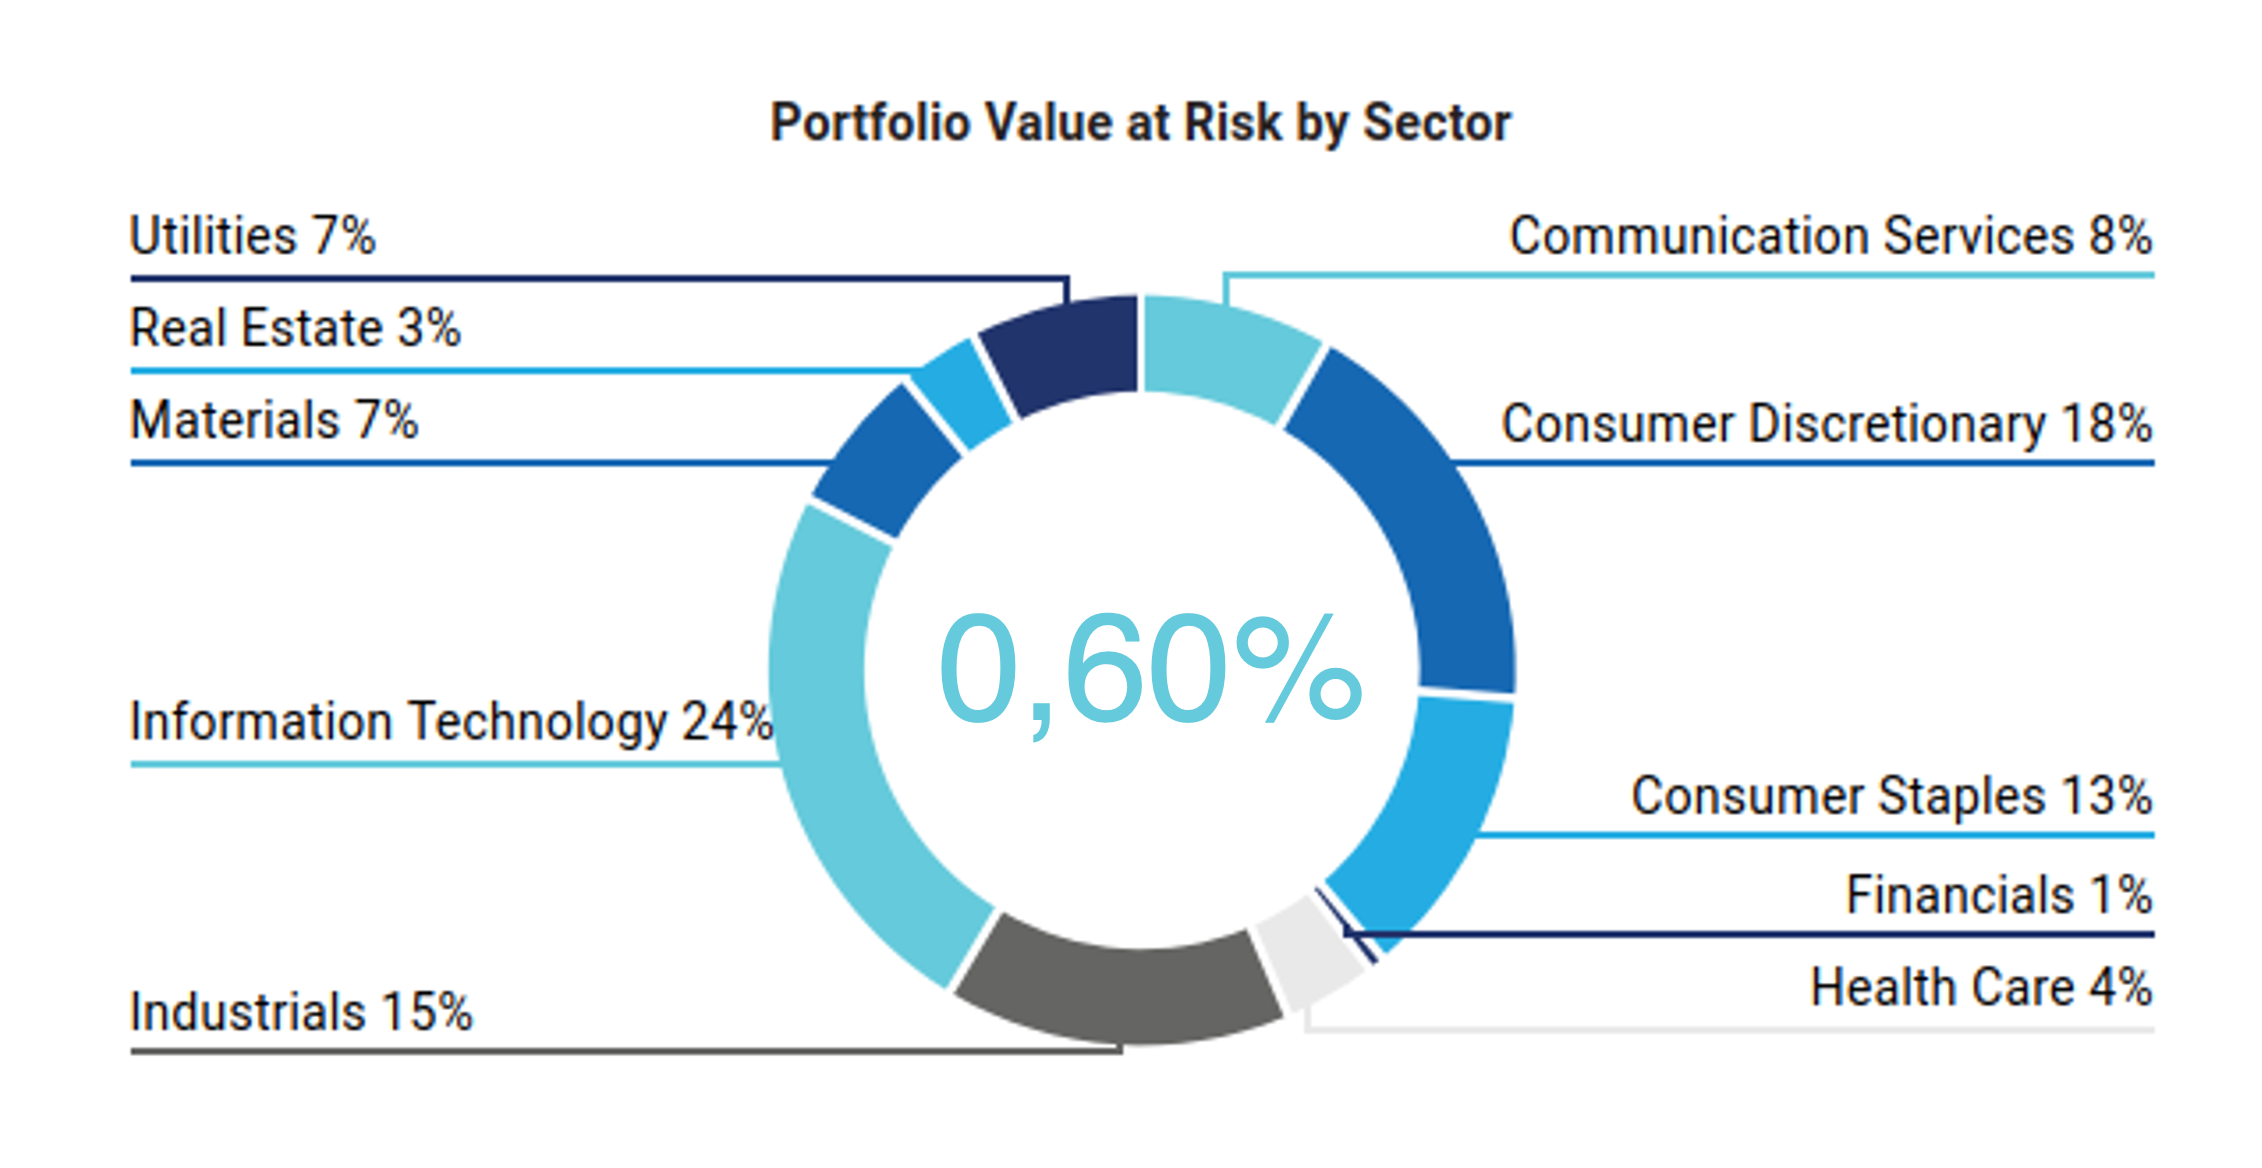
Figure 7 – Portfolio Physical Value at Risk by sector based on NZE2050 scenario.
Furthermore, the percentage of issuers with a weak physical risk management strategy has decreased by 2% compared to last year, standing at 10% now. In addition, 54% of issuers have a strong strategy in place.
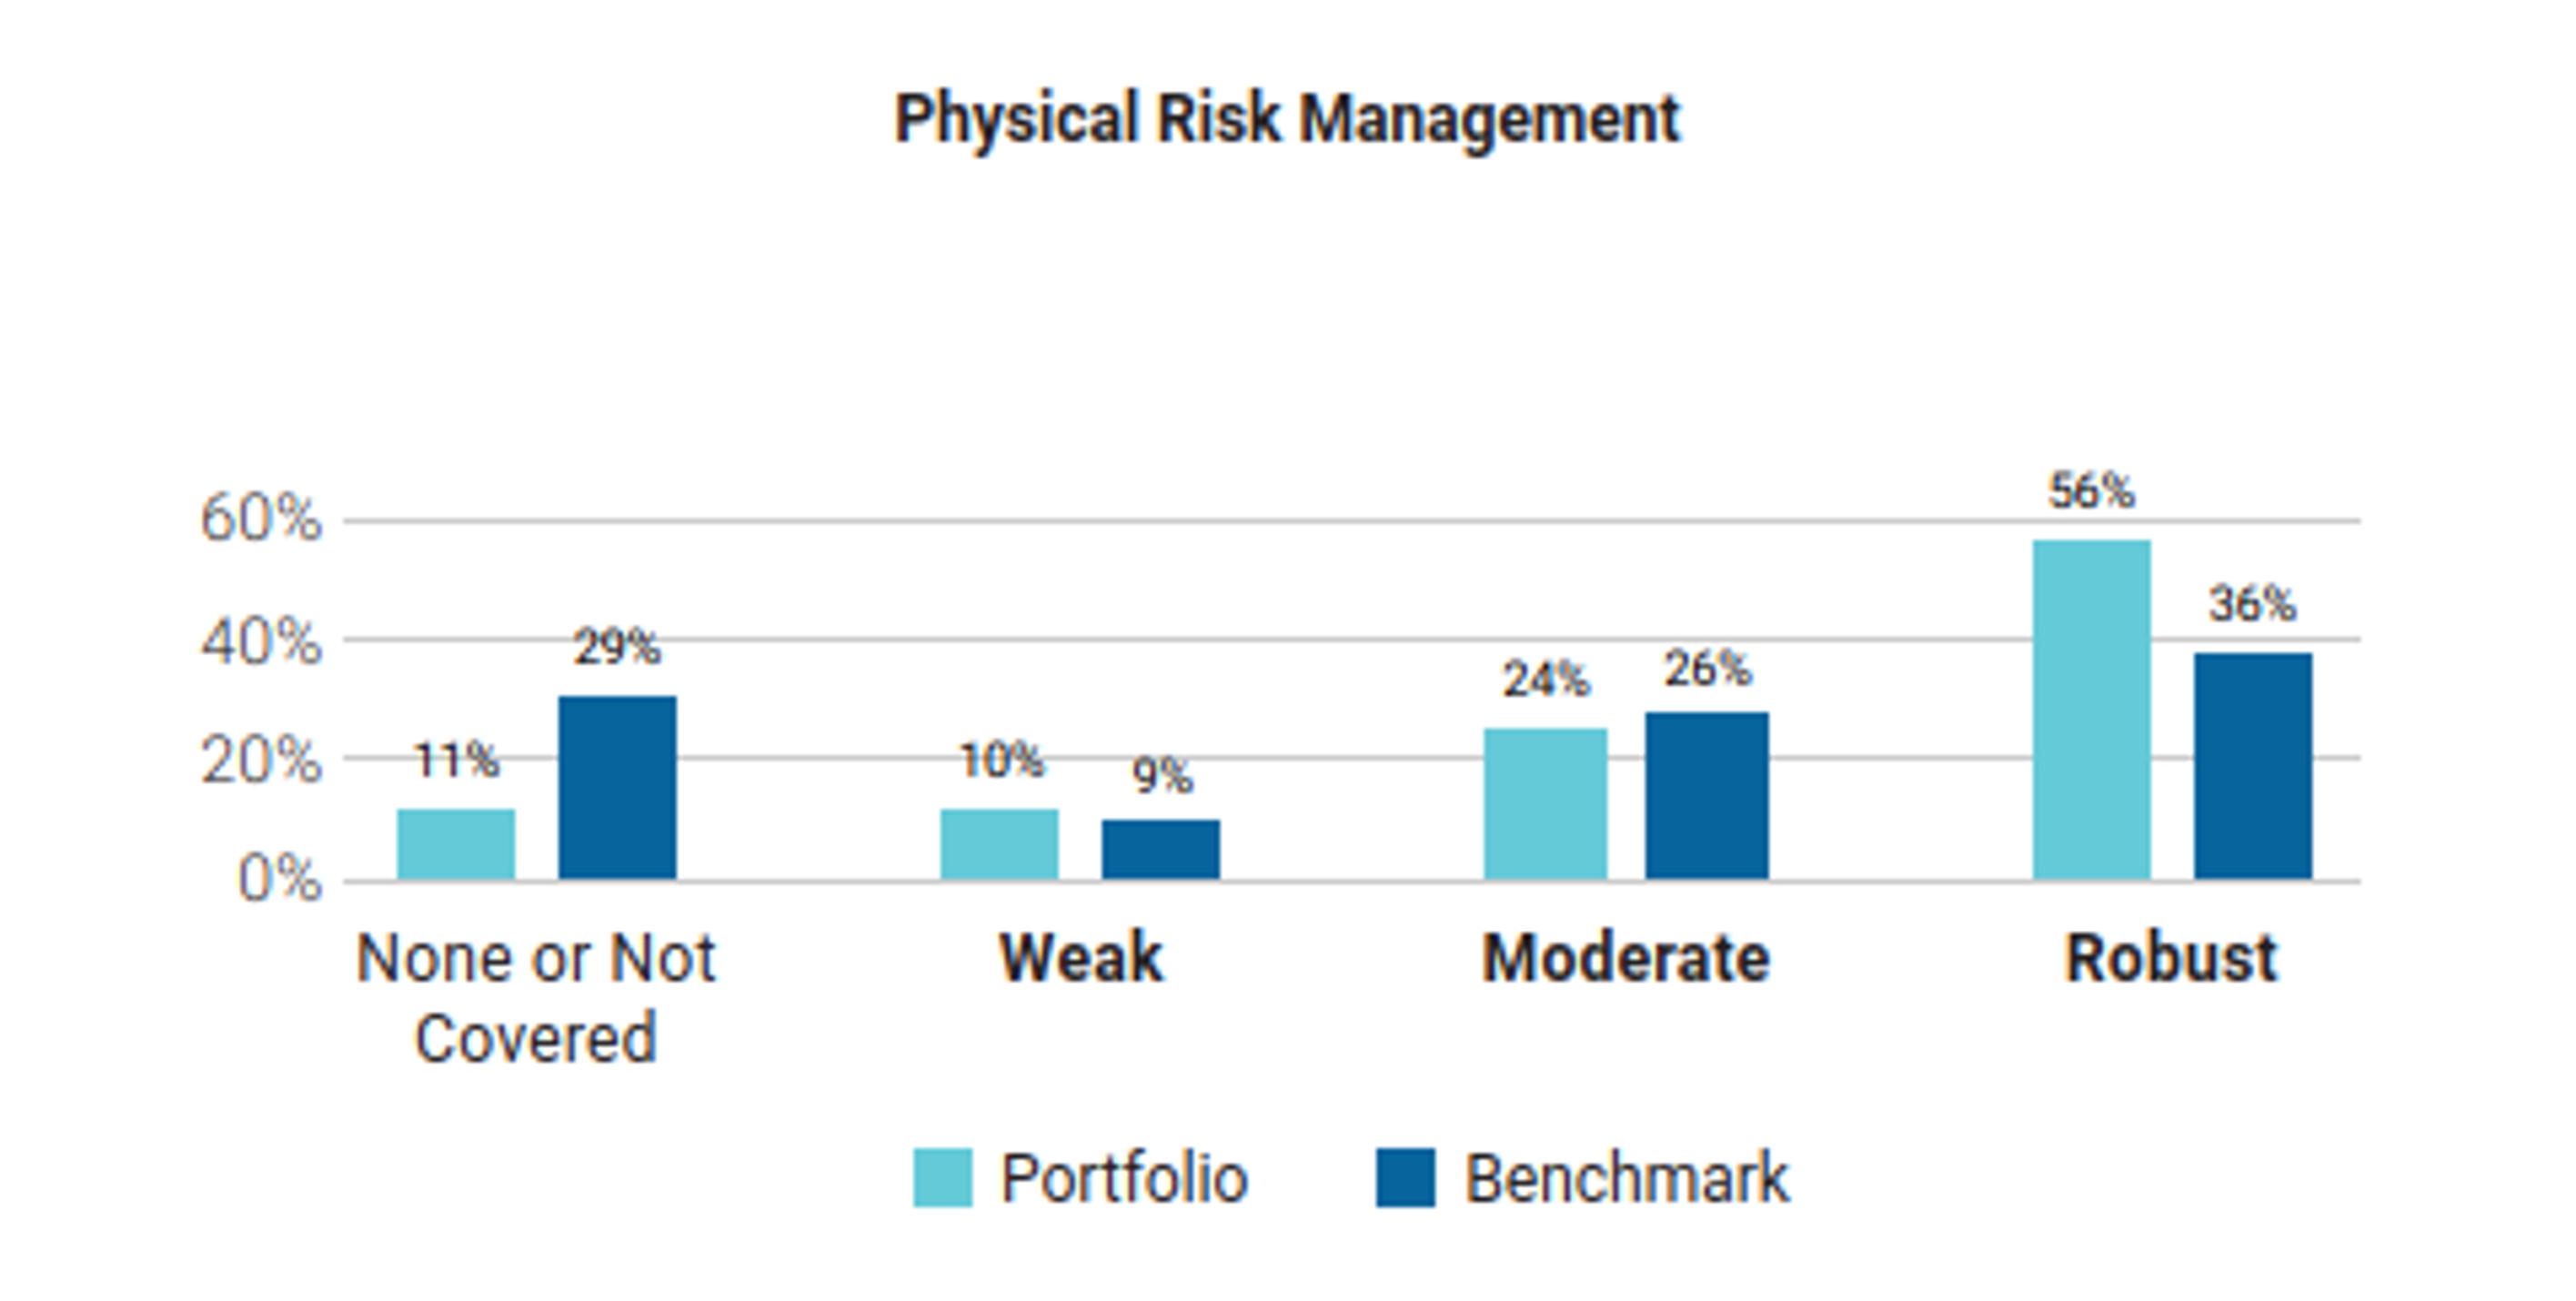
Figure 8 – ISS evaluation of the issuer’s physical risk management.
Conclusions
Etica’s methodologies, particularly regarding climate assessment, remain robust, and the changes implemented over the years have led to impressive reductions in emissions.
Compared to 2019:
- 88% reduction of carbon footprint;
- 72% reduction of carbon intensity;
- 79% reduction of WACI.
Moreover, the scenario analysis shows that, for the second year in a row, there has been an alignment with a temperature increase of 1.5°C.
The analysis also shows robust management of transitional and physical risks, with a high proportion of energy produced by issuers coming from renewable resources.
Sovereign bonds
This Sovereign analysis compares the carbon emissions and other carbon related characteristics of the underlying portfolio with the benchmark. The tables below include absolute and relative figures for portfolio carbon emissions as well as intensity measures for both production and government emissions.
“Emission Exposure” section measures the carbon footprint of a sovereign portfolio. Scope 1 Emissions are in tCO₂e while Scope 2 and Scope 3 Emissions are only in CO2 Emissions.
Relative carbon footprint is defined as the total carbon emissions of the portfolio per million invested.
Carbon intensity is expressed as the weighted average carbon emissions per million of PPP adj GDP as a proxy of the carbon efficiency per unit of output.
To account for the different calculation possibilities as well as to offer various perspectives, ISS ESG provides data for the following two different sovereign emission categories:
- Production Emissions: Emission footprint of a country’s production with its imports according to the latest PCAF guidelines released in December 2022.
- Government Emissions: This approach takes into account that a government bond co-finances both direct emissions from the public sector and investments made by the government. This approach is no longer recommended by PCAF. However, ISS will still provide in the time being government emissions.
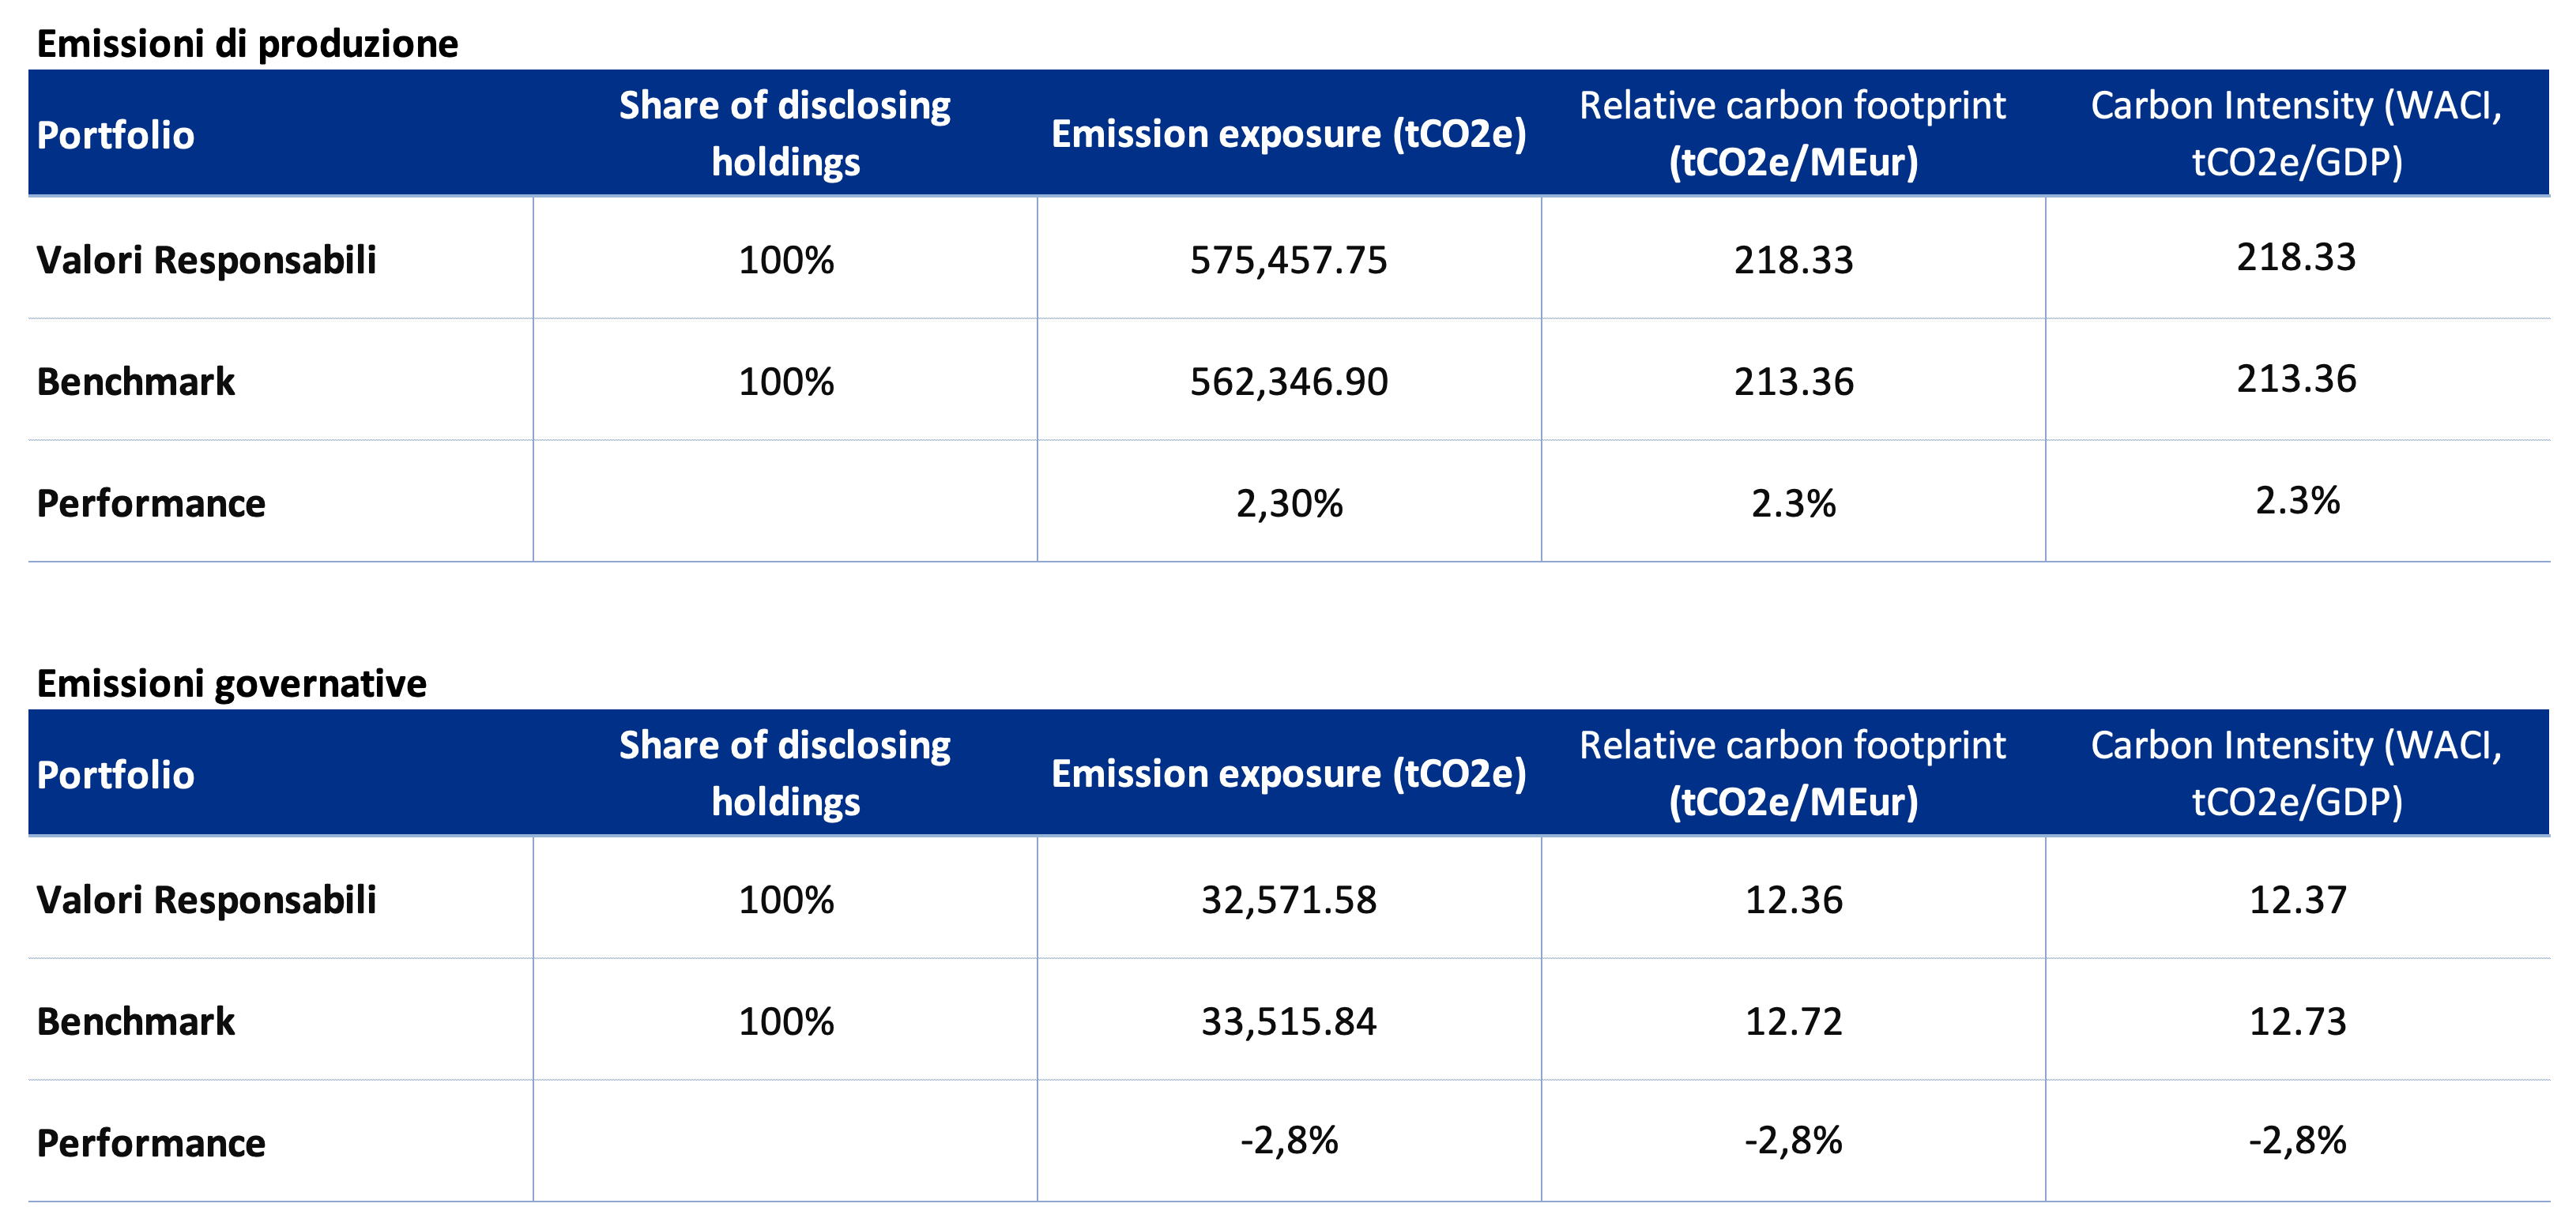
Compared to last year, the composition of the portfolio has changed slightly, with an overexposure to Germany, a country with higher emissions than others. This also makes the portfolio more different from the benchmark, which explains the slightly worse performance of the portfolio.
Please note that the methodology does not currently account for any strong climate selection for the sovereign issuer.
Furthermore, this analysis does not consider the type of bond but only assesses the climate performance of individual countries. The type of bond consideration could be an area for improvement in the 2026 analysis.
Climate Impact in Brief
Reference
[1] https://www.issgovernance.com/esg/
[2] Launched after the 2015 Paris Agreement by the Financial Stability Board (FSB), the Task Force on Climate-related Financial Disclosure (TCFD – https://www.fsb-tcfd.org/) considers climate transparency as a crucial factor for the stability of financial markets. The objective of the TCFD is therefore to improve climate transparency in financial markets through recommendations on disclosure. These recommendations provide a “consistent framework that improves the ease of both producing and using climate-related financial disclosures”. The TCFD aims to create a unique standard for both corporate and investment disclosure, understanding that local regulatory frameworks may require different compliance levels. By October 12, 2023, the TCFD had fulfilled its mission and disbanded, although it remains a valid guideline for assessing and reporting on climate-related risks.
[3] The Sustainable Development Scenario is not more developed in the World Energy Outlook 2022 by the International Energy Agency. However, to guarantee comparability with previous years, this edition of the report still relies on it.
[4] Details on the scenarios and on underlying assumptions are available at: World Energy Model – Analysis – IEA
[5] Specifically, Etica does not invest in companies included in the following sectors (according to BICS classification): Oil Exploration & Production, Integrated Oils, Oil & Gas Services & Equipment, Oil, Gas & Coal, Pipeline, Mining Services, Precious Metal Mining, Coal Operations and Other Mined Minerals.
[6] ISS employs a model to estimate potential value losses arising from changes in share price due to physical climate risks by 2050, computing the Value at Risk (VaR) of each issuer.
This is a marketing communication.
Marketing communication by Etica SGR S.p.A. Investors should only make an investment decision after fully understanding the overall characteristics and level of risk exposure involved, by carefully reading the KID and the Prospectus of the individual funds. These documents – along with information on sustainability aspects pursuant to Regulation (EU) 2019/2088 – are available on the website www.eticasgr.com. The recipients of this message bear full and sole responsibility for the use of the information contained in this communication, as well as for any investment decisions possibly made on the basis of it, since any use of this information as a support for investment decisions is not permitted and is entirely at the investor’s own risk.


 – Valori Responsabili")
 – Etica Impatto Clima")