This document is a commented summary of the Climate Impact Report released by the company ISS ESG[1] based on its proprietary methodology, concerning the holdings of Etica Sgr’s Fund Etica Valori Responsabili (also referred to as “the portfolio”). The report includes metrics aligned with the guidelines of the Task Force on Climate-related Financial Disclosures (TCFD[2]).
All asset classes have been analysed according to the TCFD recommendations, grouped as follows: Equity Portfolio and Corporate Bonds Portfolio together and, Sovereign Bonds Portfolio.
The analysis outlines the climate performance calculated on the portfolio at the end of June 2023. It is divided into the following sections: carbon metrics, scenario analysis, transitional climate risks analysis, physical risks, and sovereign bonds.
- Carbon metrics
- Scenario Analysis
- Transitional climate risks analysis
- Physical risks
- Conclusions
- Sovereign bonds
Carbon metrics
The carbon metrics recommended by the TCFD and used in the Equity and Corporate Bonds analysis are the following ones:
- Relative Carbon Footprint: defined as the total scope 1 and scope 2 GHG emissions of the portfolio, directly attributable to the investor through its ownership share in companies’ total market value (also defined as “Emissions Exposure”), per million EUR invested. It is measured in tCO2e/EUR million invested.
- Carbon intensity: defined as the total scope 1 and 2 GHG emission intensity of the portfolio (based on issuers’ revenues), directly attributable to the investor through its ownership share in the companies’ total market value. It is measured in tCO2e/EUR million revenue.
- The Weighted Average Carbon Intensity (WACI): expresses scope 1 and 2 GHG emission intensity (based on issuers’ revenues), proportional to the issuers’ weight in the portfolio. Hence, this does not take the ownership share into account. It is measured in tCO2e/EUR million revenue.
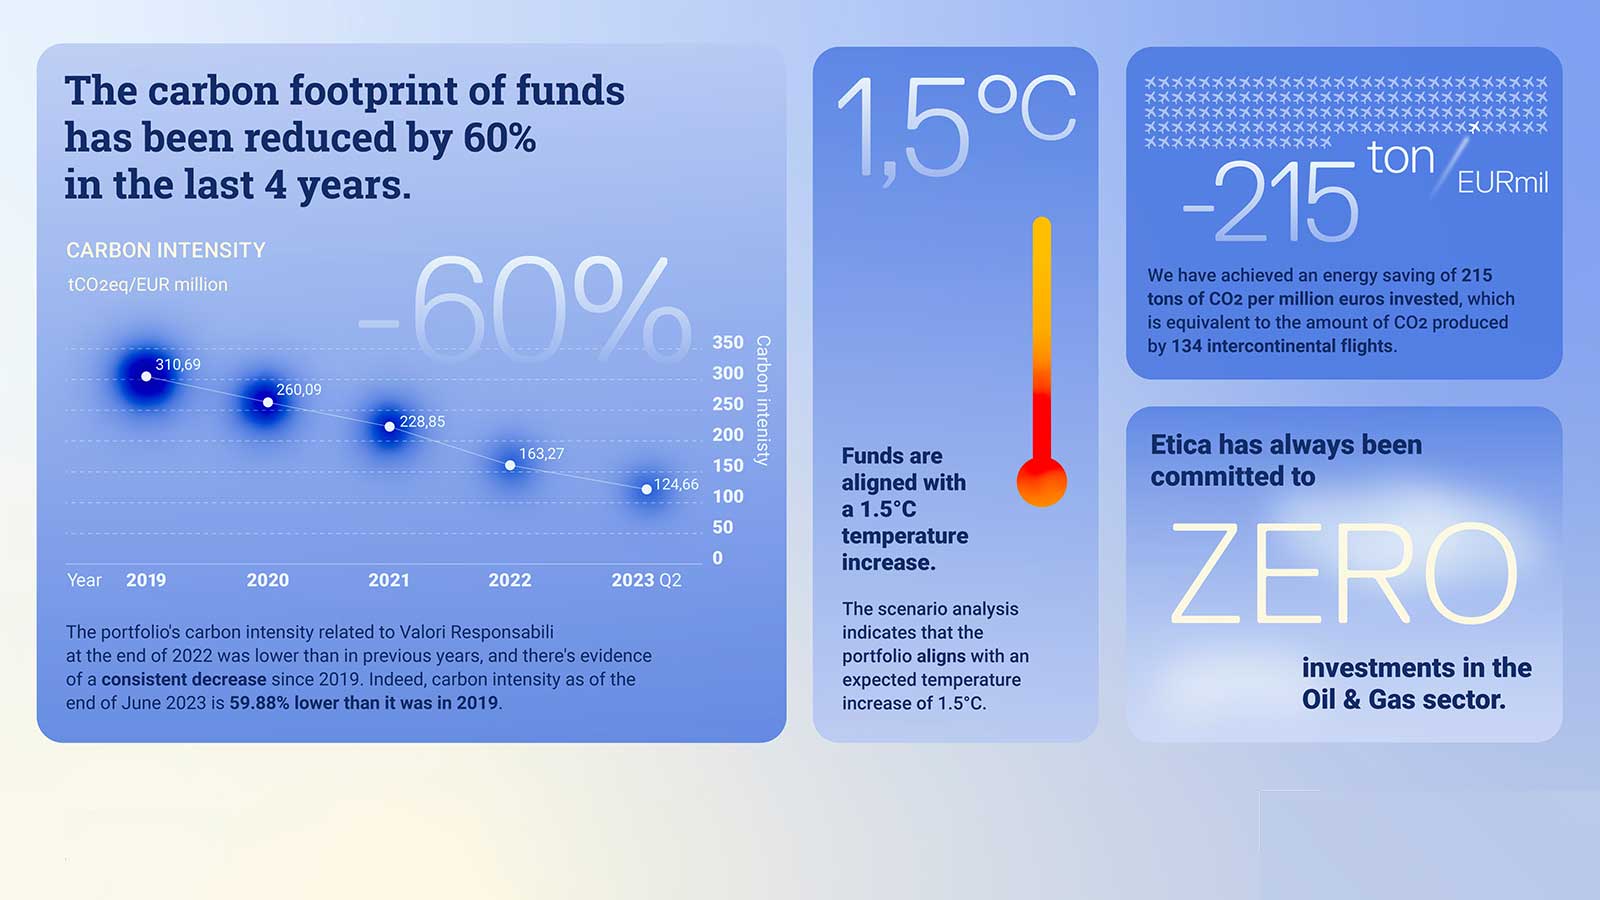
Overall, the relative carbon footprint of the portfolio amounts to 50,84 tCO2e/EUR million. The carbon intensity is 124,66 tCO2e/EUR million, the weighted average carbon intensity is 139,99 tCO2e/EUR million.
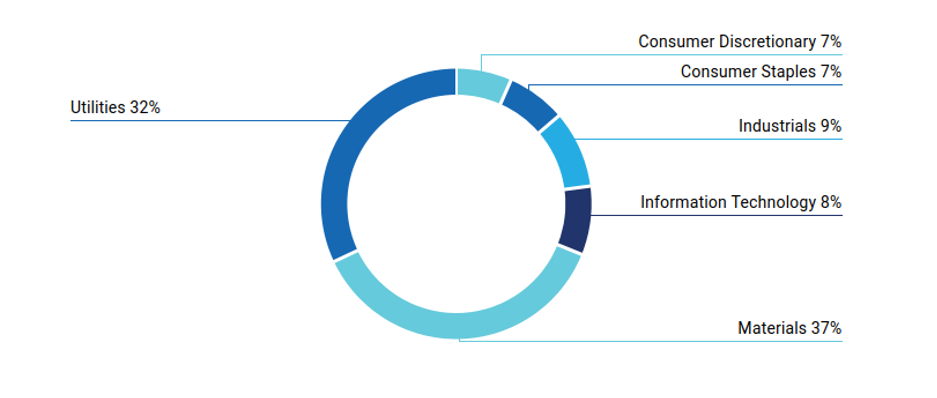
Sector contribution to emissions in Valori Responsabili
Comparison with Valori Responsabili portfolio year-end 2021.
Based on the carbon footprint analyses performed over time, in 2021, the selection methodology has been amended to improve the carbon footprint of the funds, by introducing specific criteria to evaluate companies involved in natural gas activities and companies in high carbon-intensity sectors. During 2022 a specific climate assessment has been included in the methodology to further enhance Etica’s selection approach. The effects of such changes are fully applied to the portfolios by June 2023.
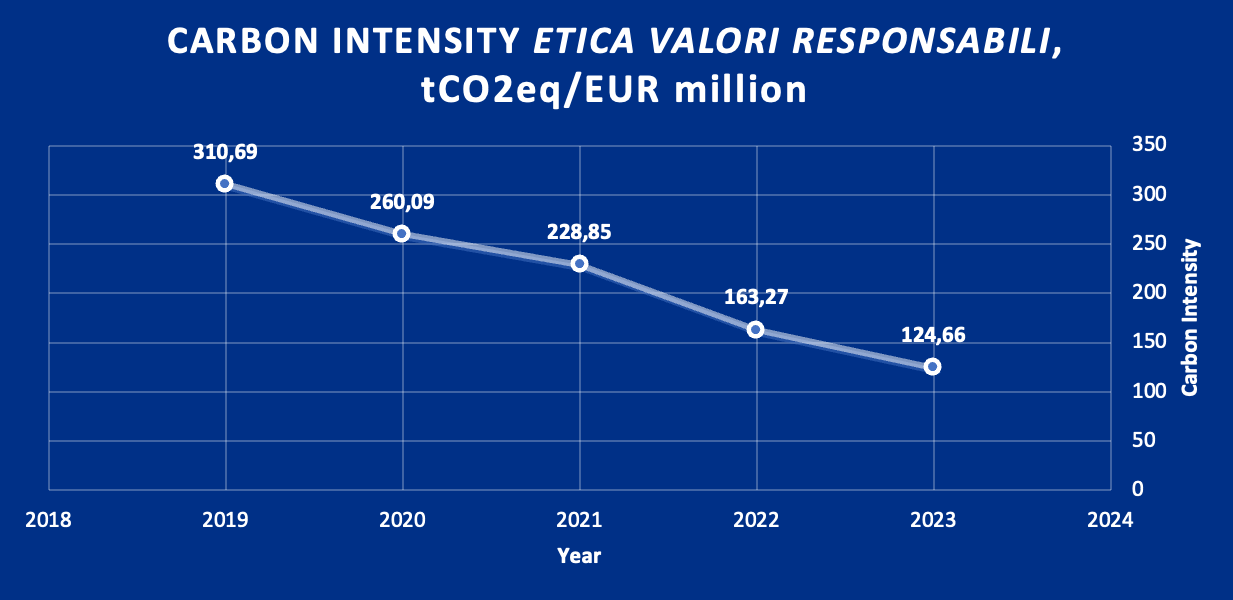
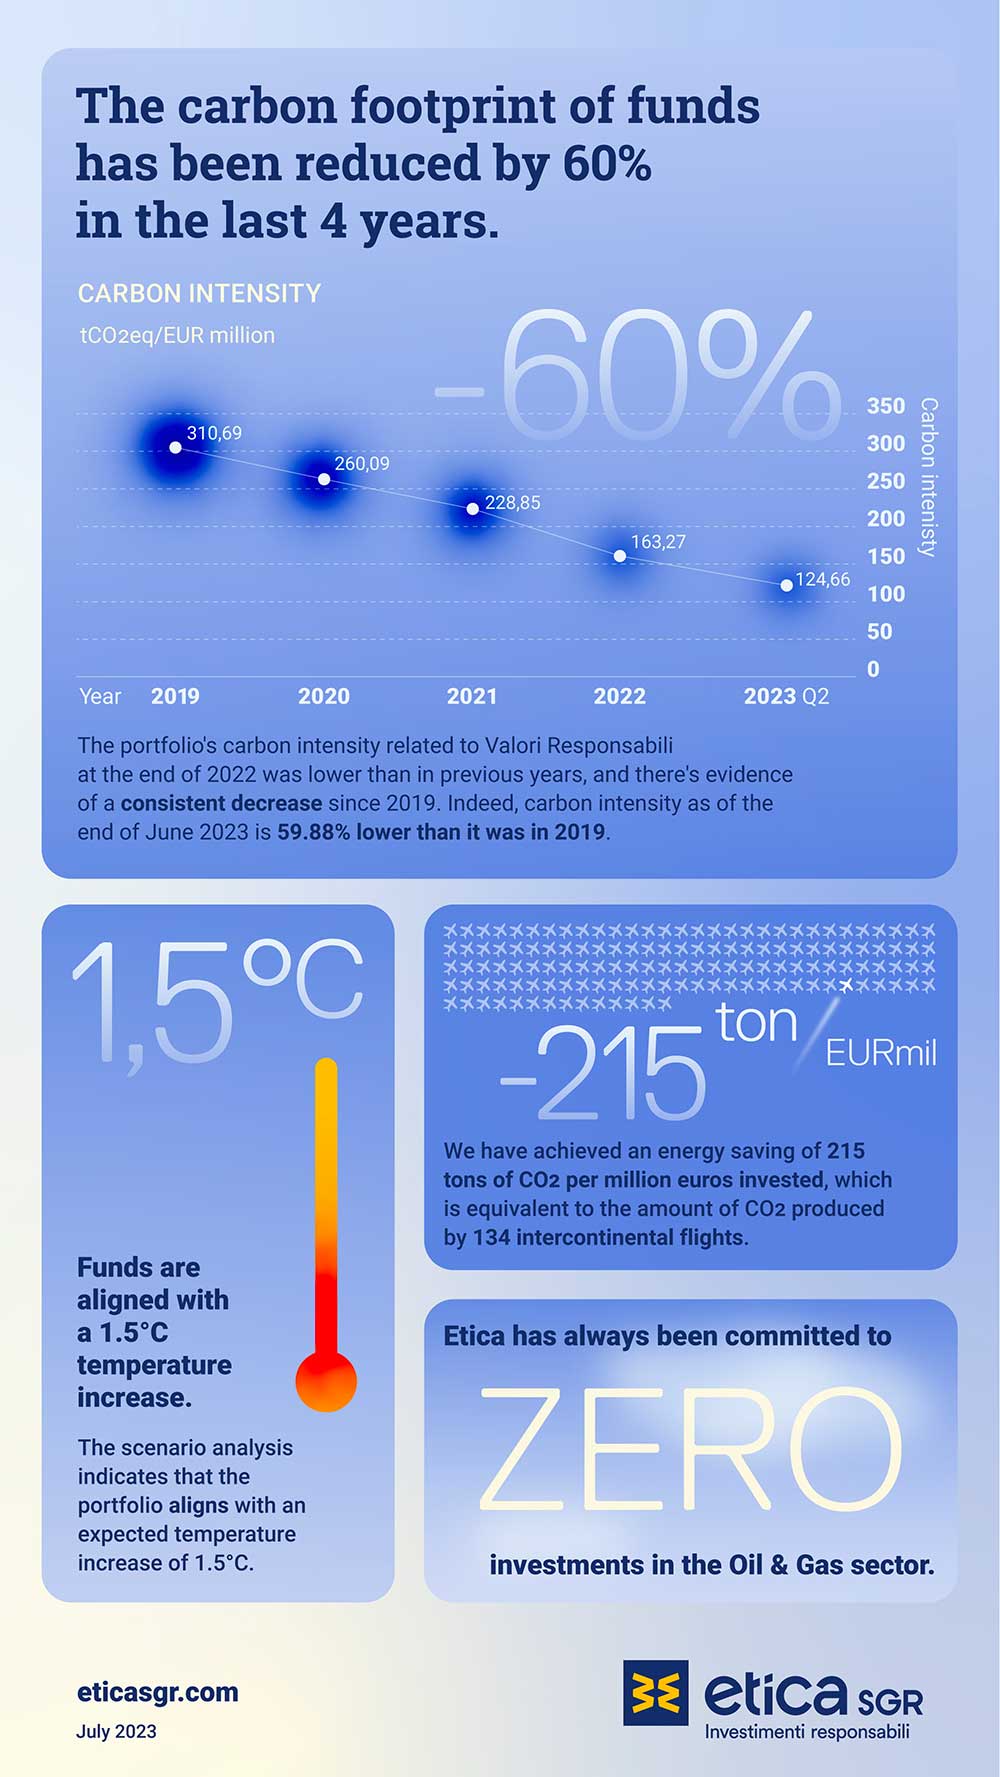
There is evidence of a steady decrease in the carbon intensity of Valori Responsabili since 2019, especially in the latest two years thanks to methodological interventions that occurred during 2021 and 2022 and to the positive performance of companies previously selected for investments. From 2021 to 2023Q1 Valori Responsabili’s carbon intensity dropped by 45,53% and it is 59,88% lower than in 2019.
| Year of reference | Relative carbon footprint tCO2e/EUR million invested | Carbon intensity tCO2e/EUR million revenues |
WACI tCO2e/EUR million revenues |
Carbon intensity Year on Year change (%) |
| 2019 | 265,69 | 310,69 | 302,53 | |
| 2020 | 152,26 | 260,09 | 290,66 | -16,29% |
| 2021 | 79,68 | 228,85 | 207,27 | -12,01% |
| 2022 | 65,81 | 163,27 | 160,26 | -28,66% |
| 2023 Q2 | 50,84 | 124,66 | 139,99 | -23,65% |
The carbon intensity of the portfolio at year-end 2021 was 228,85 tCO2e/MEur and that of the same portfolio with the latest available data in June 2023 is 124,66 tCO2e/MEur. Therefore, it can be calculated that portfolio turnover from the end of 2021 to June 2023, net of any change in emissions data, contributed to reducing emission intensity by almost 28%. This means that the change in the portfolio’s composition after methodological interventions explains 61% of the gap, while the change in emissions data accounts for 39% of it.
| Carbon intensity change 2021-2023Q2, of which |
45,53% |
| Change in emissions data, keeping portfolio constant | 17,69pp |
| Change in portfolio turnover | 27,84pp |
Scenario Analysis
The purpose of the scenario analysis is to examine the current and future emission intensity from the direct and indirect emissions of a company (GHG scope 1&2) to see which climate scenario it is aligned with, until 2050. Each company’s carbon budget is defined based on its current and estimated future market share.
The scenario analysis compares the current and future portfolio’s GHG emissions with the carbon budget estimated in different IEA scenarios: Sustainable Development Scenario (SDS), Announced Pledges Scenario (APS) and Stated Policies Scenario (STEPS)[3]. Each scenario is tied to a carbon budget, i.e. a limited amount of fossil carbon that can be combusted worldwide to remain within a certain temperature. The carbon budget changes depending on the scenario, with the Sustainable Development Scenario being the most ambitious one, consistent with a global temperature increase well below 2°C by 2100, compared to pre-industrial levels.
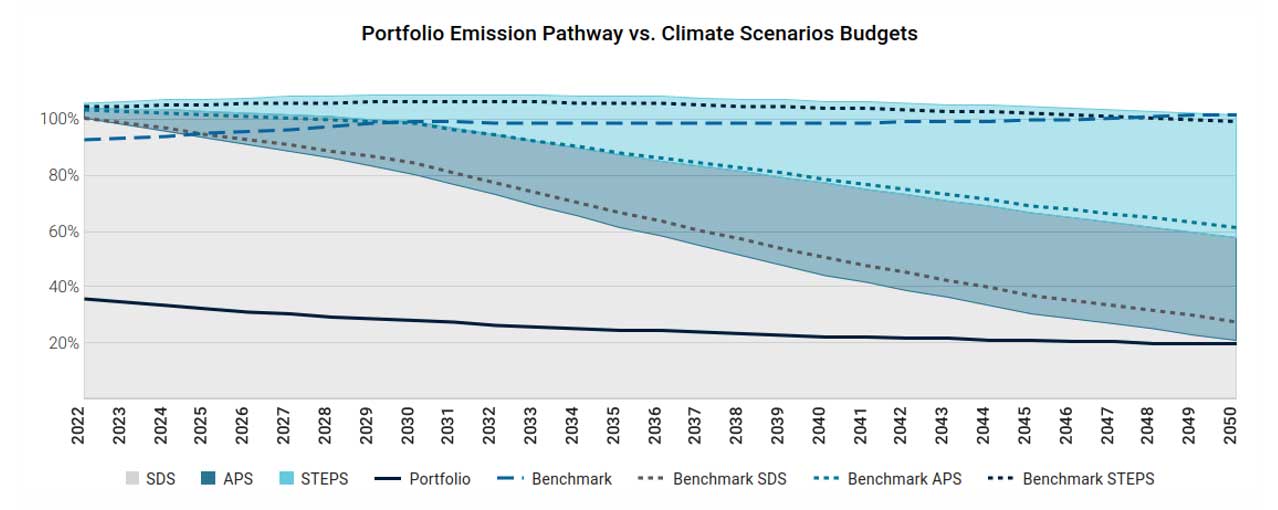
Performance is shown as the percentage of the assigned budget used. The analysis shows that the portfolio at the end of June 2023 is, for the first time, aligned with a projected temperature increase of 1.5°C. In the analysis performed in 2022, Etica’s portfolio was associated with a temperature increase of 2.1°C by 2050 and an overshoot of the carbon budget associated with the SDS scenario in 2038.
The fund outperforms the market, here proxied by the index MSCI World ESG Universal Net Total Return and referred to as “benchmark”, which exceeds the budget of the SDS scenario already in 2026 and is associated with a temperature increase of 2.6°C by 2050.
The better performance of the portfolio compared to the benchmark is explained by two factors, linked to the sectorial allocation and the single stock selection:
- The exclusion of most fossil activities from the portfolio
- A strict selection process concerning all remaining companies involved in any fossil-related activities and those in most polluting businesses.
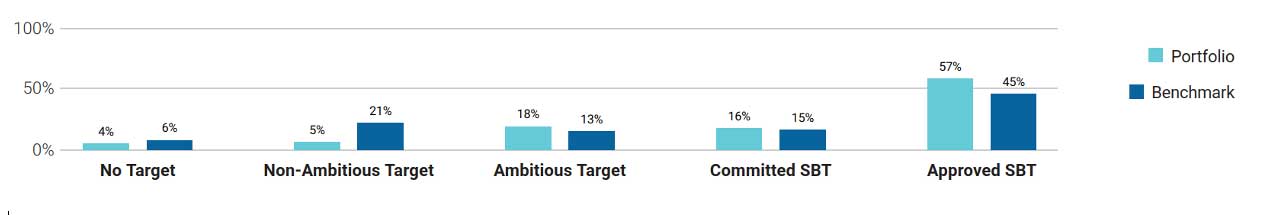
- A higher number of companies with a commitment to reducing emissions compared to the benchmark.
Notably, 57% of the portfolio’s value (51% in the TCFD Report 2022) is covered by a GHG reduction target approved by the Science-Based Targets initiative (SBTi), against 45% of the benchmark.
Transitional climate risks analysis
The transitional climate risks analysis dives into the power generation mix of the portfolio.
Of the overall power generation installed capacity by companies in the portfolio, 69% comes from renewables. In the benchmark index, the share of renewable energy capacity is around 23%.
![]()
The current energy generation mix of the portfolio exhibits a higher share of renewables than in the Sustainable Development Scenario of the International Energy Agency in 2030, which envisages 84% of renewables in 2050 and 53% in 2030.
Transition risks decreased from 2021 to 2023 Q2, with the exposure to fossil fuel reserves falling from 1,38% to 0,95% of total investments, and no proven conversion of such reserves into potential emissions.
Physical risks
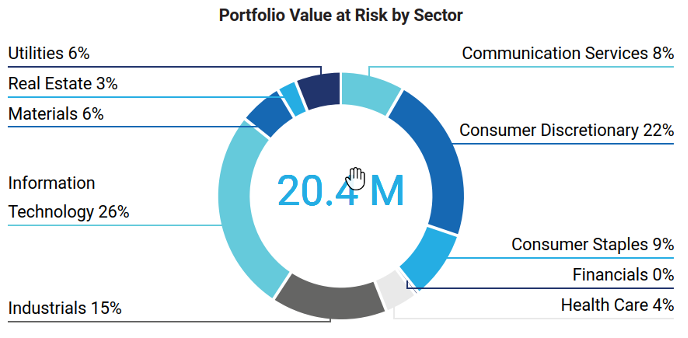
ISS employs a model to estimate the potential value losses, estimated by 2050, arising from the change in share price due to climate physical risks, computing the Value at Risk (VaR) of each issuer. The valuation model considers the following risks: changes in capital value via changes in Property, Plant and Equipment (PP&E), repair costs to damaged assets via investments in Capital Expenditure (CAPEX), increases in production costs via changes in Selling, General and Administrative Expenses, (SG&A) or Cost of Goods Sold (COGS), change in income via sales.
The analysis is based on the most relevant scenarios used as part of the IPCC 5th Assessment Report (AR5). The baseline scenario is built around Representative Concentration Pathway (RCP) 4.5 (1.7-3.2 ℃ temperature rise by 2100). In this scenario, the portfolio value at risk by 2050 is estimated to be 20 EUR million, with the Information technology and Consumer Discretionary being the most exposed ones. This represents a 0,8% loss in the overall portfolio value. The value at risk rises to over 32 EUR million if a worst-case scenario is employed, assuming a temperature increase over 3.2°C.
Conclusions
The main takeaway from the analysis performed in 2021 was to introduce a specific assessment of companies to reduce the carbon footprint of investments. During 2022 a specific climate assessment has been included in the methodology to better monitor GHG emissions in companies operating in Materials, Industrial and Utilities sectors and any business related to fossils. The effects of such changes are fully applied to the portfolios in June 2023.
The portfolio’s carbon intensity at the end of 2022 is lower than in previous years and there is evidence of a steady decrease in the carbon intensity of Valori Responsabili since 2019. Indeed, carbon intensity at the end of June 2023 is 59,88% lower than in 2019, thanks to methodological interventions that occurred during 2021 and 2022 and to the positive performance of companies previously selected for investments.
The scenario analysis shows that the portfolio is now, and for the first time, aligned with a projected temperature increase of 1.5°C.
Sovereign bonds
This section compares the GHG emissions and other related carbon metrics for the sovereign bonds portfolio of Valori Responsabili against the benchmark at year-end 2022, including absolute and relative values for the portfolio’s carbon emissions. Emissions are calculated based on the principles proposed by Platform Carbon Accounting Financials (PCAF)[4], allocating emissions to a sovereign bond through a government’s direct operations as well as from government financing in other sectors of society.
Metrics employed:
- Emission Exposure: it measures scope 1 and 2 GHG emissions of a country, weighted by the share of invested value relative to its GDP (PPP adjusted). It is measured in tCO2
- Weighted Average Carbon intensity: it is expressed as the weighted average scope 1 and 2 GHG emissions per million of GDP as a proxy of the carbon efficiency per unit of output. It is measured in tCO2e/ EUR million GDP.
The portfolio’s emission exposure is 46974 tCO2e.
The Weighted Average Carbon intensity is 17,17%.
| Portfolio | Share of disclosing holdings | Emission exposure (tCO2e) | WACI (tCO2e/MEur) |
| Valori Responsabili | 100% | 46974,79 | 17,17 |
| Benchmark | 100% | 45431,35 | 16,6 |
| Performance | 3,40% | 3,43% |
These metrics are significantly different from those reported last year due to methodological changes in carbon accounting. Therefore, the emission exposure is now based on the GDP and no longer on countries debt.
The portfolio is characterised by a significant overexposure to Italian debt compared to the benchmark. Indeed, Italian debt represents 47% of the total amount invested and it is the major contributor to the portfolio’s overall emission exposure. Note that the methodological shift of relative metrics (i.e. emission exposure) calculus from debt to GDP is not favourable to Italian carbon footprint, as the absolute amount of Italian debt is higher than its GDP. The Italian debt represents a much lower share in the benchmark index, close to that of France, which is the most represented in the index, and Germany. Both France and Germany have a lower debt-to-GDP ratio compared to Italy. This might be the main driver of the change in the comparison between portfolio and the benchmark since last year.
References
[1] https://www.issgovernance.com/esg/
[2] Launched after the 2015 Paris Agreement by the Financial Stability Board (FSB), the Task Force on Climate-related Financial Disclosure (TCFD) considers climate transparency as a crucial factor for the stability of financial markets. The objective of the TCFD is therefore to improve climate transparency in financial markets through recommendations on disclosure. These recommendations provide a “consistent framework that improves the ease of both producing and using climate-related financial disclosures”. The TCFD aims to create a unique standard for both corporate and investment disclosure, understanding that local regulatory frameworks may require different compliance levels.
[3] Details on the scenarios and underlying assumptions are available at World Energy Model – Analysis – IEA